Estimated zip code population in 2022: 1,700 Zip code population in 2010: 1,559 Zip code population in 2000: 1,563
Houses and condos: 912 Renter-occupied apartments: 57
% of renters here:
9%
State:
27%
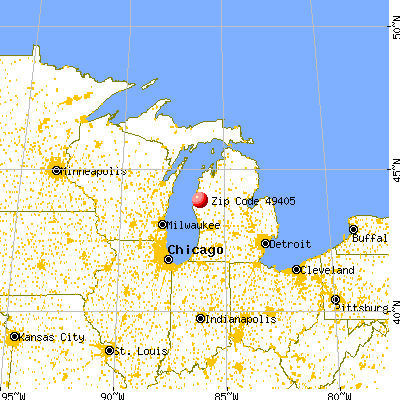
March 2022 cost of living index in zip code 49405: 80.4 (low, U.S. average is 100)
Land area: 69.0 sq. mi. Water area: 0.5 sq. mi.
Population density: 25 people per square mile
(very low).
OSM Map
General Map
Google Map
MSN Map
OSM Map
General Map
Google Map
MSN Map
OSM Map
General Map
Google Map
MSN Map
OSM Map
General Map
Google Map
MSN Map
Please wait while loading the map...
Real estate property taxes paid for housing units in 2022:
This zip code:
1.0% ($1,451)
Michigan:
1.2% ($2,746)
Median real estate property taxes paid for housing units with mortgages in 2022: $1,510 (0.9%) Median real estate property taxes paid for housing units with no mortgage in 2022: $1,361 (1.4%)
Business Search- 14 Million verified businesses
Males: 894
(52.6%)
Females: 806
(47.4%)
For population 25 years and over in 49405:
High school or higher: 93.1%
Bachelor's degree or higher: 18.3%
Graduate or professional degree: 7.6%
Unemployed: 8.5%
Mean travel time to work (commute): 27.2 minutes
For population 15 years and over in 49405:
Never married: 28.4%
Now married: 52.6%
Separated: 1.3%
Widowed: 5.2%
Divorced: 12.5%
Zip code 49405 compared to state average:
Median house value below state average.
Unemployed percentage above state average.
Black race population percentage significantly below state average.
Foreign-born population percentage significantly below state average.
Renting percentage significantly below state average.
Length of stay since moving in significantly above state average.
Number of college students below state average.
Percentage of population with a bachelor's degree or higher below state average.
Estimated median house/condo value in 2022: $139,036
49405:
$139,036
Michigan:
$224,400
According to our research of Michigan and other state lists, there were 5 registered sex offenders living in 49405 zip code as of July 03, 2024. The ratio of all residents to sex offenders in zip code 49405 is 286 to 1. The ratio of registered sex offenders to all residents in this zip code is near the state average.
Median resident age:
This zip code:
40.9 years
Michigan median age:
40.3 years
Average household size:
This zip code:
2.7 people
Michigan:
2.4 people
Averages for the 2020 tax year for zip code 49405, filed in 2021:
Average Adjusted Gross Income (AGI) in 2020: $50,044 (Individual Income Tax Returns)
Here:
$50,044
State:
$68,945
Salary/wage: $42,676 (reported on 76.6% of returns)
Here:
$42,676
State:
$57,142
(% of AGI for various income ranges: 1058.9% for AGIs below $25k, 3560.0% for AGIs $25k-50k, 6117.5% for AGIs $50k-75k, 7670.0% for AGIs $75k-100k, 19937.5% for AGIs $100k-200k)
Taxable interest for individuals: $368 (reported on 28.6% of returns)
This zip code:
$368
Michigan:
$1,630
(% of AGI for various income ranges: 10.5% for AGIs below $25k, 6.9% for AGIs $25k-50k, 22.5% for AGIs $50k-75k, 20.0% for AGIs $75k-100k, 50.0% for AGIs $100k-200k)
Ordinary dividends: $2,920 (reported on 13.0% of returns)
Here:
$2,920
State:
$6,972
(% of AGI for various income ranges: 12.1% for AGIs below $25k, 8.8% for AGIs $25k-50k, 91.2% for AGIs $50k-75k, 303.3% for AGIs $75k-100k)
Net capital gain/loss in AGI: +$5,910 (reported on 13.0% of returns)
Here:
+$5,910
State:
+$20,064
(% of AGI for various income ranges: 32.1% for AGIs below $25k, 151.2% for AGIs $50k-75k, 1022.5% for AGIs $100k-200k)
Profit/loss from business: +$3,750 (reported on 15.6% of returns)
Here:
+$3,750
State:
+$11,172
(% of AGI for various income ranges: 80.0% for AGIs below $25k, 207.5% for AGIs $25k-50k)
Taxable individual retirement arrangement distribution: $12,144 (reported on 11.7% of returns)
49405:
$12,144
Michigan:
$19,803
(% of AGI for various income ranges: 74.2% for AGIs below $25k, 220.6% for AGIs $25k-50k, 998.3% for AGIs $75k-100k)
Total itemized deductions: $31,550 (reported on 2.6% of returns)
Here:
$31,550
State:
$34,117
(% of AGI for various income ranges: 788.8% for AGIs $50k-75k)
Earned income credit: $2,231 (reported on 16.9% of returns)
Here:
$2,231
State:
$2,251
(% of AGI for various income ranges: 97.9% for AGIs below $25k, 65.0% for AGIs $25k-50k)
Percentage of individuals using paid preparers for their 2020 taxes: 96.1%
Here:
96%
State:
93%
(% for various income ranges: 93.1% for AGIs below $25k, 95.2% for AGIs $25k-50k, 100.0% for AGIs $50k-75k, 100.0% for AGIs $75k-100k, 100.0% for AGIs $100k-200k)
Averages for the 2012 tax year for zip code 49405, filed in 2013:
Average Adjusted Gross Income (AGI) in 2012: $37,704 (Individual Income Tax Returns)
Here:
$37,704
State:
$55,609
Salary/wage: $31,335 (reported on 82.9% of returns)
Here:
$31,335
State:
$46,782
(% of AGI for various income ranges: 76.9% for AGIs below $25k, 72.3% for AGIs $25k-50k, 75.7% for AGIs $50k-75k, 71.0% for AGIs $75k-100k, 51.1% for AGIs $100k-200k)
Taxable interest for individuals: $587 (reported on 30.3% of returns)
This zip code:
$587
Michigan:
$1,491
(% of AGI for various income ranges: 1.0% for AGIs below $25k, 0.6% for AGIs $25k-50k, 0.2% for AGIs $50k-75k, 0.5% for AGIs $75k-100k, 0.2% for AGIs $100k-200k)
Ordinary dividends: $2,200 (reported on 14.5% of returns)
Here:
$2,200
State:
$6,225
(% of AGI for various income ranges: 0.8% for AGIs below $25k, 0.8% for AGIs $25k-50k, 1.0% for AGIs $50k-75k, 1.9% for AGIs $75k-100k)
Net capital gain/loss in AGI: +$3,014 (reported on 9.2% of returns)
Here:
+$3,014
State:
+$9,326
Profit/loss from business: +$3,730 (reported on 13.2% of returns)
Here:
+$3,730
State:
+$11,523
(% of AGI for various income ranges: 3.6% for AGIs below $25k, 2.1% for AGIs $25k-50k, 1.0% for AGIs $50k-75k)
Taxable individual retirement arrangement distribution: $9,000 (reported on 9.2% of returns)
49405:
$9,000
Michigan:
$15,298
(% of AGI for various income ranges: 4.3% for AGIs below $25k, 3.2% for AGIs $25k-50k, 3.2% for AGIs $50k-75k)
Total itemized deductions: $19,921 (24% of AGI, reported on 18.4% of returns)
Here:
$19,921
State:
$21,628
Here:
24.1% of AGI
State:
18.4% of AGI
(% of AGI for various income ranges: 6.0% for AGIs below $25k, 7.7% for AGIs $25k-50k, 11.4% for AGIs $50k-75k, 10.0% for AGIs $75k-100k, 12.6% for AGIs $100k-200k)
Charity contributions: $3,422 (reported on 11.8% of returns)
Here:
$3,422
State:
$4,225
(% of AGI for various income ranges: 0.9% for AGIs $25k-50k, 2.2% for AGIs $50k-75k, 1.6% for AGIs $100k-200k)
Taxes paid: $5,521 (reported on 18.4% of returns)
49405:
$5,521
State:
$8,327
(% of AGI for various income ranges: 1.2% for AGIs below $25k, 1.8% for AGIs $25k-50k, 2.8% for AGIs $50k-75k, 3.2% for AGIs $75k-100k, 4.2% for AGIs $100k-200k)
Earned income credit: $2,061 (reported on 23.7% of returns)
Here:
$2,061
State:
$2,306
(% of AGI for various income ranges: 6.2% for AGIs below $25k, 1.4% for AGIs $25k-50k)
Percentage of individuals using paid preparers for their 2012 taxes: 56.6%
Here:
57%
State:
57%
(% for various income ranges: 48.6% for AGIs below $25k, 63.2% for AGIs $25k-50k, 63.6% for AGIs $50k-75k, 60.0% for AGIs $75k-100k, 75.0% for AGIs $100k-200k)
Averages for the 2004 tax year for zip code 49405, filed in 2005:
Average Adjusted Gross Income (AGI) in 2004: $33,009 (Individual Income Tax Returns)
Here:
$33,009
State:
$48,204
Salary/wage: $29,446 (reported on 85.5% of returns)
Here:
$29,446
State:
$42,791
(% of AGI for various income ranges: 112.5% for AGIs below $10k, 71.9% for AGIs $10k-25k, 78.5% for AGIs $25k-50k, 82.3% for AGIs $50k-75k, 80.6% for AGIs $75k-100k, 56.1% for AGIs over 100k)
Taxable interest for individuals: $1,058 (reported on 42.3% of returns)
This zip code:
$1,058
Michigan:
$1,725
(% of AGI for various income ranges: 6.9% for AGIs below $10k, 2.8% for AGIs $10k-25k, 1.8% for AGIs $25k-50k, 0.7% for AGIs $50k-75k, 0.3% for AGIs $75k-100k, 0.5% for AGIs over 100k)
Taxable dividends: $1,911 (reported on 19.4% of returns)
Here:
$1,911
State:
$3,420
(% of AGI for various income ranges: 4.1% for AGIs below $10k, 1.8% for AGIs $10k-25k, 1.3% for AGIs $25k-50k, 0.6% for AGIs $50k-75k, 0.2% for AGIs $75k-100k, 1.6% for AGIs over 100k)
Net capital gain/loss: +$848 (reported on 15.1% of returns)
Here:
+$848
State:
+$8,532
(% of AGI for various income ranges: -2.2% for AGIs below $10k, 0.9% for AGIs $10k-25k, 0.6% for AGIs $25k-50k, -0.0% for AGIs $50k-75k, 1.1% for AGIs $75k-100k)
Profit/loss from business: +$4,921 (reported on 16.4% of returns)
Here:
+$4,921
State:
+$9,547
(% of AGI for various income ranges: -4.3% for AGIs below $10k, 9.0% for AGIs $10k-25k, -0.0% for AGIs $25k-50k, 5.2% for AGIs $50k-75k)
IRA payment deduction: $2,364 (reported on 1.6% of returns)
49405:
$2,364
Michigan:
$2,875
Total itemized deductions: $16,027 (25% of AGI, reported on 21.4% of returns)
Here:
$16,027
State:
$18,509
Here:
25.2% of AGI
State:
20.7% of AGI
(% of AGI for various income ranges: 10.3% for AGIs $10k-25k, 10.2% for AGIs $25k-50k, 9.0% for AGIs $50k-75k, 10.8% for AGIs $75k-100k, 14.5% for AGIs over 100k)
Charity contributions deductions: $3,169 (5% of AGI, reported on 17.8% of returns)
Here:
$3,169
State:
$3,365
Here:
4.8% of AGI
State:
3.6% of AGI
(% of AGI for various income ranges: 1.4% for AGIs $10k-25k, 1.5% for AGIs $25k-50k, 1.6% for AGIs $50k-75k, 1.7% for AGIs $75k-100k, 3.0% for AGIs over 100k)
Total tax: $3,797 (reported on 68.6% of returns)
49405:
$3,797
State:
$7,691
(% of AGI for various income ranges: 3.0% for AGIs below $10k, 4.4% for AGIs $10k-25k, 6.0% for AGIs $25k-50k, 8.9% for AGIs $50k-75k, 11.0% for AGIs $75k-100k, 10.8% for AGIs over 100k)
Earned income credit: $2,084 (reported on 15.4% of returns)
Here:
$2,084
State:
$1,737
Percentage of individuals using paid preparers for their 2004 taxes: 59.6%
Here:
60%
State:
60%
(% for various income ranges: 55.4% for AGIs below $10k, 57.9% for AGIs $10k-25k, 60.4% for AGIs $25k-50k, 61.5% for AGIs $50k-75k, 65.8% for AGIs $75k-100k, 81.0% for AGIs over 100k)
Household received Food Stamps/SNAP in the past 12 months: 106 Household did not receive Food Stamps/SNAP in the past 12 months: 521
Women who had a birth in the past 12 months: 23 (14 now married, 9 unmarried) Women who did not have a birth in the past 12 months: 330 (138 now married, 191 unmarried)
Housing units in zip code 49405 with a mortgage: 329 (31 second mortgage, 28 both second mortgage and home equity loan) Houses without a mortgage: 11
Median monthly owner costs for units with a mortgage: $1,137 Median monthly owner costs for units without a mortgage: $459
Residents with income below the poverty level in 2022:
This zip code:
13.2%
Whole state:
13.4%
Residents with income below 50% of the poverty level in 2022:
This zip code:
9.1%
Whole state:
6.9%
Median number of rooms in houses and condos:
Here:
6.1
State:
6.5
Median number of rooms in apartments:
Here:
4.9
State:
4.3
Notable locations in this zip code not listed on our city pages
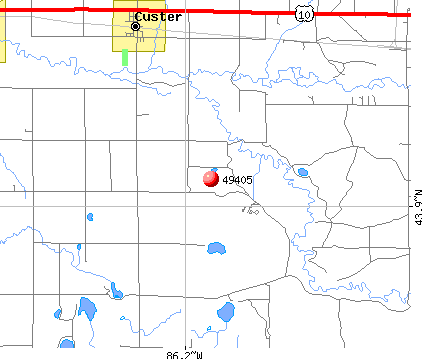
Notable locations in zip code 49405: Reek School (A), Weldon Creek Station (B), Custer Station (C), Custer Fire Department (D). Display/hide their locations on the map
Lakes and swamps: Bailey Lake (A), Clancy Lake (B), Dockery Lake (C), Whelan Lake (D), Eden Lake (E), Ordway Lake (F), Mobey Lake (G), Woodruff Lake (H). Display/hide their locations on the map
Rivers and creeks: Black Creek (A), Big South Branch Pere Marquette River (B), Weldon Creek (C), Hatting Creek (D), Whiskey Creek (E). Display/hide their locations on the map
In group quarters: 29 (-1 institutionalized population)
Size of family households: 207 2-persons, 81 3-persons, 97 4-persons, 45 5-persons, 18 6-persons, 17 7-or-more-persons
Size of nonfamily households: 113 1-person, 42 2-persons
276 married couples with children.
62 single-parent households (42 men, 20 women).
98.1% of residents of 49405 zip code speak English at home.
1.0% of residents speak Spanish at home (38% very well, 62% not well).
0.4% of residents speak other Indo-European language at home (100% very well).
0.1% of residents speak Asian or Pacific Island language at home (100% very well).
Foreign born population: 11 (0.7%) (100.0% of them are naturalized citizens)
This zip code:
0.7%
Whole state:
6.9%
64%France
18%Malaysia
17%German
16%American
9%Polish
7%English
5%Irish
4%Dutch
3%Swedish
Year of entry for the foreign-born population
72010 or later
02000 to 2009
01990 to 1999
3Before 1990
Facilities with environmental interests located in this zip code:
FRESH AIR FARMS LLC (WEST SIDE STEPHENS RD BETWEEN in CUSTER, MI)
National Pollutant Discharge Elimination System NON-MAJOR (Tracking pollutant discharge elimination systems) - permit Business SIC classification: HOGS
Housing units lacking complete plumbing facilities: 4.6% Housing units lacking complete kitchen facilities: 3.2%
47.0%Bottled, tank, or LP gas
19.8%Utility gas
19.0%Wood
6.2%Electricity
5.7%Other fuel
1.8%No fuel used
1.0%Fuel oil, kerosene, etc.
Population in 1990: 1,002. Population change in the 1990s: +561 (+56.0%).
Place of birth for U.S.-born residents:
This state: 1,515
Northeast: 32
Midwest: 66
South: 49
West: 23
64% of the 49405 zip code residents lived in the same house 5 years ago. Out of people who lived in different houses, 62% lived in this county. Out of people who lived in different counties, 50% lived in Michigan.
93% of the 49405 zip code residents lived in the same house 1 year ago. Out of people who lived in different houses, 22% moved from this county. Out of people who lived in different houses, 20% moved from different county within same state. Out of people who lived in different houses, 64% moved from different state. Out of people who lived in different houses, 2% moved from abroad.
Private vs. public school enrollment:
Students in private schools in grades 1 to 8 (elementary and middle school): 13
Here:
9.5%
Michigan:
12.4%
Students in private schools in grades 9 to 12 (high school): 1
Here:
2.3%
Michigan:
9.8%
Students in private undergraduate colleges: 7
Here:
20.9%
Michigan:
14.9%
Occupation by median earnings in the past 12 months ($)
80,493Education, training, and library occupations
68,668Health diagnosing and treating practitioners and other technical occupations
66,897Installation, maintenance, and repair occupations
63,375Arts, design, entertainment, sports, and media occupations
55,060Law enforcement workers including supervisors
53,961Computer and mathematical occupations
Top industries in this zip code by the number of employees in 2005:
Accommodation and Food Services: Hotels (except Casino Hotels) and Motels (20-49 employees: 1 establishment)
Accommodation and Food Services: Drinking Places (Alcoholic Beverages) (10-19: 1)
Health Care and Social Assistance: Homes for the Elderly (5-9: 1)
Other Services (except Public Administration): Labor Unions and Similar Labor Organizations (5-9: 1)
Accommodation and Food Services: Full-Service Restaurants (5-9: 1)
Health Care and Social Assistance: Other Residential Care Facilities (5-9: 1)
People in group quarters in 2000:
20 people in other group homes
12 people in agriculture workers' dormitories on farms
7 people in nursing homes
Fatal accident statistics in 2013:
Fatal accident count: 1
Vehicles involved in fatal accidents: 1
Fatal accidents caused by drunken drivers: 0
Fatalities: 1
Persons involved in fatal accidents: 1
Pedestrians involved in fatal accidents: 0
Fatal accident statistics in 2011:
Fatal accident count: 3
Vehicles involved in fatal accidents: 5
Fatal accidents caused by drunken drivers: 1
Fatalities: 3
Persons involved in fatal accidents: 8
Pedestrians involved in fatal accidents: 0
2002 - 2018 National Fire Incident Reporting System (NFIRS) incidents
According to the data from the years 2002 - 2018 the average number of fires per year is 10. The highest number of fire incidents - 19 took place in 2004, and the least - 3 in 2008. The data has a declining trend.
When looking into fire subcategories, the most incidents belonged to: Structure Fires (59.4%), and Outside Fires (27.9%).
Fire incident types reported to NFIRS in Zip Code 49405


 Nearest zip codes: 49458, 49454, 49410, 49402, 49459, 49411.


 According to the data from the years 2002 - 2018 the average number of fires per year is 10. The highest number of fire incidents - 19 took place in 2004, and the least - 3 in 2008. The data has a declining trend.
 When looking into fire subcategories, the most incidents belonged to: Structure Fires (59.4%), and Outside Fires (27.9%).