Estimated zip code population in 2022: 2,094 Zip code population in 2010: 2,099 Zip code population in 2000: 1,925
Houses and condos: 1,096 Renter-occupied apartments: 57
% of renters here:
7%
State:
27%
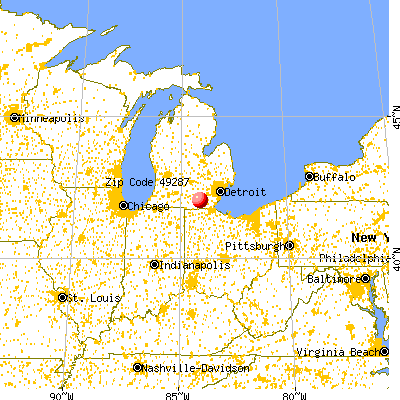
March 2022 cost of living index in zip code 49287: 87.9 (less than average, U.S. average is 100)
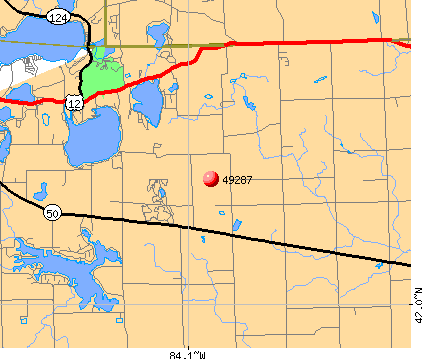
Land area: 28.1 sq. mi. Water area: 0.6 sq. mi.
Population density: 74 people per square mile
(very low).
OSM Map
General Map
Google Map
MSN Map
OSM Map
General Map
Google Map
MSN Map
OSM Map
General Map
Google Map
MSN Map
OSM Map
General Map
Google Map
MSN Map
Please wait while loading the map...
Real estate property taxes paid for housing units in 2022:
This zip code:
1.1% ($2,650)
Michigan:
1.2% ($2,746)
Median real estate property taxes paid for housing units with mortgages in 2022: $2,533 (1.2%) Median real estate property taxes paid for housing units with no mortgage in 2022: $2,812 (1.0%)
Estimated median house/condo value in 2022: $243,481
49287:
$243,481
Michigan:
$224,400
According to our research of Michigan and other state lists, there were 6 registered sex offenders living in 49287 zip code as of July 17, 2024. The ratio of all residents to sex offenders in zip code 49287 is 318 to 1. The ratio of registered sex offenders to all residents in this zip code is near the state average.
Median resident age:
This zip code:
49.5 years
Michigan median age:
40.3 years
Average household size:
This zip code:
2.5 people
Michigan:
2.4 people
Averages for the 2020 tax year for zip code 49287, filed in 2021:
Average Adjusted Gross Income (AGI) in 2020: $65,900 (Individual Income Tax Returns)
Here:
$65,900
State:
$68,945
Salary/wage: $56,490 (reported on 77.9% of returns)
Here:
$56,490
State:
$57,142
(% of AGI for various income ranges: 1032.5% for AGIs below $25k, 3135.0% for AGIs $25k-50k, 6157.3% for AGIs $50k-75k, 8332.2% for AGIs $75k-100k, 15686.0% for AGIs $100k-200k)
Taxable interest for individuals: $668 (reported on 32.7% of returns)
This zip code:
$668
Michigan:
$1,630
(% of AGI for various income ranges: 15.0% for AGIs below $25k, 22.8% for AGIs $25k-50k, 45.5% for AGIs $50k-75k, 12.2% for AGIs $75k-100k, 68.0% for AGIs $100k-200k)
Ordinary dividends: $3,515 (reported on 19.2% of returns)
Here:
$3,515
State:
$6,972
(% of AGI for various income ranges: 40.0% for AGIs below $25k, 42.2% for AGIs $25k-50k, 78.2% for AGIs $50k-75k, 97.8% for AGIs $75k-100k, 167.0% for AGIs $100k-200k)
Net capital gain/loss in AGI: +$7,394 (reported on 16.3% of returns)
Here:
+$7,394
State:
+$20,064
(% of AGI for various income ranges: 4.5% for AGIs below $25k, 33.3% for AGIs $25k-50k, 79.1% for AGIs $50k-75k, 76.7% for AGIs $75k-100k, 230.0% for AGIs $100k-200k)
Profit/loss from business: +$10,157 (reported on 13.5% of returns)
Here:
+$10,157
State:
+$11,172
(% of AGI for various income ranges: 59.0% for AGIs below $25k, 388.3% for AGIs $25k-50k, 241.1% for AGIs $75k-100k, 388.0% for AGIs $100k-200k)
Taxable individual retirement arrangement distribution: $15,624 (reported on 16.3% of returns)
49287:
$15,624
Michigan:
$19,803
(% of AGI for various income ranges: 85.5% for AGIs below $25k, 237.2% for AGIs $25k-50k, 383.6% for AGIs $50k-75k, 475.6% for AGIs $75k-100k, 1208.0% for AGIs $100k-200k)
Total itemized deductions: $28,200 (reported on 5.8% of returns)
Here:
$28,200
State:
$34,117
(% of AGI for various income ranges: 659.1% for AGIs $50k-75k, 967.0% for AGIs $100k-200k)
Charity contributions: $7,450 (reported on 3.8% of returns)
Here:
$7,450
State:
$13,548
(% of AGI for various income ranges: 298.0% for AGIs $100k-200k)
Taxes paid: $7,900 (reported on 5.8% of returns)
49287:
$7,900
State:
$7,972
(% of AGI for various income ranges: 171.8% for AGIs $50k-75k, 285.0% for AGIs $100k-200k)
Earned income credit: $1,700 (reported on 9.6% of returns)
Here:
$1,700
State:
$2,251
(% of AGI for various income ranges: 51.0% for AGIs below $25k, 37.8% for AGIs $25k-50k)
Percentage of individuals using paid preparers for their 2020 taxes: 95.2%
Here:
95%
State:
93%
(% for various income ranges: 93.5% for AGIs below $25k, 95.8% for AGIs $25k-50k, 94.1% for AGIs $50k-75k, 100.0% for AGIs $75k-100k, 93.8% for AGIs $100k-200k, 100.0% for AGIs over 200k)
Averages for the 2012 tax year for zip code 49287, filed in 2013:
Average Adjusted Gross Income (AGI) in 2012: $54,662 (Individual Income Tax Returns)
Here:
$54,662
State:
$55,609
Salary/wage: $47,088 (reported on 83.7% of returns)
Here:
$47,088
State:
$46,782
(% of AGI for various income ranges: 66.8% for AGIs below $25k, 62.2% for AGIs $25k-50k, 69.5% for AGIs $50k-75k, 76.6% for AGIs $75k-100k, 103.0% for AGIs $100k-200k)
Taxable interest for individuals: $713 (reported on 38.8% of returns)
This zip code:
$713
Michigan:
$1,491
(% of AGI for various income ranges: 1.9% for AGIs below $25k, 0.9% for AGIs $25k-50k, 0.4% for AGIs $50k-75k, 0.2% for AGIs $75k-100k, 0.4% for AGIs $100k-200k)
Ordinary dividends: $2,828 (reported on 18.4% of returns)
Here:
$2,828
State:
$6,225
(% of AGI for various income ranges: 1.4% for AGIs below $25k, 1.5% for AGIs $25k-50k, 0.6% for AGIs $50k-75k, 0.5% for AGIs $75k-100k, 1.5% for AGIs $100k-200k)
Net capital gain/loss in AGI: +$3,769 (reported on 13.3% of returns)
Here:
+$3,769
State:
+$9,326
(% of AGI for various income ranges: 0.6% for AGIs $25k-50k, 1.0% for AGIs $50k-75k, 2.3% for AGIs $100k-200k)
Profit/loss from business: +$7,300 (reported on 16.3% of returns)
Here:
+$7,300
State:
+$11,523
(% of AGI for various income ranges: 4.4% for AGIs below $25k, 1.5% for AGIs $25k-50k, 3.4% for AGIs $50k-75k, 0.7% for AGIs $75k-100k, 3.0% for AGIs $100k-200k)
Taxable individual retirement arrangement distribution: $10,977 (reported on 13.3% of returns)
49287:
$10,977
Michigan:
$15,298
(% of AGI for various income ranges: 4.7% for AGIs below $25k, 4.3% for AGIs $25k-50k, 5.7% for AGIs $50k-75k, 2.4% for AGIs $100k-200k)
Total itemized deductions: $19,694 (22% of AGI, reported on 36.7% of returns)
Here:
$19,694
State:
$21,628
Here:
22.2% of AGI
State:
18.4% of AGI
(% of AGI for various income ranges: 11.9% for AGIs below $25k, 11.1% for AGIs $25k-50k, 12.5% for AGIs $50k-75k, 13.0% for AGIs $75k-100k, 14.1% for AGIs $100k-200k, 16.2% for AGIs over 200k)
Charity contributions: $2,679 (reported on 28.6% of returns)
Here:
$2,679
State:
$4,225
(% of AGI for various income ranges: 1.0% for AGIs below $25k, 1.5% for AGIs $25k-50k, 1.6% for AGIs $50k-75k, 1.0% for AGIs $75k-100k, 2.1% for AGIs $100k-200k)
Taxes paid: $7,197 (reported on 36.7% of returns)
49287:
$7,197
State:
$8,327
(% of AGI for various income ranges: 2.2% for AGIs below $25k, 2.9% for AGIs $25k-50k, 3.4% for AGIs $50k-75k, 4.9% for AGIs $75k-100k, 5.8% for AGIs $100k-200k, 8.8% for AGIs over 200k)
Earned income credit: $1,975 (reported on 12.2% of returns)
Here:
$1,975
State:
$2,306
(% of AGI for various income ranges: 3.7% for AGIs below $25k, 1.2% for AGIs $25k-50k)
Percentage of individuals using paid preparers for their 2012 taxes: 60.2%
Here:
60%
State:
57%
(% for various income ranges: 54.3% for AGIs below $25k, 61.9% for AGIs $25k-50k, 60.0% for AGIs $50k-75k, 61.5% for AGIs $75k-100k, 66.7% for AGIs $100k-200k, 100.0% for AGIs over 200k)
Averages for the 2004 tax year for zip code 49287, filed in 2005:
Average Adjusted Gross Income (AGI) in 2004: $48,433 (Individual Income Tax Returns)
Here:
$48,433
State:
$48,204
Salary/wage: $46,517 (reported on 84.6% of returns)
Here:
$46,517
State:
$42,791
(% of AGI for various income ranges: 83.3% for AGIs below $10k, 62.6% for AGIs $10k-25k, 69.5% for AGIs $25k-50k, 85.5% for AGIs $50k-75k, 89.6% for AGIs $75k-100k, 81.2% for AGIs over 100k)
Taxable interest for individuals: $891 (reported on 52.7% of returns)
This zip code:
$891
Michigan:
$1,725
(% of AGI for various income ranges: 8.9% for AGIs below $10k, 2.6% for AGIs $10k-25k, 1.6% for AGIs $25k-50k, 0.8% for AGIs $50k-75k, 0.2% for AGIs $75k-100k, 0.6% for AGIs over 100k)
Taxable dividends: $1,247 (reported on 25.7% of returns)
Here:
$1,247
State:
$3,420
(% of AGI for various income ranges: 5.0% for AGIs below $10k, 1.4% for AGIs $10k-25k, 0.9% for AGIs $25k-50k, 0.7% for AGIs $50k-75k, 0.4% for AGIs $75k-100k, 0.4% for AGIs over 100k)
Net capital gain/loss: +$3,337 (reported on 17.3% of returns)
Here:
+$3,337
State:
+$8,532
(% of AGI for various income ranges: 12.2% for AGIs below $10k, -0.4% for AGIs $10k-25k, 0.3% for AGIs $25k-50k, -0.1% for AGIs $50k-75k, 0.9% for AGIs $75k-100k, 3.0% for AGIs over 100k)
Profit/loss from business: +$3,448 (reported on 14.4% of returns)
Here:
+$3,448
State:
+$9,547
(% of AGI for various income ranges: 11.7% for AGIs below $10k, 3.7% for AGIs $10k-25k, 4.4% for AGIs $25k-50k, -0.9% for AGIs $50k-75k, 0.2% for AGIs $75k-100k, 0.4% for AGIs over 100k)
IRA payment deduction: $2,364 (reported on 1.1% of returns)
49287:
$2,364
Michigan:
$2,875
Total itemized deductions: $15,897 (21% of AGI, reported on 44.2% of returns)
Here:
$15,897
State:
$18,509
Here:
20.9% of AGI
State:
20.7% of AGI
(% of AGI for various income ranges: 26.0% for AGIs below $10k, 11.7% for AGIs $10k-25k, 11.2% for AGIs $25k-50k, 16.9% for AGIs $50k-75k, 14.3% for AGIs $75k-100k, 14.2% for AGIs over 100k)
Charity contributions deductions: $1,949 (2% of AGI, reported on 37.5% of returns)
Here:
$1,949
State:
$3,365
Here:
2.5% of AGI
State:
3.6% of AGI
(% of AGI for various income ranges: 2.7% for AGIs below $10k, 1.7% for AGIs $10k-25k, 0.9% for AGIs $25k-50k, 2.0% for AGIs $50k-75k, 1.1% for AGIs $75k-100k, 1.5% for AGIs over 100k)
Total tax: $6,229 (reported on 80.8% of returns)
49287:
$6,229
State:
$7,691
(% of AGI for various income ranges: 3.8% for AGIs below $10k, 4.6% for AGIs $10k-25k, 7.9% for AGIs $25k-50k, 8.3% for AGIs $50k-75k, 10.1% for AGIs $75k-100k, 15.7% for AGIs over 100k)
Earned income credit: $1,625 (reported on 7.3% of returns)
Here:
$1,625
State:
$1,737
Percentage of individuals using paid preparers for their 2004 taxes: 66.3%
Here:
66%
State:
60%
(% for various income ranges: 64.4% for AGIs below $10k, 65.9% for AGIs $10k-25k, 68.8% for AGIs $25k-50k, 66.7% for AGIs $50k-75k, 64.5% for AGIs $75k-100k, 67.4% for AGIs over 100k)
Notable locations in zip code 49287: Tecumseh Woods Camp (A), Jado Park Campground (B), Sand Lake Volunteer Fire Department Station 2 (C), Sand Lake Volunteer Fire Department Station 1 (D). Display/hide their locations on the map
Size of family households: 309 2-persons, 165 3-persons, 156 4-persons, 4 5-persons, 14 7-or-more-persons
Size of nonfamily households: 170 1-person, 11 2-persons, 3 3-persons
199 married couples with children.
59 single-parent households (59 men).
99.7% of residents of 49287 zip code speak English at home.
Foreign born population: 32 (1.6%) (37.6% of them are naturalized citizens)
This zip code:
1.6%
Whole state:
6.9%
33%Sweden
25%German
18%American
14%English
8%Dutch
7%Irish
6%Scottish
5%Ukrainian
Year of entry for the foreign-born population
02010 or later
02000 to 2009
01990 to 1999
30Before 1990
Facilities with environmental interests located in this zip code:
LAKESIDE PARTY STORE (6001 US 12 in TIPTON, MI)
(Resource Conservation and Recovery Act (tracking hazardous waste)) Organizations: ROBERT BRUGGENWIRTH (CONTACT/OWNER)
Alternative names: LAKESIDE PARTY STORE - PM ENVIRONMENTAL
LENAWEE CDC-WAMPLERS LK WWSL (LENAWEE COUNTY DRAIN COMMISS. in TIPTON, MI)
National Pollutant Discharge Elimination System NON-MAJOR (Tracking pollutant discharge elimination systems) - permit Business SIC classification: SEWERAGE SYSTEMS Organizations: LENAWEE COUNTY DRAIN COMMISS. (CONTACT/OWNER)
LENAWEE CDC-WAMPLERS LK WWSL (6213 TRIPP ROAD in TIPTON, MI)
National Pollutant Discharge Elimination System NON-MAJOR (Tracking pollutant discharge elimination systems) - permit Business SIC classification: SEWERAGE SYSTEMS
49.4%Utility gas
28.9%Bottled, tank, or LP gas
7.7%Electricity
7.7%Fuel oil, kerosene, etc.
6.6%Wood
Population in 1990: 2,473.
Place of birth for U.S.-born residents:
This state: 1,819
Northeast: 39
Midwest: 168
South: 7
West: 24
68% of the 49287 zip code residents lived in the same house 5 years ago. Out of people who lived in different houses, 48% lived in this county. Out of people who lived in different counties, 50% lived in Michigan.
88% of the 49287 zip code residents lived in the same house 1 year ago. Out of people who lived in different houses, 97% moved from different county within same state.
Private vs. public school enrollment:
Students in private schools in grades 1 to 8 (elementary and middle school):
Here:
0.0%
Michigan:
12.4%
Students in private schools in grades 9 to 12 (high school):
Here:
0.0%
Michigan:
9.8%
Students in private undergraduate colleges:
Here:
0.0%
Michigan:
14.9%
Occupation by median earnings in the past 12 months ($)
82,660Management occupations
76,616Installation, maintenance, and repair occupations
73,394Health diagnosing and treating practitioners and other technical occupations
62,961Office and administrative support occupations
52,112Production occupations
32,832Construction and extraction occupations
Top industries in this zip code by the number of employees in 2005:
Administrative and Support and Waste Management and Remediation Services: Landscaping Services (10-19 employees: 1 establishment)
Construction: Plumbing, Heating, and Air-Conditioning Contractors (5-9: 1, 1-4: 4)
Construction: Water and Sewer Line and Related Structures Construction (10-19: 1)
Construction: Electrical Contractors (5-9: 2)
Administrative and Support and Waste Management and Remediation Services: Carpet and Upholstery Cleaning Services (5-9: 1)
Construction: New Single-Family Housing Construction (except Operative Builders) (1-4: 3)
Other Services (except Public Administration): Religious Organizations (1-4: 2)
Accommodation and Food Services: Full-Service Restaurants (1-4: 2)
Construction: Residential Remodelers (1-4: 1)
Home Mortgage Disclosure Act Aggregated Statistics For Year 2003 (Based on 2 partial tracts)
A) FHA, FSA/RHS & VA Home Purchase Loans
B) Conventional Home Purchase Loans
C) Refinancings
D) Home Improvement Loans
F) Non-occupant Loans on < 5 Family Dwellings (A B C & D)
Number
Average Value
Number
Average Value
Number
Average Value
Number
Average Value
Number
Average Value
LOANS ORIGINATED
9
$141,753
144
$149,583
616
$141,013
19
$40,232
87
$150,966
APPLICATIONS APPROVED, NOT ACCEPTED
0
$0
15
$129,256
53
$151,402
5
$36,696
3
$180,173
APPLICATIONS DENIED
1
$84,790
16
$103,252
173
$139,529
17
$40,952
9
$89,203
APPLICATIONS WITHDRAWN
1
$81,480
11
$164,335
66
$135,200
1
$211,310
5
$104,394
FILES CLOSED FOR INCOMPLETENESS
3
$152,573
1
$267,610
17
$148,572
1
$56,300
1
$119,230
Aggregated Statistics For Year 2002 (Based on 2 partial tracts)
A) FHA, FSA/RHS & VA Home Purchase Loans
B) Conventional Home Purchase Loans
C) Refinancings
D) Home Improvement Loans
F) Non-occupant Loans on < 5 Family Dwellings (A B C & D)
Number
Average Value
Number
Average Value
Number
Average Value
Number
Average Value
Number
Average Value
LOANS ORIGINATED
11
$147,956
104
$141,938
525
$132,186
21
$42,330
54
$132,971
APPLICATIONS APPROVED, NOT ACCEPTED
2
$107,640
8
$147,052
42
$123,080
10
$29,146
7
$84,124
APPLICATIONS DENIED
1
$166,260
7
$92,926
100
$152,339
11
$31,975
6
$115,368
APPLICATIONS WITHDRAWN
1
$111,280
13
$129,831
39
$123,869
1
$49,680
2
$211,970
FILES CLOSED FOR INCOMPLETENESS
1
$106,650
2
$205,345
41
$156,132
0
$0
1
$180,840
Aggregated Statistics For Year 2001 (Based on 2 partial tracts)
A) FHA, FSA/RHS & VA Home Purchase Loans
B) Conventional Home Purchase Loans
C) Refinancings
D) Home Improvement Loans
F) Non-occupant Loans on < 5 Family Dwellings (A B C & D)
Number
Average Value
Number
Average Value
Number
Average Value
Number
Average Value
Number
Average Value
LOANS ORIGINATED
11
$136,635
97
$137,328
394
$131,140
36
$37,481
38
$146,024
APPLICATIONS APPROVED, NOT ACCEPTED
0
$0
11
$120,135
34
$127,843
7
$20,534
2
$87,105
APPLICATIONS DENIED
3
$138,220
18
$87,547
97
$126,942
13
$20,178
6
$149,260
APPLICATIONS WITHDRAWN
0
$0
7
$246,791
51
$124,661
4
$39,412
3
$148,600
FILES CLOSED FOR INCOMPLETENESS
0
$0
1
$182,160
15
$136,587
1
$6,620
1
$98,040
Aggregated Statistics For Year 2000 (Based on 2 partial tracts)
A) FHA, FSA/RHS & VA Home Purchase Loans
B) Conventional Home Purchase Loans
C) Refinancings
D) Home Improvement Loans
F) Non-occupant Loans on < 5 Family Dwellings (A B C & D)
Number
Average Value
Number
Average Value
Number
Average Value
Number
Average Value
Number
Average Value
LOANS ORIGINATED
12
$111,504
96
$127,726
104
$112,449
28
$33,830
18
$133,327
APPLICATIONS APPROVED, NOT ACCEPTED
1
$74,850
13
$113,067
19
$115,572
12
$16,726
1
$158,310
APPLICATIONS DENIED
1
$143,080
28
$88,856
56
$111,366
11
$16,319
3
$38,640
APPLICATIONS WITHDRAWN
2
$83,130
7
$91,790
34
$102,536
5
$48,752
1
$44,380
FILES CLOSED FOR INCOMPLETENESS
0
$0
5
$134,202
10
$133,076
0
$0
1
$317,950
Aggregated Statistics For Year 1999 (Based on 1 partial tract)
A) FHA, FSA/RHS & VA Home Purchase Loans
B) Conventional Home Purchase Loans
C) Refinancings
D) Home Improvement Loans
F) Non-occupant Loans on < 5 Family Dwellings (A B C & D)
Detailed PMIC statistics for the following Tracts:0603.00
2002 - 2018 National Fire Incident Reporting System (NFIRS) incidents
Based on the data from the years 2002 - 2018 the average number of fire incidents per year is 13. The highest number of fire incidents - 25 took place in 2004, and the least - 2 in 2002. The data has a growing trend.
When looking into fire subcategories, the most incidents belonged to: Outside Fires (46.8%), and Structure Fires (33.5%).
Fire incident types reported to NFIRS in Zip Code 49287


 Nearest zip codes: 49265, 49221, 48158, 49236, 49286, 49230.


 Based on the data from the years 2002 - 2018 the average number of fire incidents per year is 13. The highest number of fire incidents - 25 took place in 2004, and the least - 2 in 2002. The data has a growing trend.
 When looking into fire subcategories, the most incidents belonged to: Outside Fires (46.8%), and Structure Fires (33.5%).