Estimated zip code population in 2022: 978 Zip code population in 2010: 1,051 Zip code population in 2000: 1,003
Houses and condos: 492 Renter-occupied apartments: 48
% of renters here:
11%
State:
27%
March 2022 cost of living index in zip code 48735: 80.2 (low, U.S. average is 100)
Land area: 37.3 sq. mi. Water area: 0.2 sq. mi.
Population density: 26 people per square mile
(very low).
OSM Map
General Map
Google Map
MSN Map
OSM Map
General Map
Google Map
MSN Map
OSM Map
General Map
Google Map
MSN Map
OSM Map
General Map
Google Map
MSN Map
Please wait while loading the map...
Real estate property taxes paid for housing units in 2022:
This zip code:
1.1% ($1,546)
Michigan:
1.2% ($2,746)
Median real estate property taxes paid for housing units with mortgages in 2022: $1,385 (1.0%) Median real estate property taxes paid for housing units with no mortgage in 2022: $1,869 (1.4%)
Business Search- 14 Million verified businesses
Males: 524
(53.6%)
Females: 454
(46.4%)
For population 25 years and over in 48735:
High school or higher: 91.9%
Bachelor's degree or higher: 12.2%
Graduate or professional degree: 4.5%
Unemployed: 2.9%
Mean travel time to work (commute): 26.5 minutes
For population 15 years and over in 48735:
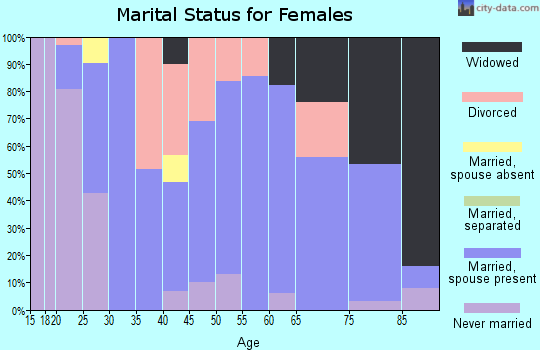
Never married: 33.1%
Now married: 53.0%
Separated: 0.9%
Widowed: 5.6%
Divorced: 7.3%
Zip code 48735 compared to state average:
Median house value below state average.
Black race population percentage significantly below state average.
Hispanic race population percentage significantly below state average.
Foreign-born population percentage significantly below state average.
Renting percentage significantly below state average.
Length of stay since moving in significantly above state average.
Number of college students significantly below state average.
Percentage of population with a bachelor's degree or higher significantly below state average.
Averages for the 2020 tax year for zip code 48735, filed in 2021:
Average Adjusted Gross Income (AGI) in 2020: $45,098 (Individual Income Tax Returns)
Here:
$45,098
State:
$68,945
Salary/wage: $41,441 (reported on 74.4% of returns)
Here:
$41,441
State:
$57,142
(% of AGI for various income ranges: 979.0% for AGIs below $25k, 3362.5% for AGIs $25k-50k, 7492.5% for AGIs $50k-75k, 5176.0% for AGIs $75k-100k)
Taxable interest for individuals: $445 (reported on 25.6% of returns)
This zip code:
$445
Michigan:
$1,630
(% of AGI for various income ranges: 16.0% for AGIs below $25k, 10.0% for AGIs $50k-75k, 58.0% for AGIs $75k-100k)
Ordinary dividends: $1,400 (reported on 11.6% of returns)
Here:
$1,400
State:
$6,972
(% of AGI for various income ranges: 14.0% for AGIs below $25k, 140.0% for AGIs $50k-75k)
Net capital gain/loss in AGI: +$2,833 (reported on 14.0% of returns)
Here:
+$2,833
State:
+$20,064
(% of AGI for various income ranges: 16.0% for AGIs below $25k, 308.0% for AGIs $75k-100k)
Profit/loss from business: +$3,480 (reported on 11.6% of returns)
Here:
+$3,480
State:
+$11,172
(% of AGI for various income ranges: 63.0% for AGIs below $25k, 138.8% for AGIs $25k-50k)
Taxable individual retirement arrangement distribution: $10,450 (reported on 9.3% of returns)
48735:
$10,450
Michigan:
$19,803
(% of AGI for various income ranges: 522.5% for AGIs $25k-50k)
Earned income credit: $1,738 (reported on 18.6% of returns)
Here:
$1,738
State:
$2,251
(% of AGI for various income ranges: 90.0% for AGIs below $25k, 61.3% for AGIs $25k-50k)
Percentage of individuals using paid preparers for their 2020 taxes: 95.3%
Here:
95%
State:
93%
(% for various income ranges: 93.8% for AGIs below $25k, 100.0% for AGIs $25k-50k, 100.0% for AGIs $50k-75k, 80.0% for AGIs $75k-100k, 100.0% for AGIs $100k-200k)
Averages for the 2012 tax year for zip code 48735, filed in 2013:
Average Adjusted Gross Income (AGI) in 2012: $38,649 (Individual Income Tax Returns)
Here:
$38,649
State:
$55,609
Salary/wage: $31,703 (reported on 83.7% of returns)
Here:
$31,703
State:
$46,782
(% of AGI for various income ranges: 71.6% for AGIs below $25k, 66.7% for AGIs $25k-50k, 76.5% for AGIs $50k-75k, 133.2% for AGIs $75k-100k)
Taxable interest for individuals: $850 (reported on 32.6% of returns)
This zip code:
$850
Michigan:
$1,491
(% of AGI for various income ranges: 0.7% for AGIs below $25k, 1.0% for AGIs $25k-50k, 0.8% for AGIs $50k-75k, 0.9% for AGIs $75k-100k)
Ordinary dividends: $1,880 (reported on 11.6% of returns)
Here:
$1,880
State:
$6,225
Profit/loss from business: +$3,800 (reported on 11.6% of returns)
Here:
+$3,800
State:
+$11,523
Taxable individual retirement arrangement distribution: $3,400 (reported on 9.3% of returns)
48735:
$3,400
Michigan:
$15,298
Total itemized deductions: $17,467 (26% of AGI, reported on 14.0% of returns)
Here:
$17,467
State:
$21,628
Here:
25.7% of AGI
State:
18.4% of AGI
Charity contributions: $2,825 (reported on 9.3% of returns)
Here:
$2,825
State:
$4,225
Taxes paid: $4,633 (reported on 14.0% of returns)
48735:
$4,633
State:
$8,327
Earned income credit: $1,980 (reported on 23.3% of returns)
Here:
$1,980
State:
$2,306
(% of AGI for various income ranges: 6.5% for AGIs below $25k, 1.2% for AGIs $25k-50k)
Percentage of individuals using paid preparers for their 2012 taxes: 69.8%
Here:
70%
State:
57%
(% for various income ranges: 63.2% for AGIs below $25k, 66.7% for AGIs $25k-50k, 85.7% for AGIs $50k-75k, 133.3% for AGIs $75k-100k)
Averages for the 2004 tax year for zip code 48735, filed in 2005:
Average Adjusted Gross Income (AGI) in 2004: $32,577 (Individual Income Tax Returns)
Here:
$32,577
State:
$48,204
Salary/wage: $30,362 (reported on 80.2% of returns)
Here:
$30,362
State:
$42,791
(% of AGI for various income ranges: 109.7% for AGIs below $10k, 66.1% for AGIs $10k-25k, 72.9% for AGIs $25k-50k, 78.0% for AGIs $50k-75k, 77.8% for AGIs $75k-100k, 72.0% for AGIs over 100k)
Taxable interest for individuals: $1,539 (reported on 45.9% of returns)
This zip code:
$1,539
Michigan:
$1,725
(% of AGI for various income ranges: 4.1% for AGIs below $10k, 3.4% for AGIs $10k-25k, 3.2% for AGIs $25k-50k, 1.6% for AGIs $50k-75k, 0.8% for AGIs $75k-100k, 0.3% for AGIs over 100k)
Taxable dividends: $956 (reported on 15.3% of returns)
Here:
$956
State:
$3,420
Net capital gain/loss: +$3,422 (reported on 10.1% of returns)
Here:
+$3,422
State:
+$8,532
Profit/loss from business: +$3,302 (reported on 11.9% of returns)
Here:
+$3,302
State:
+$9,547
Total itemized deductions: $12,840 (22% of AGI, reported on 18.2% of returns)
Here:
$12,840
State:
$18,509
Here:
21.9% of AGI
State:
20.7% of AGI
(% of AGI for various income ranges: 8.1% for AGIs $10k-25k, 6.5% for AGIs $25k-50k, 6.3% for AGIs $50k-75k, 7.0% for AGIs $75k-100k, 11.6% for AGIs over 100k)
Charity contributions deductions: $1,862 (3% of AGI, reported on 14.6% of returns)
Here:
$1,862
State:
$3,365
Here:
3.1% of AGI
State:
3.6% of AGI
(% of AGI for various income ranges: 0.3% for AGIs $10k-25k, 0.9% for AGIs $25k-50k, 1.1% for AGIs $50k-75k, 1.7% for AGIs over 100k)
Total tax: $3,585 (reported on 72.7% of returns)
48735:
$3,585
State:
$7,691
(% of AGI for various income ranges: 4.1% for AGIs below $10k, 4.6% for AGIs $10k-25k, 6.2% for AGIs $25k-50k, 8.2% for AGIs $50k-75k, 10.3% for AGIs $75k-100k, 14.7% for AGIs over 100k)
Earned income credit: $1,741 (reported on 13.1% of returns)
Here:
$1,741
State:
$1,737
Percentage of individuals using paid preparers for their 2004 taxes: 67.3%
Here:
67%
State:
60%
(% for various income ranges: 58.4% for AGIs below $10k, 70.4% for AGIs $10k-25k, 68.6% for AGIs $25k-50k, 73.8% for AGIs $50k-75k, 108.7% for AGIs $75k-100k)
Household received Food Stamps/SNAP in the past 12 months: 24 Household did not receive Food Stamps/SNAP in the past 12 months: 405
Women who had a birth in the past 12 months: 15 (3 now married, 10 unmarried) Women who did not have a birth in the past 12 months: 198 (92 now married, 105 unmarried)
Housing units in zip code 48735 with a mortgage: 210 (6 second mortgage, 6 both second mortgage and home equity loan) Median monthly owner costs for units with a mortgage: $1,048 Median monthly owner costs for units without a mortgage: $513
Residents with income below the poverty level in 2022:
This zip code:
12.6%
Whole state:
13.4%
Residents with income below 50% of the poverty level in 2022:
This zip code:
6.9%
Whole state:
6.9%
Median number of rooms in houses and condos:
Here:
6.3
State:
6.5
Median number of rooms in apartments:
Here:
4.9
State:
4.3
Notable locations in this zip code not listed on our city pages
Notable locations in zip code 48735: Rescue (A), Sherwood on the Hill Golf Course (B), Gagetown - Elmwood Township Fire Department (C), Gagetown Village Hall (D). Display/hide their locations on the map
Churches in zip code 48735 include: Gagetown United Methodist Church (A), Saint Agatha's Church (B), Church of the Nazarene (C). Display/hide their locations on the map
In group quarters: 9 (-1 institutionalized population)
Size of family households: 137 2-persons, 37 3-persons, 66 4-persons, 18 5-persons, 10 6-persons
Size of nonfamily households: 122 1-person, 40 2-persons
113 married couples with children.
37 single-parent households (15 men, 22 women).
99.2% of residents of 48735 zip code speak English at home.
0.5% of residents speak Spanish at home (100% very well).
0.1% of residents speak other Indo-European language at home (100% very well).
Foreign born population: 2 (0.3%) (0.0% of them are naturalized citizens)
:
0.3%
Whole state:
6.9%
67%France
50%German
12%Polish
10%Irish
7%English
6%American
4%Czech
2%French
Year of entry for the foreign-born population
02010 or later
02000 to 2009
21990 to 1999
0Before 1990
Facilities with environmental interests located in this zip code:
GAGETOWN WWSL (SECTION 11, T14N, R10E in GAGETOWN, MI)
National Pollutant Discharge Elimination System NON-MAJOR (Tracking pollutant discharge elimination systems) - permit Business SIC classification: SEWERAGE SYSTEMS
EVANS PRODUCTS (6581 MILL in GAGETOWN, MI)
(Resource Conservation and Recovery Act (tracking hazardous waste)) Alternative names: RCS/EVANS PRODUCTS SITE
GAGETOWN ANHYDROUS AMMONIA SITE (6680 N. GAGE ST. in GAGETOWN, MI)
COMPLIANCE ACTIVITY (Tracking inspections of insecticide, fungicide, and rodenticide, and toxic substances) Alternative names: COOPERATIVE ELE CO, COOPERATIVE ELEVATOR CO
Housing units lacking complete plumbing facilities: 0.3% Housing units lacking complete kitchen facilities: 0.3%
35.9%Utility gas
35.0%Bottled, tank, or LP gas
11.7%Wood
10.5%Fuel oil, kerosene, etc.
5.5%Electricity
1.4%Other fuel
1.0%No fuel used
Population in 1990: 759. Population change in the 1990s: +244 (+32.1%).
Place of birth for U.S.-born residents:
This state: 924
Northeast: 3
Midwest: 12
South: 25
West: 6
67% of the 48735 zip code residents lived in the same house 5 years ago. Out of people who lived in different houses, 53% lived in this county. Out of people who lived in different counties, 50% lived in Michigan.
94% of the 48735 zip code residents lived in the same house 1 year ago. Out of people who lived in different houses, 40% moved from this county. Out of people who lived in different houses, 38% moved from different county within same state. Out of people who lived in different houses, 25% moved from different state.
Private vs. public school enrollment:
Students in private schools in grades 1 to 8 (elementary and middle school): 5
Here:
7.0%
Michigan:
12.4%
Students in private schools in grades 9 to 12 (high school): 2
Here:
6.5%
Michigan:
9.8%
Students in private undergraduate colleges: 3
Here:
28.4%
Michigan:
14.9%
Occupation by median earnings in the past 12 months ($)
46,452Construction and extraction occupations
44,764Business and financial operations occupations
43,787Installation, maintenance, and repair occupations
42,769Production occupations
39,588Farming, fishing, and forestry occupations
39,505Office and administrative support occupations
Top industries in this zip code by the number of employees in 2005:
Administrative and Support and Waste Management and Remediation Services: Landscaping Services (5-9: 1)
Construction: Residential Remodelers (1-4: 1)
Health Care and Social Assistance: Home Health Care Services (1-4: 1)
Arts, Entertainment, and Recreation: Golf Courses and Country Clubs (1-4: 1)
Professional, Scientific, and Technical Services: Offices of Lawyers (1-4: 1)
Other Services (except Public Administration): Religious Organizations (1-4: 1)
Finance and Insurance: Commercial Banking (1-4: 1)
People in group quarters in 2010:
19 people in group homes intended for adults
People in group quarters in 2000:
12 people in homes for the mentally ill
6 people in other group homes
Fatal accident statistics in 2010:
Fatal accident count: 1
Vehicles involved in fatal accidents: 1
Fatal accidents caused by drunken drivers: 0
Fatalities: 1
Persons involved in fatal accidents: 1
Pedestrians involved in fatal accidents: 0
2002 - 2018 National Fire Incident Reporting System (NFIRS) incidents
Based on the data from the years 2002 - 2018 the average number of fire incidents per year is 8. The highest number of reported fires - 18 took place in 2002, and the least - 2 in 2015. The data has a decreasing trend.
When looking into fire subcategories, the most incidents belonged to: Structure Fires (52.2%), and Outside Fires (38.8%).
Fire incident types reported to NFIRS in Zip Code 48735


 Nearest zip codes: 48754, 48726, 48755, 48759, 48720, 48767.


 Based on the data from the years 2002 - 2018 the average number of fire incidents per year is 8. The highest number of reported fires - 18 took place in 2002, and the least - 2 in 2015. The data has a decreasing trend.
 When looking into fire subcategories, the most incidents belonged to: Structure Fires (52.2%), and Outside Fires (38.8%).