Estimated zip code population in 2022: 2,810 Zip code population in 2010: 3,503 Zip code population in 2000: 3,517
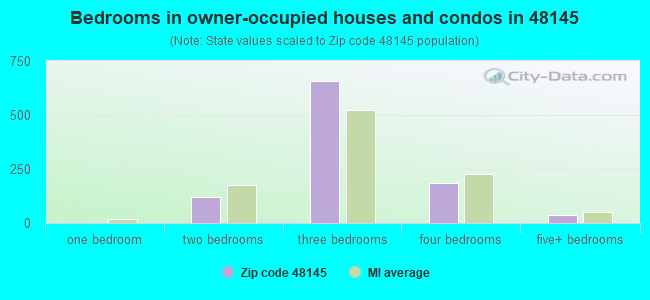
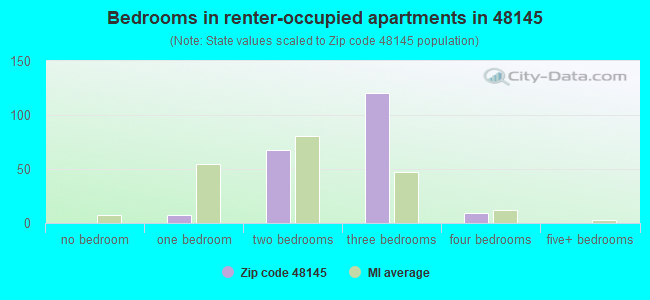
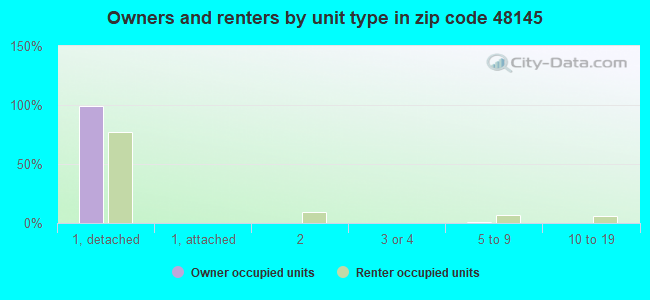
Houses and condos: 1,259 Renter-occupied apartments: 208
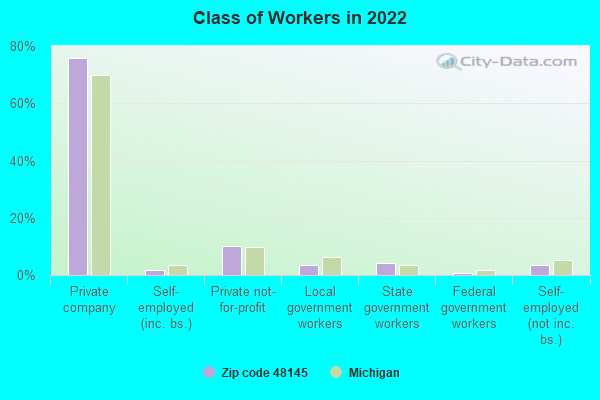
% of renters here:
17%
State:
27%
March 2022 cost of living index in zip code 48145: 91.5 (less than average, U.S. average is 100)
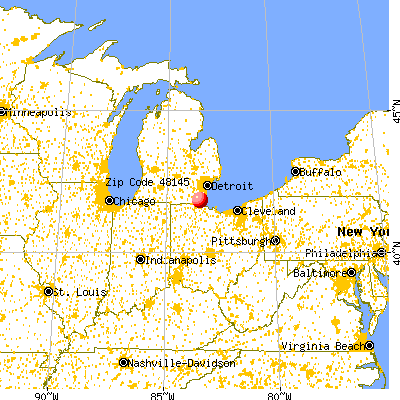
Land area: 16.8 sq. mi. Water area: 0.3 sq. mi.
Population density: 167 people per square mile
(very low).
OSM Map
General Map
Google Map
MSN Map
OSM Map
General Map
Google Map
MSN Map
OSM Map
General Map
Google Map
MSN Map
OSM Map
General Map
Google Map
MSN Map
Please wait while loading the map...
Real estate property taxes paid for housing units in 2022:
This zip code:
0.8% ($2,017)
Michigan:
1.2% ($2,746)
Median real estate property taxes paid for housing units with mortgages in 2022: $2,108 (0.9%) Median real estate property taxes paid for housing units with no mortgage in 2022: $1,910 (0.8%)
Business Search- 14 Million verified businesses
Males: 1,281
(45.6%)
Females: 1,529
(54.4%)
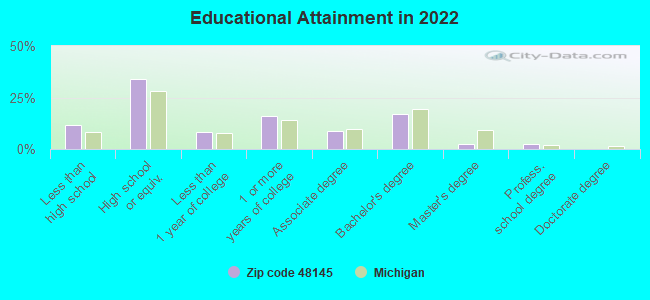
For population 25 years and over in 48145:
High school or higher: 87.4%
Bachelor's degree or higher: 21.5%
Graduate or professional degree: 4.9%
Unemployed: 2.6%
Mean travel time to work (commute): 29.2 minutes
For population 15 years and over in 48145:
Never married: 25.8%
Now married: 54.9%
Separated: 0.3%
Widowed: 12.2%
Divorced: 6.9%
Zip code 48145 compared to state average:
Unemployed percentage below state average.
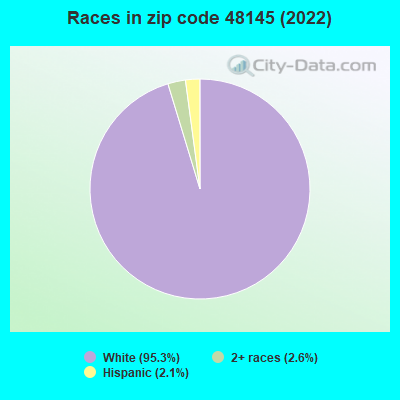
Black race population percentage significantly below state average.
Hispanic race population percentage below state average.
Median age above state average.
Foreign-born population percentage significantly below state average.
Renting percentage below state average.
Length of stay since moving in significantly above state average.
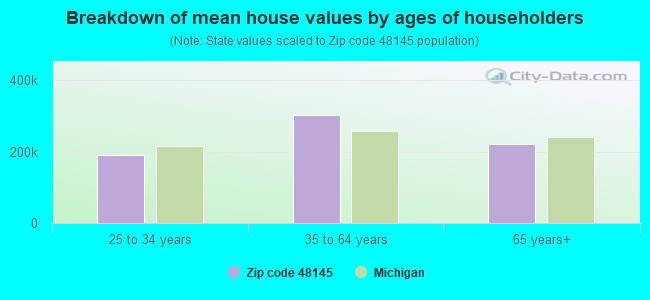
Estimated median house/condo value in 2022: $241,696
48145:
$241,696
Michigan:
$224,400
According to our research of Michigan and other state lists, there were 6 registered sex offenders living in 48145 zip code as of July 18, 2024. The ratio of all residents to sex offenders in zip code 48145 is 572 to 1. The ratio of registered sex offenders to all residents in this zip code is lower than the state average.
Median resident age:
This zip code:
48.1 years
Michigan median age:
40.3 years
Average household size:
This zip code:
2.3 people
Michigan:
2.4 people
Averages for the 2020 tax year for zip code 48145, filed in 2021:
Average Adjusted Gross Income (AGI) in 2020: $70,235 (Individual Income Tax Returns)
Here:
$70,235
State:
$68,945
Salary/wage: $63,482 (reported on 75.7% of returns)
Here:
$63,482
State:
$57,142
(% of AGI for various income ranges: 938.8% for AGIs below $25k, 2780.3% for AGIs $25k-50k, 6122.6% for AGIs $50k-75k, 8491.2% for AGIs $75k-100k, 17497.4% for AGIs $100k-200k, 55963.3% for AGIs over 200k)
Taxable interest for individuals: $1,052 (reported on 35.4% of returns)
This zip code:
$1,052
Michigan:
$1,630
(% of AGI for various income ranges: 17.6% for AGIs below $25k, 19.4% for AGIs $25k-50k, 36.8% for AGIs $50k-75k, 27.5% for AGIs $75k-100k, 95.8% for AGIs $100k-200k, 863.3% for AGIs over 200k)
Ordinary dividends: $4,076 (reported on 20.4% of returns)
Here:
$4,076
State:
$6,972
(% of AGI for various income ranges: 20.0% for AGIs below $25k, 42.6% for AGIs $25k-50k, 103.2% for AGIs $50k-75k, 68.1% for AGIs $75k-100k, 228.9% for AGIs $100k-200k, 1900.0% for AGIs over 200k)
Net capital gain/loss in AGI: +$6,800 (reported on 18.2% of returns)
Here:
+$6,800
State:
+$20,064
(% of AGI for various income ranges: 20.6% for AGIs below $25k, 3.2% for AGIs $25k-50k, 52.6% for AGIs $50k-75k, 94.4% for AGIs $75k-100k, 422.6% for AGIs $100k-200k, 3706.7% for AGIs over 200k)
Profit/loss from business: +$7,524 (reported on 11.6% of returns)
Here:
+$7,524
State:
+$11,172
(% of AGI for various income ranges: 106.7% for AGIs below $25k, 108.4% for AGIs $25k-50k, 136.8% for AGIs $50k-75k, 263.1% for AGIs $75k-100k, 111.1% for AGIs $100k-200k)
Taxable individual retirement arrangement distribution: $19,767 (reported on 13.3% of returns)
48145:
$19,767
Michigan:
$19,803
(% of AGI for various income ranges: 86.1% for AGIs below $25k, 141.3% for AGIs $25k-50k, 331.1% for AGIs $50k-75k, 243.8% for AGIs $75k-100k, 1580.5% for AGIs $100k-200k)
Total itemized deductions: $29,270 (reported on 5.5% of returns)
Here:
$29,270
State:
$34,117
(% of AGI for various income ranges: 533.2% for AGIs $50k-75k, 458.9% for AGIs $100k-200k, 3473.3% for AGIs over 200k)
Charity contributions: $6,429 (reported on 3.9% of returns)
Here:
$6,429
State:
$13,548
(% of AGI for various income ranges: 44.7% for AGIs $50k-75k, 67.4% for AGIs $100k-200k, 790.0% for AGIs over 200k)
Taxes paid: $6,991 (reported on 6.1% of returns)
48145:
$6,991
State:
$7,972
(% of AGI for various income ranges: 143.7% for AGIs $50k-75k, 127.9% for AGIs $100k-200k, 843.3% for AGIs over 200k)
Earned income credit: $2,027 (reported on 8.3% of returns)
Here:
$2,027
State:
$2,251
(% of AGI for various income ranges: 54.2% for AGIs below $25k, 40.3% for AGIs $25k-50k)
Percentage of individuals using paid preparers for their 2020 taxes: 94.5%
Here:
94%
State:
93%
(% for various income ranges: 94.0% for AGIs below $25k, 95.1% for AGIs $25k-50k, 96.4% for AGIs $50k-75k, 95.2% for AGIs $75k-100k, 93.9% for AGIs $100k-200k, 87.5% for AGIs over 200k)
Averages for the 2012 tax year for zip code 48145, filed in 2013:
Average Adjusted Gross Income (AGI) in 2012: $59,506 (Individual Income Tax Returns)
Here:
$59,506
State:
$55,609
Salary/wage: $50,388 (reported on 84.5% of returns)
Here:
$50,388
State:
$46,782
(% of AGI for various income ranges: 62.6% for AGIs below $25k, 62.1% for AGIs $25k-50k, 69.7% for AGIs $50k-75k, 76.8% for AGIs $75k-100k, 87.4% for AGIs $100k-200k, 42.5% for AGIs over 200k)
Taxable interest for individuals: $898 (reported on 36.8% of returns)
This zip code:
$898
Michigan:
$1,491
(% of AGI for various income ranges: 1.2% for AGIs below $25k, 0.8% for AGIs $25k-50k, 0.4% for AGIs $50k-75k, 0.3% for AGIs $75k-100k, 0.4% for AGIs $100k-200k, 0.9% for AGIs over 200k)
Ordinary dividends: $4,697 (reported on 19.5% of returns)
Here:
$4,697
State:
$6,225
(% of AGI for various income ranges: 1.2% for AGIs below $25k, 1.0% for AGIs $25k-50k, 0.7% for AGIs $50k-75k, 1.5% for AGIs $75k-100k, 0.8% for AGIs $100k-200k, 5.1% for AGIs over 200k)
Net capital gain/loss in AGI: +$6,386 (reported on 12.6% of returns)
Here:
+$6,386
State:
+$9,326
(% of AGI for various income ranges: 4.7% for AGIs $100k-200k)
Profit/loss from business: +$10,536 (reported on 12.6% of returns)
Here:
+$10,536
State:
+$11,523
(% of AGI for various income ranges: 7.6% for AGIs below $25k, 4.5% for AGIs $25k-50k, 1.4% for AGIs $50k-75k, 1.1% for AGIs $75k-100k, 2.2% for AGIs $100k-200k)
Taxable individual retirement arrangement distribution: $12,305 (reported on 11.5% of returns)
48145:
$12,305
Michigan:
$15,298
(% of AGI for various income ranges: 3.7% for AGIs below $25k, 2.4% for AGIs $25k-50k, 3.6% for AGIs $50k-75k, 2.8% for AGIs $75k-100k, 2.2% for AGIs $100k-200k)
Total itemized deductions: $19,240 (18% of AGI, reported on 32.8% of returns)
Here:
$19,240
State:
$21,628
Here:
18.0% of AGI
State:
18.4% of AGI
(% of AGI for various income ranges: 3.4% for AGIs below $25k, 8.1% for AGIs $25k-50k, 10.7% for AGIs $50k-75k, 10.8% for AGIs $75k-100k, 12.4% for AGIs $100k-200k, 12.3% for AGIs over 200k)
Charity contributions: $2,864 (reported on 27.0% of returns)
Here:
$2,864
State:
$4,225
(% of AGI for various income ranges: 0.9% for AGIs $25k-50k, 1.4% for AGIs $50k-75k, 1.3% for AGIs $75k-100k, 1.6% for AGIs $100k-200k, 1.5% for AGIs over 200k)
Taxes paid: $7,342 (reported on 32.8% of returns)
48145:
$7,342
State:
$8,327
(% of AGI for various income ranges: 2.4% for AGIs $25k-50k, 3.4% for AGIs $50k-75k, 3.8% for AGIs $75k-100k, 5.1% for AGIs $100k-200k, 6.6% for AGIs over 200k)
Earned income credit: $2,055 (reported on 11.5% of returns)
Here:
$2,055
State:
$2,306
(% of AGI for various income ranges: 4.4% for AGIs below $25k, 0.7% for AGIs $25k-50k)
Percentage of individuals using paid preparers for their 2012 taxes: 62.6%
Here:
63%
State:
57%
(% for various income ranges: 58.3% for AGIs below $25k, 61.1% for AGIs $25k-50k, 65.4% for AGIs $50k-75k, 68.0% for AGIs $75k-100k, 62.5% for AGIs $100k-200k, 100.0% for AGIs over 200k)
Averages for the 2004 tax year for zip code 48145, filed in 2005:
Average Adjusted Gross Income (AGI) in 2004: $54,446 (Individual Income Tax Returns)
Here:
$54,446
State:
$48,204
Salary/wage: $46,693 (reported on 87.9% of returns)
Here:
$46,693
State:
$42,791
(% of AGI for various income ranges: 99.5% for AGIs below $10k, 67.9% for AGIs $10k-25k, 73.0% for AGIs $25k-50k, 82.9% for AGIs $50k-75k, 84.7% for AGIs $75k-100k, 67.7% for AGIs over 100k)
Taxable interest for individuals: $1,424 (reported on 52.0% of returns)
This zip code:
$1,424
Michigan:
$1,725
(% of AGI for various income ranges: 5.5% for AGIs below $10k, 2.1% for AGIs $10k-25k, 1.7% for AGIs $25k-50k, 1.2% for AGIs $50k-75k, 0.8% for AGIs $75k-100k, 1.4% for AGIs over 100k)
Taxable dividends: $1,947 (reported on 24.3% of returns)
Here:
$1,947
State:
$3,420
(% of AGI for various income ranges: 1.1% for AGIs below $10k, 0.9% for AGIs $10k-25k, 0.8% for AGIs $25k-50k, 0.8% for AGIs $50k-75k, 0.8% for AGIs $75k-100k, 0.9% for AGIs over 100k)
Net capital gain/loss: +$8,264 (reported on 15.8% of returns)
Here:
+$8,264
State:
+$8,532
(% of AGI for various income ranges: -1.1% for AGIs below $10k, -0.3% for AGIs $10k-25k, 0.6% for AGIs $25k-50k, 0.0% for AGIs $50k-75k, 2.4% for AGIs $75k-100k, 4.9% for AGIs over 100k)
Profit/loss from business: +$6,707 (reported on 12.5% of returns)
Here:
+$6,707
State:
+$9,547
(% of AGI for various income ranges: -5.3% for AGIs below $10k, 3.8% for AGIs $10k-25k, 3.4% for AGIs $25k-50k, 1.5% for AGIs $50k-75k, 0.3% for AGIs $75k-100k, 1.4% for AGIs over 100k)
IRA payment deduction: $3,167 (reported on 1.7% of returns)
48145:
$3,167
Michigan:
$2,875
Total itemized deductions: $18,501 (20% of AGI, reported on 39.3% of returns)
Here:
$18,501
State:
$18,509
Here:
20.1% of AGI
State:
20.7% of AGI
(% of AGI for various income ranges: 10.4% for AGIs $10k-25k, 12.2% for AGIs $25k-50k, 12.4% for AGIs $50k-75k, 14.1% for AGIs $75k-100k, 14.8% for AGIs over 100k)
Charity contributions deductions: $2,653 (3% of AGI, reported on 35.3% of returns)
Here:
$2,653
State:
$3,365
Here:
2.8% of AGI
State:
3.6% of AGI
(% of AGI for various income ranges: 0.8% for AGIs $10k-25k, 1.3% for AGIs $25k-50k, 1.4% for AGIs $50k-75k, 1.9% for AGIs $75k-100k, 2.2% for AGIs over 100k)
Total tax: $8,002 (reported on 81.4% of returns)
48145:
$8,002
State:
$7,691
(% of AGI for various income ranges: 3.0% for AGIs below $10k, 4.3% for AGIs $10k-25k, 7.2% for AGIs $25k-50k, 9.3% for AGIs $50k-75k, 10.5% for AGIs $75k-100k, 17.3% for AGIs over 100k)
Earned income credit: $1,559 (reported on 7.9% of returns)
Here:
$1,559
State:
$1,737
Percentage of individuals using paid preparers for their 2004 taxes: 59.7%
Here:
60%
State:
60%
(% for various income ranges: 44.8% for AGIs below $10k, 55.4% for AGIs $10k-25k, 64.3% for AGIs $25k-50k, 63.0% for AGIs $50k-75k, 67.6% for AGIs $75k-100k, 67.3% for AGIs over 100k)
Household received Food Stamps/SNAP in the past 12 months: 38 Household did not receive Food Stamps/SNAP in the past 12 months: 1,157
Women who had a birth in the past 12 months: 29 (18 now married, 10 unmarried) Women who did not have a birth in the past 12 months: 488 (209 now married, 278 unmarried)
Housing units in zip code 48145 with a mortgage: 548 (106 second mortgage, 94 both second mortgage and home equity loan) Houses without a mortgage: 11
Median monthly owner costs for units with a mortgage: $1,435 Median monthly owner costs for units without a mortgage: $512
Residents with income below the poverty level in 2022:
This zip code:
10.8%
Whole state:
13.4%
Residents with income below 50% of the poverty level in 2022:
This zip code:
4.5%
Whole state:
6.9%
Median number of rooms in houses and condos:
Here:
6.9
State:
6.5
Median number of rooms in apartments:
Here:
6.5
State:
4.3
Notable locations in this zip code not listed on our city pages
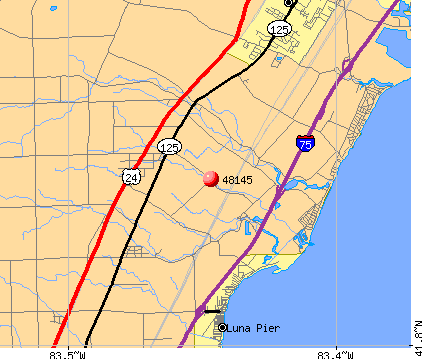
Notable locations in zip code 48145: La Salle (A), Toledo Beach (B), Cousino (C), La Salle Township Hall (D), La Salle Volunteer Fire Department (E). Display/hide their locations on the map
Churches in zip code 48145 include: La Salle Presbyterian Church (A), Monroe Missionary Baptist Church (B), Zion United Church (C). Display/hide their locations on the map
Size of family households: 322 2-persons, 197 3-persons, 173 4-persons, 36 5-persons, 17 6-persons, 8 7-or-more-persons
Size of nonfamily households: 417 1-person, 22 2-persons, 7 3-persons
403 married couples with children.
99 single-parent households (9 men, 90 women).
99.3% of residents of 48145 zip code speak English at home.
0.2% of residents speak Spanish at home (100% very well).
0.2% of residents speak other Indo-European language at home (40% very well, 60% not well).
0.3% of residents speak Asian or Pacific Island language at home (100% very well).
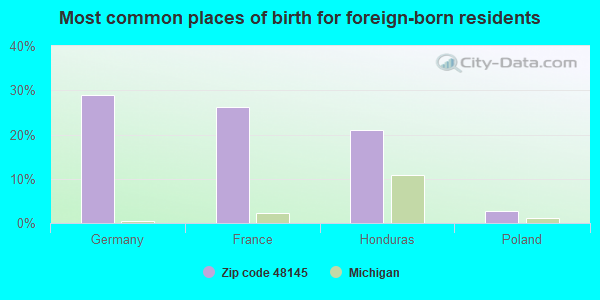
Foreign born population: 37 (1.4%) (53.9% of them are naturalized citizens)
This zip code:
1.4%
Whole state:
6.9%
29%Germany
26%France
21%Honduras
3%Poland
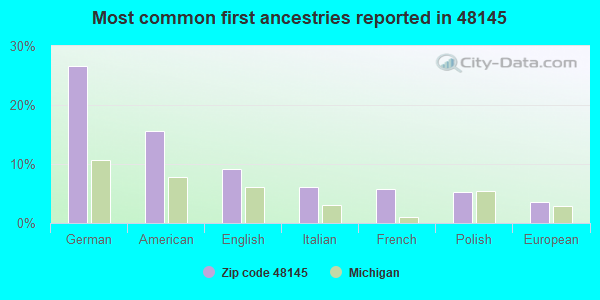
27%German
16%American
9%English
6%Italian
6%French
5%Polish
4%European
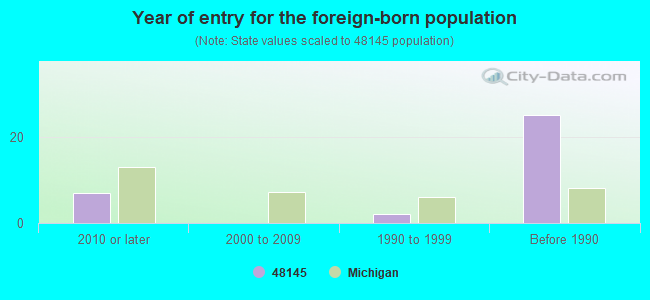
Year of entry for the foreign-born population
72010 or later
02000 to 2009
21990 to 1999
25Before 1990
Facilities with environmental interests located in this zip code:
MI DEPT/TRANSPORTATION BRIDGE B03-58151 (I75 NB/SB OVER MUDDY CREEK in LA SALLE, MI)
Conditionally Exempt Small Quantity Generators, less than 100 kg/month of hazardous waste (Resource Conservation and Recovery Act (tracking hazardous waste)) Organizations: MICH DEPT OF TRANSPORTATION (CONTACT/OPERATOR)
MI DEPT/TRANSPORTATION BRIDGE B04-58151 (I75 NB/SB OVER OTTER CREEK in LA SALLE, MI)
Conditionally Exempt Small Quantity Generators, less than 100 kg/month of hazardous waste (Resource Conservation and Recovery Act (tracking hazardous waste)) Organizations: MICH DEPT OF TRANSPORTATION (CONTACT/OPERATOR)
Housing units lacking complete plumbing facilities: 1.0% Housing units lacking complete kitchen facilities: 0.5%
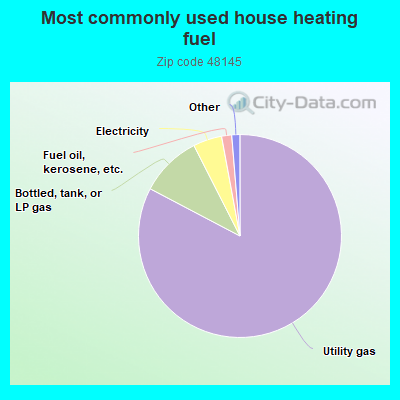
82.8%Utility gas
9.8%Bottled, tank, or LP gas
4.6%Electricity
1.6%Fuel oil, kerosene, etc.
0.7%Wood
0.7%No fuel used
Population in 1990: 3,800.
Place of birth for U.S.-born residents:
This state: 2,015
Northeast: 27
Midwest: 380
South: 306
West: 42
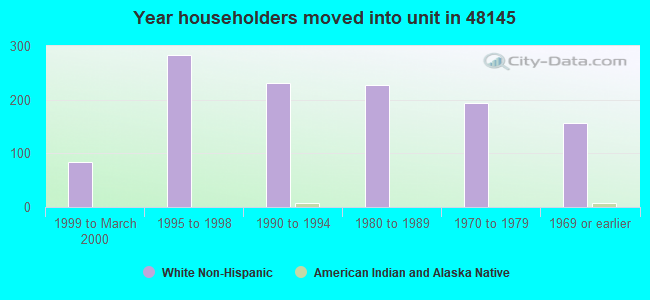
75% of the 48145 zip code residents lived in the same house 5 years ago. Out of people who lived in different houses, 66% lived in this county. Out of people who lived in different counties, 50% lived in Michigan.
94% of the 48145 zip code residents lived in the same house 1 year ago. Out of people who lived in different houses, 77% moved from this county. Out of people who lived in different houses, 18% moved from different county within same state. Out of people who lived in different houses, 3% moved from different state.
Private vs. public school enrollment:
Students in private schools in grades 1 to 8 (elementary and middle school): 40
Here:
13.6%
Michigan:
12.4%
Students in private schools in grades 9 to 12 (high school): 13
Here:
12.5%
Michigan:
9.8%
Students in private undergraduate colleges: 11
Here:
9.7%
Michigan:
14.9%
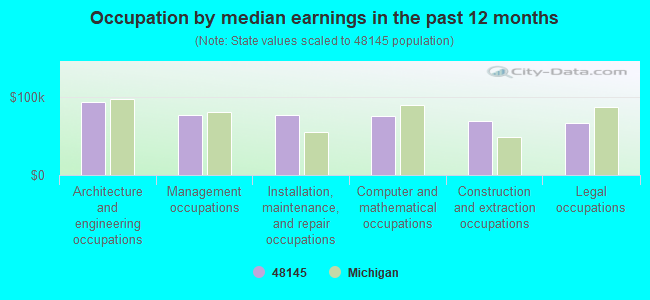
Occupation by median earnings in the past 12 months ($)
92,427Architecture and engineering occupations
77,052Management occupations
76,060Installation, maintenance, and repair occupations
75,302Computer and mathematical occupations
68,401Construction and extraction occupations
65,775Legal occupations
Top industries in this zip code by the number of employees in 2005:
Health Care and Social Assistance: Ambulance Services (100-249 employees: 1 establishment)
Construction: All Other Specialty Trade Contractors (10-19: 1, 5-9: 1)
Other Services (except Public Administration): Automotive Body, Paint, and Interior Repair and Maintenance (10-19: 1)
Real Estate and Rental and Leasing: Lessors of Nonresidential Buildings (except Miniwarehouses) (10-19: 1)
Arts, Entertainment, and Recreation: Marinas (5-9: 1, 1-4: 1)
Construction: Site Preparation Contractors (5-9: 1, 1-4: 1)
Construction: Framing Contractors (5-9: 1)
Other Services (except Public Administration): Cemeteries and Crematories (5-9: 1)
Fatal accident statistics in 2014:
Fatal accident count: 1
Vehicles involved in fatal accidents: 2
Fatal accidents caused by drunken drivers: 0
Fatalities: 1
Persons involved in fatal accidents: 2
Pedestrians involved in fatal accidents: 0
Fatal accident statistics in 2013:
Fatal accident count: 2
Vehicles involved in fatal accidents: 3
Fatal accidents caused by drunken drivers: 0
Fatalities: 2
Persons involved in fatal accidents: 7
Pedestrians involved in fatal accidents: 1
Home Mortgage Disclosure Act Aggregated Statistics For Year 2009 (Based on 4 partial tracts)
A) FHA, FSA/RHS & VA Home Purchase Loans
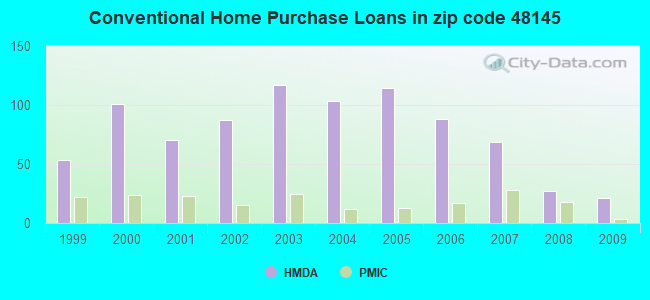
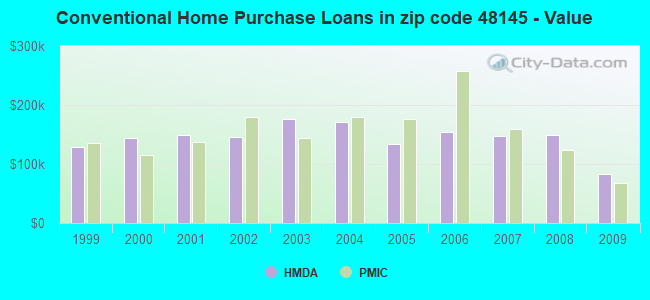
B) Conventional Home Purchase Loans
C) Refinancings
D) Home Improvement Loans
E) Loans on Dwellings For 5+ Families
F) Non-occupant Loans on < 5 Family Dwellings (A B C & D)
G) Loans On Manufactured Home Dwelling (A B C & D)
Number
Average Value
Number
Average Value
Number
Average Value
Number
Average Value
Number
Average Value
Number
Average Value
Number
Average Value
LOANS ORIGINATED
20
$112,567
21
$83,193
97
$141,746
7
$134,446
2
$115,420
8
$101,131
0
$0
APPLICATIONS APPROVED, NOT ACCEPTED
0
$0
3
$293,470
9
$160,416
5
$13,290
0
$0
0
$0
0
$0
APPLICATIONS DENIED
9
$116,003
8
$162,154
52
$138,442
10
$61,641
0
$0
0
$0
1
$52,270
APPLICATIONS WITHDRAWN
2
$101,580
3
$43,340
17
$151,170
3
$23,770
0
$0
2
$55,960
0
$0
FILES CLOSED FOR INCOMPLETENESS
0
$0
0
$0
9
$141,052
1
$100,320
0
$0
0
$0
0
$0
Aggregated Statistics For Year 2008 (Based on 4 partial tracts)
A) FHA, FSA/RHS & VA Home Purchase Loans
B) Conventional Home Purchase Loans
C) Refinancings
D) Home Improvement Loans
F) Non-occupant Loans on < 5 Family Dwellings (A B C & D)
G) Loans On Manufactured Home Dwelling (A B C & D)
Number
Average Value
Number
Average Value
Number
Average Value
Number
Average Value
Number
Average Value
Number
Average Value
LOANS ORIGINATED
17
$124,831
27
$149,319
70
$155,733
25
$20,335
4
$204,920
0
$0
APPLICATIONS APPROVED, NOT ACCEPTED
0
$0
2
$147,945
13
$196,064
2
$100,740
2
$65,580
0
$0
APPLICATIONS DENIED
4
$110,198
13
$101,272
58
$147,768
16
$36,639
5
$97,062
2
$20,985
APPLICATIONS WITHDRAWN
3
$196,207
3
$92,103
14
$172,706
0
$0
0
$0
0
$0
FILES CLOSED FOR INCOMPLETENESS
0
$0
0
$0
3
$197,773
0
$0
0
$0
0
$0
Aggregated Statistics For Year 2007 (Based on 4 partial tracts)
A) FHA, FSA/RHS & VA Home Purchase Loans
B) Conventional Home Purchase Loans
C) Refinancings
D) Home Improvement Loans
F) Non-occupant Loans on < 5 Family Dwellings (A B C & D)
G) Loans On Manufactured Home Dwelling (A B C & D)
Number
Average Value
Number
Average Value
Number
Average Value
Number
Average Value
Number
Average Value
Number
Average Value
LOANS ORIGINATED
5
$120,908
69
$147,600
115
$127,940
24
$56,812
4
$98,398
3
$146,743
APPLICATIONS APPROVED, NOT ACCEPTED
0
$0
19
$130,024
23
$137,996
9
$61,446
3
$99,377
0
$0
APPLICATIONS DENIED
1
$94,420
21
$109,293
97
$146,042
21
$54,244
1
$42,150
10
$42,521
APPLICATIONS WITHDRAWN
0
$0
2
$180,825
48
$147,387
4
$139,458
0
$0
1
$118,020
FILES CLOSED FOR INCOMPLETENESS
0
$0
0
$0
17
$154,433
0
$0
0
$0
0
$0
Aggregated Statistics For Year 2006 (Based on 4 partial tracts)
A) FHA, FSA/RHS & VA Home Purchase Loans
B) Conventional Home Purchase Loans
C) Refinancings
D) Home Improvement Loans
F) Non-occupant Loans on < 5 Family Dwellings (A B C & D)
G) Loans On Manufactured Home Dwelling (A B C & D)
Number
Average Value
Number
Average Value
Number
Average Value
Number
Average Value
Number
Average Value
Number
Average Value
LOANS ORIGINATED
3
$127,857
88
$154,076
116
$134,296
26
$53,032
13
$232,725
4
$83,300
APPLICATIONS APPROVED, NOT ACCEPTED
1
$66,600
12
$130,956
24
$109,623
4
$24,585
0
$0
5
$25,882
APPLICATIONS DENIED
0
$0
15
$117,022
120
$143,711
21
$53,421
6
$183,445
5
$44,144
APPLICATIONS WITHDRAWN
0
$0
10
$118,631
59
$176,873
10
$77,831
3
$118,337
0
$0
FILES CLOSED FOR INCOMPLETENESS
0
$0
3
$57,247
35
$154,950
0
$0
1
$114,650
0
$0
Aggregated Statistics For Year 2005 (Based on 4 partial tracts)
A) FHA, FSA/RHS & VA Home Purchase Loans
B) Conventional Home Purchase Loans
C) Refinancings
D) Home Improvement Loans
F) Non-occupant Loans on < 5 Family Dwellings (A B C & D)
G) Loans On Manufactured Home Dwelling (A B C & D)
Number
Average Value
Number
Average Value
Number
Average Value
Number
Average Value
Number
Average Value
Number
Average Value
LOANS ORIGINATED
8
$140,174
114
$133,056
194
$143,470
33
$56,296
8
$173,426
1
$27,820
APPLICATIONS APPROVED, NOT ACCEPTED
0
$0
16
$99,530
34
$144,286
14
$63,913
3
$195,867
7
$49,861
APPLICATIONS DENIED
1
$147,530
38
$115,398
147
$151,297
17
$80,316
3
$202,653
10
$68,801
APPLICATIONS WITHDRAWN
0
$0
22
$85,536
78
$140,150
14
$177,266
5
$112,622
2
$131,160
FILES CLOSED FOR INCOMPLETENESS
0
$0
3
$72,497
62
$155,975
2
$103,180
0
$0
0
$0
Aggregated Statistics For Year 2004 (Based on 4 partial tracts)
A) FHA, FSA/RHS & VA Home Purchase Loans
B) Conventional Home Purchase Loans
C) Refinancings
D) Home Improvement Loans
F) Non-occupant Loans on < 5 Family Dwellings (A B C & D)
G) Loans On Manufactured Home Dwelling (A B C & D)
Number
Average Value
Number
Average Value
Number
Average Value
Number
Average Value
Number
Average Value
Number
Average Value
LOANS ORIGINATED
2
$133,785
103
$170,367
193
$147,917
22
$82,196
14
$222,223
8
$125,054
APPLICATIONS APPROVED, NOT ACCEPTED
0
$0
11
$118,767
47
$190,792
4
$49,138
3
$124,163
3
$85,597
APPLICATIONS DENIED
1
$137,410
24
$100,415
96
$141,135
11
$32,381
3
$200,530
10
$33,882
APPLICATIONS WITHDRAWN
0
$0
10
$114,277
69
$147,105
8
$78,868
3
$141,070
2
$96,185
FILES CLOSED FOR INCOMPLETENESS
1
$144,150
3
$93,000
49
$185,346
2
$13,115
0
$0
0
$0
Aggregated Statistics For Year 2003 (Based on 4 partial tracts)
A) FHA, FSA/RHS & VA Home Purchase Loans
B) Conventional Home Purchase Loans
C) Refinancings
D) Home Improvement Loans
F) Non-occupant Loans on < 5 Family Dwellings (A B C & D)
Number
Average Value
Number
Average Value
Number
Average Value
Number
Average Value
Number
Average Value
LOANS ORIGINATED
10
$141,356
117
$177,029
499
$134,846
22
$24,682
16
$117,741
APPLICATIONS APPROVED, NOT ACCEPTED
0
$0
7
$189,077
43
$138,393
2
$13,990
3
$254,160
APPLICATIONS DENIED
1
$150,050
21
$67,181
118
$147,299
17
$15,131
3
$111,340
APPLICATIONS WITHDRAWN
3
$144,490
28
$154,356
71
$143,390
0
$0
2
$59,460
FILES CLOSED FOR INCOMPLETENESS
2
$117,170
1
$96,100
23
$169,283
0
$0
0
$0
Aggregated Statistics For Year 2002 (Based on 4 partial tracts)
A) FHA, FSA/RHS & VA Home Purchase Loans
B) Conventional Home Purchase Loans
C) Refinancings
D) Home Improvement Loans
F) Non-occupant Loans on < 5 Family Dwellings (A B C & D)
Number
Average Value
Number
Average Value
Number
Average Value
Number
Average Value
Number
Average Value
LOANS ORIGINATED
12
$127,709
87
$145,728
409
$129,154
32
$21,934
13
$121,399
APPLICATIONS APPROVED, NOT ACCEPTED
2
$116,295
11
$179,112
46
$125,674
13
$29,422
3
$219,767
APPLICATIONS DENIED
0
$0
17
$100,034
72
$126,223
11
$16,857
2
$81,350
APPLICATIONS WITHDRAWN
3
$104,677
9
$115,050
61
$131,801
2
$25,290
3
$109,453
FILES CLOSED FOR INCOMPLETENESS
0
$0
3
$48,280
18
$131,045
0
$0
0
$0
Aggregated Statistics For Year 2001 (Based on 4 partial tracts)
A) FHA, FSA/RHS & VA Home Purchase Loans
B) Conventional Home Purchase Loans
C) Refinancings
D) Home Improvement Loans
F) Non-occupant Loans on < 5 Family Dwellings (A B C & D)
Number
Average Value
Number
Average Value
Number
Average Value
Number
Average Value
Number
Average Value
LOANS ORIGINATED
0
$0
70
$149,787
344
$124,279
56
$22,733
12
$126,098
APPLICATIONS APPROVED, NOT ACCEPTED
0
$0
6
$120,147
59
$140,955
7
$23,973
0
$0
APPLICATIONS DENIED
0
$0
26
$101,596
96
$145,179
29
$21,399
5
$123,466
APPLICATIONS WITHDRAWN
2
$70,825
7
$184,179
51
$138,423
11
$14,822
3
$136,407
FILES CLOSED FOR INCOMPLETENESS
0
$0
2
$231,405
15
$107,189
0
$0
0
$0
Aggregated Statistics For Year 2000 (Based on 4 partial tracts)
A) FHA, FSA/RHS & VA Home Purchase Loans
B) Conventional Home Purchase Loans
C) Refinancings
D) Home Improvement Loans
F) Non-occupant Loans on < 5 Family Dwellings (A B C & D)
Number
Average Value
Number
Average Value
Number
Average Value
Number
Average Value
Number
Average Value
LOANS ORIGINATED
3
$126,203
101
$143,975
112
$98,653
57
$19,866
10
$118,427
APPLICATIONS APPROVED, NOT ACCEPTED
0
$0
10
$48,643
16
$70,192
29
$14,953
0
$0
APPLICATIONS DENIED
0
$0
23
$52,866
40
$90,710
33
$18,042
0
$0
APPLICATIONS WITHDRAWN
6
$101,208
7
$47,761
40
$77,452
10
$60,383
0
$0
FILES CLOSED FOR INCOMPLETENESS
0
$0
0
$0
3
$202,937
0
$0
0
$0
Aggregated Statistics For Year 1999 (Based on 2 partial tracts)
A) FHA, FSA/RHS & VA Home Purchase Loans
B) Conventional Home Purchase Loans
C) Refinancings
D) Home Improvement Loans
E) Loans on Dwellings For 5+ Families
F) Non-occupant Loans on < 5 Family Dwellings (A B C & D)
Detailed PMIC statistics for the following Tracts:8326.00
, 8327.00
2002 - 2018 National Fire Incident Reporting System (NFIRS) incidents
Based on the data from the years 2002 - 2018 the average number of fires per year is 21. The highest number of reported fire incidents - 33 took place in 2010, and the least - 15 in 2017. The data has a rising trend.
When looking into fire subcategories, the most incidents belonged to: Structure Fires (53.3%), and Outside Fires (23.4%).
Fire incident types reported to NFIRS in Zip Code 48145


 Nearest zip codes: 48157, 48161, 48133, 48162, 48140, 48177.


 Based on the data from the years 2002 - 2018 the average number of fires per year is 21. The highest number of reported fire incidents - 33 took place in 2010, and the least - 15 in 2017. The data has a rising trend.
 When looking into fire subcategories, the most incidents belonged to: Structure Fires (53.3%), and Outside Fires (23.4%).