Estimated zip code population in 2022: 3,179 Zip code population in 2010: 3,249 Zip code population in 2000: 2,986
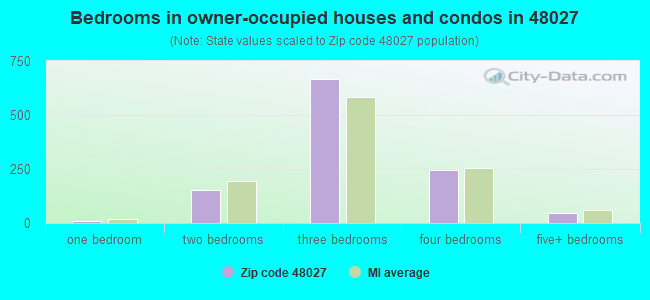
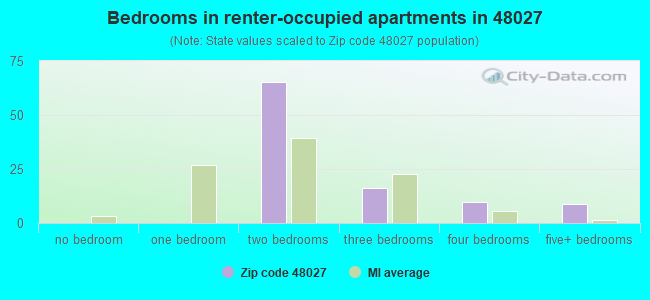
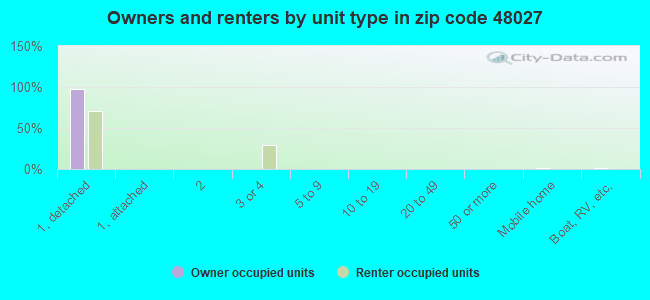
Houses and condos: 1,302 Renter-occupied apartments: 98
% of renters here:
8%
State:
27%
March 2022 cost of living index in zip code 48027: 90.4 (less than average, U.S. average is 100)
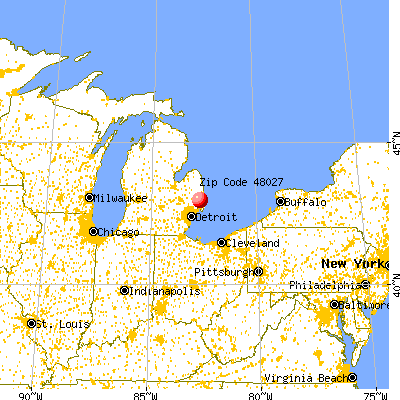
Land area: 37.4 sq. mi. Water area: 0.1 sq. mi.
Population density: 85 people per square mile
(very low).
OSM Map
General Map
Google Map
MSN Map
OSM Map
General Map
Google Map
MSN Map
OSM Map
General Map
Google Map
MSN Map
OSM Map
General Map
Google Map
MSN Map
Please wait while loading the map...
Real estate property taxes paid for housing units in 2022:
This zip code:
0.9% ($2,150)
Michigan:
1.2% ($2,746)
Median real estate property taxes paid for housing units with mortgages in 2022: $2,252 (0.9%) Median real estate property taxes paid for housing units with no mortgage in 2022: $1,988 (0.8%)
Business Search- 14 Million verified businesses
Males: 1,546
(48.6%)
Females: 1,633
(51.4%)
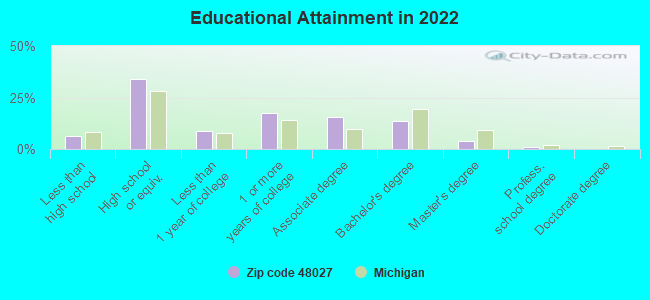
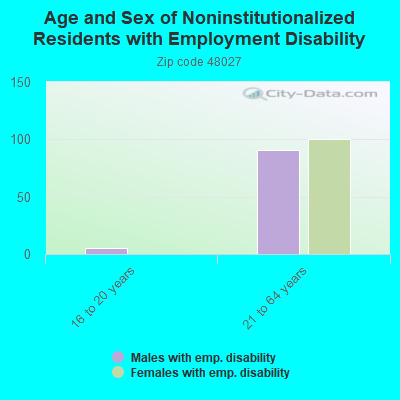
For population 25 years and over in 48027:
High school or higher: 92.8%
Bachelor's degree or higher: 17.9%
Graduate or professional degree: 4.7%
Unemployed: 6.3%
Mean travel time to work (commute): 34.7 minutes
For population 15 years and over in 48027:
Never married: 28.1%
Now married: 55.7%
Separated: 1.6%
Widowed: 3.6%
Divorced: 10.9%
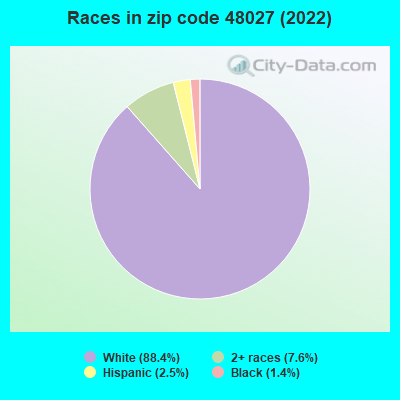
Zip code 48027 compared to state average:
Black race population percentage significantly below state average.
Hispanic race population percentage below state average.
Foreign-born population percentage significantly below state average.
Renting percentage significantly below state average.
Length of stay since moving in significantly above state average.
Percentage of population with a bachelor's degree or higher below state average.
Averages for the 2020 tax year for zip code 48027, filed in 2021:
Average Adjusted Gross Income (AGI) in 2020: $58,369 (Individual Income Tax Returns)
Here:
$58,369
State:
$68,945
Salary/wage: $55,740 (reported on 77.2% of returns)
Here:
$55,740
State:
$57,142
(% of AGI for various income ranges: 913.6% for AGIs below $25k, 3123.9% for AGIs $25k-50k, 6266.1% for AGIs $50k-75k, 9122.1% for AGIs $75k-100k, 14893.2% for AGIs $100k-200k)
Taxable interest for individuals: $670 (reported on 29.7% of returns)
This zip code:
$670
Michigan:
$1,630
(% of AGI for various income ranges: 18.8% for AGIs below $25k, 16.1% for AGIs $25k-50k, 26.1% for AGIs $50k-75k, 64.3% for AGIs $75k-100k, 37.4% for AGIs $100k-200k)
Ordinary dividends: $1,733 (reported on 15.2% of returns)
Here:
$1,733
State:
$6,972
(% of AGI for various income ranges: 16.1% for AGIs below $25k, 27.9% for AGIs $25k-50k, 34.4% for AGIs $50k-75k, 105.7% for AGIs $75k-100k, 39.5% for AGIs $100k-200k)
Net capital gain/loss in AGI: +$11,955 (reported on 13.9% of returns)
Here:
+$11,955
State:
+$20,064
(% of AGI for various income ranges: 3.9% for AGIs below $25k, 24.6% for AGIs $25k-50k, 67.2% for AGIs $50k-75k, 219.3% for AGIs $75k-100k, 1115.8% for AGIs $100k-200k)
Profit/loss from business: +$8,871 (reported on 13.3% of returns)
Here:
+$8,871
State:
+$11,172
(% of AGI for various income ranges: 95.8% for AGIs below $25k, 190.0% for AGIs $25k-50k, 181.1% for AGIs $50k-75k, 280.7% for AGIs $75k-100k, 155.8% for AGIs $100k-200k)
Taxable individual retirement arrangement distribution: $13,493 (reported on 8.9% of returns)
48027:
$13,493
Michigan:
$19,803
(% of AGI for various income ranges: 66.1% for AGIs below $25k, 151.1% for AGIs $25k-50k, 229.3% for AGIs $75k-100k, 487.9% for AGIs $100k-200k)
Total itemized deductions: $23,583 (reported on 3.8% of returns)
Here:
$23,583
State:
$34,117
(% of AGI for various income ranges: 382.8% for AGIs $50k-75k, 382.1% for AGIs $100k-200k)
Charity contributions: $4,500 (reported on 2.5% of returns)
Here:
$4,500
State:
$13,548
(% of AGI for various income ranges: 94.7% for AGIs $100k-200k)
Taxes paid: $6,950 (reported on 3.8% of returns)
48027:
$6,950
State:
$7,972
(% of AGI for various income ranges: 94.4% for AGIs $50k-75k, 130.0% for AGIs $100k-200k)
Earned income credit: $1,953 (reported on 9.5% of returns)
Here:
$1,953
State:
$2,251
(% of AGI for various income ranges: 45.2% for AGIs below $25k, 51.4% for AGIs $25k-50k)
Percentage of individuals using paid preparers for their 2020 taxes: 93.7%
Here:
94%
State:
93%
(% for various income ranges: 92.0% for AGIs below $25k, 94.3% for AGIs $25k-50k, 92.0% for AGIs $50k-75k, 95.0% for AGIs $75k-100k, 96.2% for AGIs $100k-200k, 100.0% for AGIs over 200k)
Averages for the 2012 tax year for zip code 48027, filed in 2013:
Average Adjusted Gross Income (AGI) in 2012: $52,653 (Individual Income Tax Returns)
Here:
$52,653
State:
$55,609
Salary/wage: $45,905 (reported on 84.7% of returns)
Here:
$45,905
State:
$46,782
(% of AGI for various income ranges: 64.9% for AGIs below $25k, 69.3% for AGIs $25k-50k, 79.9% for AGIs $50k-75k, 80.6% for AGIs $75k-100k, 70.8% for AGIs $100k-200k)
Taxable interest for individuals: $675 (reported on 32.0% of returns)
This zip code:
$675
Michigan:
$1,491
(% of AGI for various income ranges: 1.3% for AGIs below $25k, 0.8% for AGIs $25k-50k, 0.5% for AGIs $50k-75k, 0.3% for AGIs $75k-100k)
Ordinary dividends: $1,233 (reported on 16.0% of returns)
Here:
$1,233
State:
$6,225
(% of AGI for various income ranges: 1.0% for AGIs below $25k, 0.3% for AGIs $25k-50k, 0.5% for AGIs $50k-75k, 0.3% for AGIs $75k-100k, 0.3% for AGIs $100k-200k)
Net capital gain/loss in AGI: +$231 (reported on 10.7% of returns)
Here:
+$231
State:
+$9,326
(% of AGI for various income ranges: 0.4% for AGIs $75k-100k)
Profit/loss from business: +$7,325 (reported on 13.3% of returns)
Here:
+$7,325
State:
+$11,523
(% of AGI for various income ranges: 6.4% for AGIs below $25k, 2.2% for AGIs $25k-50k, 0.9% for AGIs $50k-75k, 1.2% for AGIs $75k-100k, 1.6% for AGIs $100k-200k)
Taxable individual retirement arrangement distribution: $9,912 (reported on 11.3% of returns)
48027:
$9,912
Michigan:
$15,298
(% of AGI for various income ranges: 3.4% for AGIs below $25k, 2.3% for AGIs $25k-50k, 2.0% for AGIs $50k-75k, 3.0% for AGIs $75k-100k, 1.5% for AGIs $100k-200k)
Total itemized deductions: $17,350 (19% of AGI, reported on 34.7% of returns)
Here:
$17,350
State:
$21,628
Here:
19.3% of AGI
State:
18.4% of AGI
(% of AGI for various income ranges: 9.3% for AGIs below $25k, 10.8% for AGIs $25k-50k, 11.7% for AGIs $50k-75k, 13.0% for AGIs $75k-100k, 11.2% for AGIs $100k-200k)
Charity contributions: $2,013 (reported on 26.0% of returns)
Here:
$2,013
State:
$4,225
(% of AGI for various income ranges: 0.6% for AGIs below $25k, 0.5% for AGIs $25k-50k, 0.9% for AGIs $50k-75k, 0.9% for AGIs $75k-100k, 1.3% for AGIs $100k-200k)
Taxes paid: $6,253 (reported on 34.0% of returns)
48027:
$6,253
State:
$8,327
(% of AGI for various income ranges: 2.0% for AGIs below $25k, 2.4% for AGIs $25k-50k, 3.5% for AGIs $50k-75k, 4.2% for AGIs $75k-100k, 5.2% for AGIs $100k-200k)
Earned income credit: $2,043 (reported on 14.0% of returns)
Here:
$2,043
State:
$2,306
(% of AGI for various income ranges: 5.5% for AGIs below $25k, 0.8% for AGIs $25k-50k)
Percentage of individuals using paid preparers for their 2012 taxes: 63.3%
Here:
63%
State:
57%
(% for various income ranges: 57.9% for AGIs below $25k, 61.3% for AGIs $25k-50k, 65.4% for AGIs $50k-75k, 70.6% for AGIs $75k-100k, 73.7% for AGIs $100k-200k)
Averages for the 2004 tax year for zip code 48027, filed in 2005:
Average Adjusted Gross Income (AGI) in 2004: $46,493 (Individual Income Tax Returns)
Here:
$46,493
State:
$48,204
Salary/wage: $44,029 (reported on 86.9% of returns)
Here:
$44,029
State:
$42,791
(% of AGI for various income ranges: 78.1% for AGIs below $10k, 62.1% for AGIs $10k-25k, 76.9% for AGIs $25k-50k, 84.2% for AGIs $50k-75k, 91.7% for AGIs $75k-100k, 81.0% for AGIs over 100k)
Taxable interest for individuals: $723 (reported on 53.7% of returns)
This zip code:
$723
Michigan:
$1,725
(% of AGI for various income ranges: 5.5% for AGIs below $10k, 2.3% for AGIs $10k-25k, 0.9% for AGIs $25k-50k, 1.2% for AGIs $50k-75k, 0.2% for AGIs $75k-100k, 0.3% for AGIs over 100k)
Taxable dividends: $913 (reported on 21.9% of returns)
Here:
$913
State:
$3,420
(% of AGI for various income ranges: 4.2% for AGIs below $10k, 0.8% for AGIs $10k-25k, 0.6% for AGIs $25k-50k, 0.5% for AGIs $50k-75k, 0.2% for AGIs $75k-100k, 0.2% for AGIs over 100k)
Net capital gain/loss: +$1,018 (reported on 12.4% of returns)
Here:
+$1,018
State:
+$8,532
(% of AGI for various income ranges: 1.5% for AGIs below $10k, 0.4% for AGIs $10k-25k, 0.1% for AGIs $25k-50k, 0.5% for AGIs $50k-75k, 0.0% for AGIs $75k-100k, 0.3% for AGIs over 100k)
Profit/loss from business: +$5,973 (reported on 13.8% of returns)
Here:
+$5,973
State:
+$9,547
(% of AGI for various income ranges: -7.6% for AGIs below $10k, 7.6% for AGIs $10k-25k, 2.3% for AGIs $25k-50k, 1.9% for AGIs $50k-75k, 0.1% for AGIs $75k-100k, 1.9% for AGIs over 100k)
IRA payment deduction: $3,105 (reported on 1.4% of returns)
48027:
$3,105
Michigan:
$2,875
Total itemized deductions: $16,529 (24% of AGI, reported on 45.0% of returns)
Here:
$16,529
State:
$18,509
Here:
23.7% of AGI
State:
20.7% of AGI
(% of AGI for various income ranges: 15.5% for AGIs $10k-25k, 16.1% for AGIs $25k-50k, 16.9% for AGIs $50k-75k, 17.4% for AGIs $75k-100k, 14.8% for AGIs over 100k)
Charity contributions deductions: $1,753 (2% of AGI, reported on 40.5% of returns)
Here:
$1,753
State:
$3,365
Here:
2.5% of AGI
State:
3.6% of AGI
(% of AGI for various income ranges: 0.8% for AGIs $10k-25k, 1.4% for AGIs $25k-50k, 1.6% for AGIs $50k-75k, 1.7% for AGIs $75k-100k, 1.6% for AGIs over 100k)
Total tax: $5,492 (reported on 80.1% of returns)
48027:
$5,492
State:
$7,691
(% of AGI for various income ranges: 2.3% for AGIs below $10k, 4.8% for AGIs $10k-25k, 6.6% for AGIs $25k-50k, 8.2% for AGIs $50k-75k, 9.3% for AGIs $75k-100k, 15.4% for AGIs over 100k)
Earned income credit: $1,613 (reported on 10.1% of returns)
Here:
$1,613
State:
$1,737
Percentage of individuals using paid preparers for their 2004 taxes: 63.1%
Here:
63%
State:
60%
(% for various income ranges: 51.5% for AGIs below $10k, 61.9% for AGIs $10k-25k, 66.5% for AGIs $25k-50k, 69.0% for AGIs $50k-75k, 60.9% for AGIs $75k-100k, 70.6% for AGIs over 100k)
Household received Food Stamps/SNAP in the past 12 months: 85 Household did not receive Food Stamps/SNAP in the past 12 months: 1,115
Women who had a birth in the past 12 months: 84 (38 now married, 44 unmarried) Women who did not have a birth in the past 12 months: 706 (308 now married, 397 unmarried)
Housing units in zip code 48027 with a mortgage: 728 (84 second mortgage, 88 both second mortgage and home equity loan) Houses without a mortgage: 15
Median monthly owner costs for units with a mortgage: $1,458 Median monthly owner costs for units without a mortgage: $488
Residents with income below the poverty level in 2022:
This zip code:
3.3%
Whole state:
13.4%
Residents with income below 50% of the poverty level in 2022:
This zip code:
1.0%
Whole state:
6.9%
Median number of rooms in houses and condos:
Here:
6.5
State:
6.5
Median number of rooms in apartments:
Here:
4.9
State:
4.3
Notable locations in this zip code not listed on our city pages
Churches in zip code 48027 include: Mount Pleasant Church (A), Hope Lutheran Church (B), First Baptist Church (C), County Park Bible Church (D). Display/hide their locations on the map
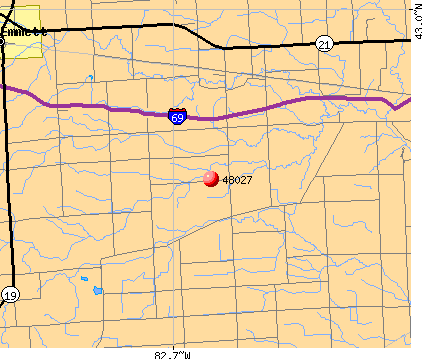
Streams, rivers, and creeks: Neaton Drain (A), Moore Creek (B), Johnson Drain (C), Indian Creek (D), Green Drain (E), Wonderlic Drain (F), Campbell Drain (G), Riley-Wales Drain (H), Apply Drain (I). Display/hide their locations on the map
In group quarters: 2 (-1 institutionalized population)
Size of family households: 315 2-persons, 258 3-persons, 186 4-persons, 87 5-persons, 22 6-persons
Size of nonfamily households: 240 1-person, 88 2-persons
510 married couples with children.
123 single-parent households (16 men, 107 women).
97.8% of residents of 48027 zip code speak English at home.
0.8% of residents speak other Indo-European language at home (65% very well, 35% well).
0.9% of residents speak other language at home (100% very well).
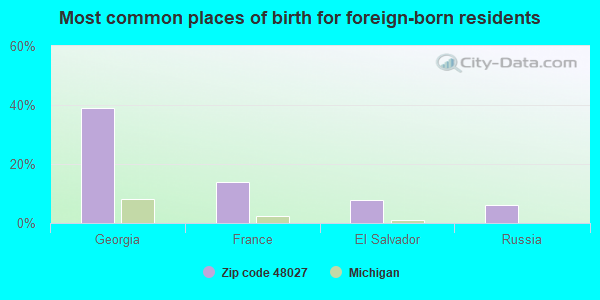
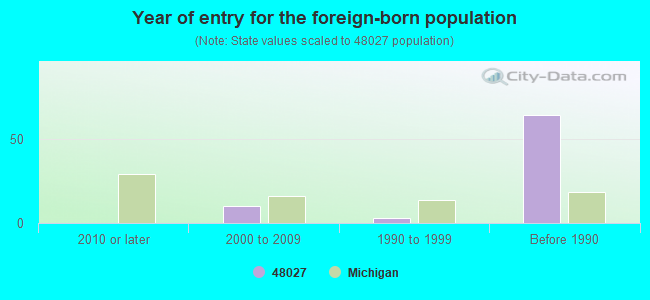
Foreign born population: 64 (2.0%) (62.2% of them are naturalized citizens)
This zip code:
2.0%
Whole state:
6.9%
39%Georgia
14%France
8%El Salvador
6%Russia
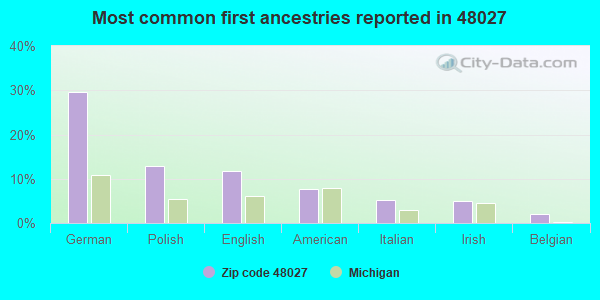
30%German
13%Polish
12%English
8%American
5%Italian
5%Irish
2%Belgian
Year of entry for the foreign-born population
02010 or later
102000 to 2009
31990 to 1999
64Before 1990
Facilities with environmental interests located in this zip code:
AT AND T LONG LINES LAMB MI (SOUTH SIDE SMITH CREEK EAST WALES CENTER in GOODELLS, MI)
(Resource Conservation and Recovery Act (tracking hazardous waste)) Organizations: AT & T (CONTACT/OPERATOR)
MI DEPT/TRANSPORTATION BRIDGE (I-69 & GOODELLS RD in GOODELLS, MI)
(Resource Conservation and Recovery Act (tracking hazardous waste)) Organizations: MICH DEPT OF TRANSPORTATION (CONTACT/OPERATOR)
Alternative names: MIDOT BRIDGE I-69 & GOODELLS RD
Housing units lacking complete plumbing facilities: 0.3% Housing units lacking complete kitchen facilities: 2.2%
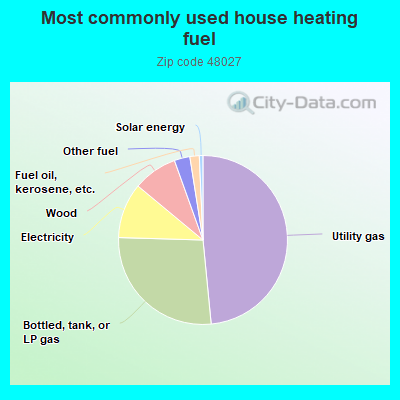
48.6%Utility gas
27.1%Bottled, tank, or LP gas
10.6%Electricity
8.5%Wood
3.0%Other fuel
1.8%Fuel oil, kerosene, etc.
0.7%Solar energy
Population in 1990: 3,285.
Place of birth for U.S.-born residents:
This state: 2,808
Northeast: 39
Midwest: 91
South: 132
West: 14
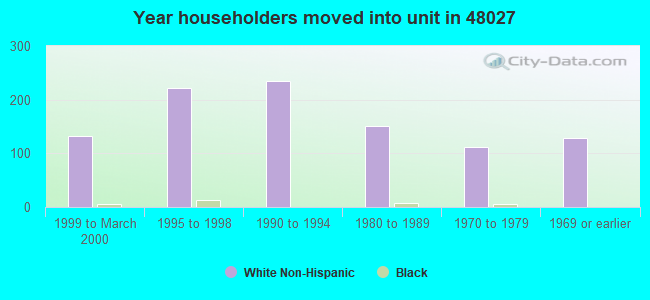
66% of the 48027 zip code residents lived in the same house 5 years ago. Out of people who lived in different houses, 45% lived in this county. Out of people who lived in different counties, 50% lived in Michigan.
98% of the 48027 zip code residents lived in the same house 1 year ago. Out of people who lived in different houses, 21% moved from this county. Out of people who lived in different houses, 77% moved from different county within same state. Out of people who lived in different houses, 13% moved from different state. Out of people who lived in different houses, 8% moved from abroad.
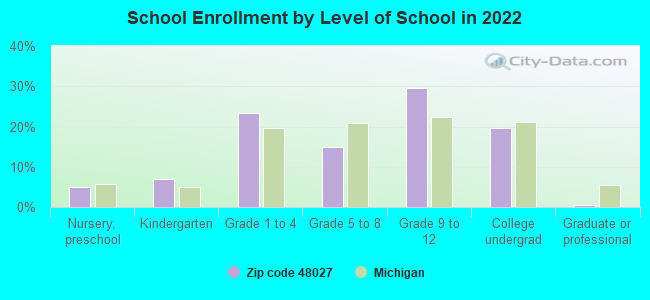
Private vs. public school enrollment:
Students in private schools in grades 1 to 8 (elementary and middle school): 14
Here:
5.8%
Michigan:
12.4%
Students in private schools in grades 9 to 12 (high school): 27
Here:
13.6%
Michigan:
9.8%
Students in private undergraduate colleges: 17
Here:
13.1%
Michigan:
14.9%
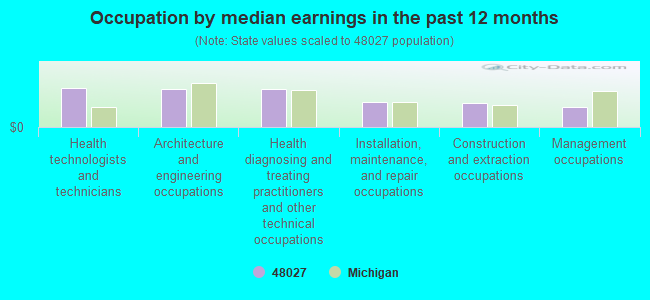
Occupation by median earnings in the past 12 months ($)
112,398Health technologists and technicians
109,232Architecture and engineering occupations
109,032Health diagnosing and treating practitioners and other technical occupations
70,951Installation, maintenance, and repair occupations
69,448Construction and extraction occupations
57,403Management occupations
Companies with federal contracts located in this zip code:
JEFFREY ALAN MANUFACTURING & E (8625 LAPEER ROAD in GOODELLS, MI; small business) : $653,155 in 13 contractsfrom 2001 to 2006
Contracts for Guns, through 30 mm, Guns, over 150 mm through 200 mm by Defense Logistics Agency Signed by year:2000: $0; 2001: $155,316; 2002: $84,520; 2003: $95,806; 2004: $166,144; 2005: $54,789; 2006: $96,580.
Biggest contracts:
$96,580 with Defense Logistics Agency for Guns, through 30 mm. Signed on 2006-02-11. Completion date: 2006-08-10.
$84,520, same as above.Signed on 2002-07-24. Completion date: 2003-03-21.
$77,916, same as above.Signed on 2001-10-19. Completion date: 2002-09-08.
$77,400, same as above.Signed on 2001-08-13. Completion date: 2002-03-11.
Top industries in this zip code by the number of employees in 2005:
Arts, Entertainment, and Recreation: Golf Courses and Country Clubs (10-19 employees: 1 establishment, 1-4 employees: 1 establishment)
Accommodation and Food Services: Full-Service Restaurants (10-19: 1)
Construction: New Single-Family Housing Construction (except Operative Builders) (5-9: 1)
Construction: Industrial Building Construction (5-9: 1)
Construction: Residential Remodelers (1-4: 2)
Construction: Commercial and Institutional Building Construction (1-4: 1)
People in group quarters in 2010:
8 people in group homes intended for adults
People in group quarters in 2000:
23 people in other group homes
Fatal accident statistics in 2012:
Fatal accident count: 1
Vehicles involved in fatal accidents: 1
Fatal accidents caused by drunken drivers: 1
Fatalities: 1
Persons involved in fatal accidents: 1
Pedestrians involved in fatal accidents: 0
Fatal accident statistics in 2011:
Fatal accident count: 1
Vehicles involved in fatal accidents: 1
Fatal accidents caused by drunken drivers: 0
Fatalities: 1
Persons involved in fatal accidents: 1
Pedestrians involved in fatal accidents: 0
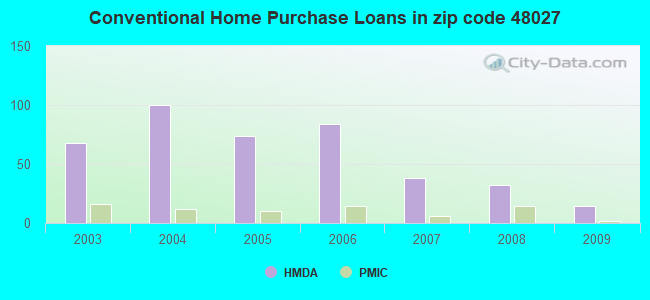
Home Mortgage Disclosure Act Aggregated Statistics For Year 2009 (Based on 2 full tracts)
A) FHA, FSA/RHS & VA Home Purchase Loans
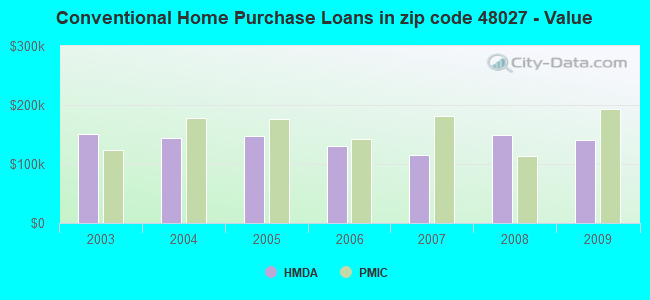
B) Conventional Home Purchase Loans
C) Refinancings
D) Home Improvement Loans
F) Non-occupant Loans on < 5 Family Dwellings (A B C & D)
G) Loans On Manufactured Home Dwelling (A B C & D)
Number
Average Value
Number
Average Value
Number
Average Value
Number
Average Value
Number
Average Value
Number
Average Value
LOANS ORIGINATED
36
$130,520
14
$140,473
146
$138,492
8
$5,246
6
$93,268
4
$114,920
APPLICATIONS APPROVED, NOT ACCEPTED
8
$113,920
4
$76,448
20
$130,608
0
$0
0
$0
2
$93,935
APPLICATIONS DENIED
16
$122,414
2
$14,990
48
$158,472
4
$4,498
0
$0
0
$0
APPLICATIONS WITHDRAWN
2
$122,915
0
$0
26
$142,592
2
$3,000
0
$0
0
$0
FILES CLOSED FOR INCOMPLETENESS
2
$37,975
0
$0
4
$102,428
0
$0
0
$0
0
$0
Aggregated Statistics For Year 2008 (Based on 2 full tracts)
A) FHA, FSA/RHS & VA Home Purchase Loans
B) Conventional Home Purchase Loans
C) Refinancings
D) Home Improvement Loans
F) Non-occupant Loans on < 5 Family Dwellings (A B C & D)
G) Loans On Manufactured Home Dwelling (A B C & D)
Number
Average Value
Number
Average Value
Number
Average Value
Number
Average Value
Number
Average Value
Number
Average Value
LOANS ORIGINATED
26
$118,378
32
$149,958
98
$136,680
14
$50,536
6
$51,630
14
$97,218
APPLICATIONS APPROVED, NOT ACCEPTED
8
$108,424
2
$22,985
16
$140,402
2
$280,805
0
$0
0
$0
APPLICATIONS DENIED
6
$126,578
8
$125,911
72
$181,623
6
$35,642
0
$0
8
$183,121
APPLICATIONS WITHDRAWN
2
$96,930
6
$67,952
20
$121,714
4
$50,465
0
$0
0
$0
FILES CLOSED FOR INCOMPLETENESS
4
$96,432
0
$0
12
$209,687
2
$150,895
0
$0
2
$76,945
Aggregated Statistics For Year 2007 (Based on 2 full tracts)
A) FHA, FSA/RHS & VA Home Purchase Loans
B) Conventional Home Purchase Loans
C) Refinancings
D) Home Improvement Loans
F) Non-occupant Loans on < 5 Family Dwellings (A B C & D)
G) Loans On Manufactured Home Dwelling (A B C & D)
Number
Average Value
Number
Average Value
Number
Average Value
Number
Average Value
Number
Average Value
Number
Average Value
LOANS ORIGINATED
2
$132,905
38
$115,077
132
$128,758
26
$56,115
10
$95,733
4
$69,950
APPLICATIONS APPROVED, NOT ACCEPTED
2
$108,925
6
$158,555
34
$156,185
8
$31,728
0
$0
6
$100,930
APPLICATIONS DENIED
4
$149,895
8
$113,171
116
$153,151
32
$92,685
8
$87,439
8
$104,676
APPLICATIONS WITHDRAWN
4
$233,338
0
$0
26
$160,195
0
$0
0
$0
0
$0
FILES CLOSED FOR INCOMPLETENESS
0
$0
4
$118,418
10
$167,083
0
$0
0
$0
2
$90,935
Aggregated Statistics For Year 2006 (Based on 2 full tracts)
A) FHA, FSA/RHS & VA Home Purchase Loans
B) Conventional Home Purchase Loans
C) Refinancings
D) Home Improvement Loans
F) Non-occupant Loans on < 5 Family Dwellings (A B C & D)
G) Loans On Manufactured Home Dwelling (A B C & D)
Number
Average Value
Number
Average Value
Number
Average Value
Number
Average Value
Number
Average Value
Number
Average Value
LOANS ORIGINATED
18
$160,776
84
$130,099
186
$124,687
36
$28,813
12
$121,248
16
$140,402
APPLICATIONS APPROVED, NOT ACCEPTED
0
$0
20
$119,716
42
$162,410
6
$42,637
4
$179,875
6
$149,895
APPLICATIONS DENIED
4
$166,382
16
$117,418
158
$160,609
16
$15,989
4
$157,390
4
$143,900
APPLICATIONS WITHDRAWN
0
$0
10
$144,899
52
$142,669
8
$29,230
0
$0
2
$131,910
FILES CLOSED FOR INCOMPLETENESS
0
$0
0
$0
48
$150,061
4
$13,990
0
$0
0
$0
Aggregated Statistics For Year 2005 (Based on 2 full tracts)
A) FHA, FSA/RHS & VA Home Purchase Loans
B) Conventional Home Purchase Loans
C) Refinancings
D) Home Improvement Loans
F) Non-occupant Loans on < 5 Family Dwellings (A B C & D)
G) Loans On Manufactured Home Dwelling (A B C & D)
Number
Average Value
Number
Average Value
Number
Average Value
Number
Average Value
Number
Average Value
Number
Average Value
LOANS ORIGINATED
20
$179,874
74
$147,329
252
$143,098
24
$53,712
6
$218,180
18
$130,686
APPLICATIONS APPROVED, NOT ACCEPTED
2
$72,950
12
$126,245
32
$184,121
2
$29,980
6
$329,103
6
$132,240
APPLICATIONS DENIED
0
$0
22
$120,734
130
$158,597
18
$32,199
4
$79,445
16
$112,546
APPLICATIONS WITHDRAWN
0
$0
22
$130,727
60
$189,068
20
$41,371
2
$126,910
2
$104,925
FILES CLOSED FOR INCOMPLETENESS
0
$0
10
$90,936
60
$175,744
4
$184,370
0
$0
2
$110,920
Aggregated Statistics For Year 2004 (Based on 2 full tracts)
A) FHA, FSA/RHS & VA Home Purchase Loans
B) Conventional Home Purchase Loans
C) Refinancings
D) Home Improvement Loans
F) Non-occupant Loans on < 5 Family Dwellings (A B C & D)
G) Loans On Manufactured Home Dwelling (A B C & D)
Number
Average Value
Number
Average Value
Number
Average Value
Number
Average Value
Number
Average Value
Number
Average Value
LOANS ORIGINATED
8
$153,142
100
$144,259
334
$138,562
38
$70,687
16
$125,288
16
$109,548
APPLICATIONS APPROVED, NOT ACCEPTED
0
$0
16
$149,021
50
$147,936
4
$24,982
2
$111,920
2
$189,865
APPLICATIONS DENIED
2
$158,890
30
$130,575
120
$156,291
16
$32,727
4
$180,872
12
$130,076
APPLICATIONS WITHDRAWN
0
$0
6
$220,845
82
$151,625
6
$113,253
2
$38,975
2
$108,925
FILES CLOSED FOR INCOMPLETENESS
2
$157,890
0
$0
50
$187,069
0
$0
0
$0
2
$159,890
Aggregated Statistics For Year 2003 (Based on 2 full tracts)
A) FHA, FSA/RHS & VA Home Purchase Loans
B) Conventional Home Purchase Loans
C) Refinancings
D) Home Improvement Loans
F) Non-occupant Loans on < 5 Family Dwellings (A B C & D)
Detailed PMIC statistics for the following Tracts:6526.00
2002 - 2018 National Fire Incident Reporting System (NFIRS) incidents
Based on the data from the years 2002 - 2018 the average number of fires per year is 13. The highest number of fires - 36 took place in 2003, and the least - 3 in 2017. The data has a growing trend.
When looking into fire subcategories, the most reports belonged to: Structure Fires (59.6%), and Outside Fires (25.4%).
Fire incident types reported to NFIRS in Zip Code 48027


 Nearest zip codes: 48063, 48041, 48074, 48022, 48062, 48006.


 Based on the data from the years 2002 - 2018 the average number of fires per year is 13. The highest number of fires - 36 took place in 2003, and the least - 3 in 2017. The data has a growing trend.
 When looking into fire subcategories, the most reports belonged to: Structure Fires (59.6%), and Outside Fires (25.4%).