Estimated zip code population in 2022: 1,773 Zip code population in 2010: 1,704 Zip code population in 2000: 1,562
Houses and condos: 614 Renter-occupied apartments: 84
% of renters here:
16%
State:
29%
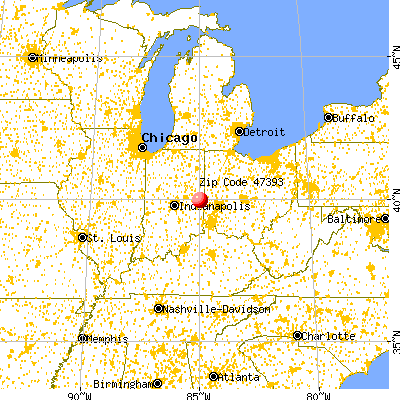
March 2022 cost of living index in zip code 47393: 84.8 (less than average, U.S. average is 100)
Land area: 37.2 sq. mi. Water area: 0.1 sq. mi.
Population density: 48 people per square mile
(very low).
OSM Map
General Map
Google Map
MSN Map
OSM Map
General Map
Google Map
MSN Map
OSM Map
General Map
Google Map
MSN Map
OSM Map
General Map
Google Map
MSN Map
Please wait while loading the map...
Real estate property taxes paid for housing units in 2022:
This zip code:
0.9% ($1,308)
Indiana:
0.7% ($1,467)
Median real estate property taxes paid for housing units with mortgages in 2022: $1,314 (0.9%) Median real estate property taxes paid for housing units with no mortgage in 2022: $1,433 (1.2%)
Business Search- 14 Million verified businesses
Males: 840
(47.4%)
Females: 933
(52.6%)
For population 25 years and over in 47393:
High school or higher: 83.0%
Bachelor's degree or higher: 7.8%
Graduate or professional degree: 6.7%
Unemployed: 6.4%
Mean travel time to work (commute): 22.8 minutes
For population 15 years and over in 47393:
Never married: 34.6%
Now married: 55.3%
Separated: 0.0%
Widowed: 2.0%
Divorced: 8.2%
Zip code 47393 compared to state average:
Unemployed percentage above state average.
Black race population percentage significantly below state average.
Hispanic race population percentage below state average.
Median age below state average.
Foreign-born population percentage significantly below state average.
Renting percentage below state average.
Number of rooms per house above state average.
Number of college students significantly below state average.
Percentage of population with a bachelor's degree or higher significantly below state average.
Estimated median house/condo value in 2022: $150,728
47393:
$150,728
Indiana:
$208,700
According to our research of Indiana and other state lists, there was 1 registered sex offender living in 47393 zip code as of July 03, 2024. The ratio of all residents to sex offenders in zip code 47393 is 1,537 to 1. The ratio of registered sex offenders to all residents in this zip code is much lower than the state average.
Median resident age:
This zip code:
31.9 years
Indiana median age:
38.2 years
Average household size:
This zip code:
3.4 people
Indiana:
2.4 people
Averages for the 2020 tax year for zip code 47393, filed in 2021:
Average Adjusted Gross Income (AGI) in 2020: $58,996 (Individual Income Tax Returns)
Here:
$58,996
State:
$64,978
Salary/wage: $51,127 (reported on 77.6% of returns)
Here:
$51,127
State:
$55,245
(% of AGI for various income ranges: 1045.8% for AGIs below $25k, 3912.5% for AGIs $25k-50k, 7855.0% for AGIs $50k-75k, 11252.5% for AGIs $75k-100k, 19036.7% for AGIs $100k-200k)
Taxable interest for individuals: $606 (reported on 25.4% of returns)
This zip code:
$606
Indiana:
$1,351
(% of AGI for various income ranges: 13.3% for AGIs below $25k, 15.0% for AGIs $25k-50k, 30.0% for AGIs $50k-75k, 12.5% for AGIs $75k-100k, 76.7% for AGIs $100k-200k)
Ordinary dividends: $2,000 (reported on 10.4% of returns)
Here:
$2,000
State:
$5,827
(% of AGI for various income ranges: 22.5% for AGIs below $25k, 41.7% for AGIs $50k-75k, 146.7% for AGIs $100k-200k)
Net capital gain/loss in AGI: +$8,278 (reported on 13.4% of returns)
Here:
+$8,278
State:
+$17,730
(% of AGI for various income ranges: 134.2% for AGIs below $25k, 296.7% for AGIs $50k-75k, 676.7% for AGIs $100k-200k)
Profit/loss from business: +$21,855 (reported on 16.4% of returns)
Here:
+$21,855
State:
+$12,144
(% of AGI for various income ranges: 224.2% for AGIs below $25k, 517.5% for AGIs $25k-50k, 1438.3% for AGIs $50k-75k, 1085.0% for AGIs $100k-200k)
Taxable individual retirement arrangement distribution: $10,200 (reported on 9.0% of returns)
47393:
$10,200
Indiana:
$18,302
(% of AGI for various income ranges: 325.0% for AGIs below $25k, 370.0% for AGIs $50k-75k)
Earned income credit: $2,289 (reported on 13.4% of returns)
Here:
$2,289
State:
$2,298
(% of AGI for various income ranges: 83.3% for AGIs below $25k, 88.3% for AGIs $25k-50k)
Percentage of individuals using paid preparers for their 2020 taxes: 98.5%
Here:
99%
State:
94%
(% for various income ranges: 95.2% for AGIs below $25k, 100.0% for AGIs $25k-50k, 100.0% for AGIs $50k-75k, 100.0% for AGIs $75k-100k, 100.0% for AGIs $100k-200k)
Averages for the 2012 tax year for zip code 47393, filed in 2013:
Average Adjusted Gross Income (AGI) in 2012: $47,000 (Individual Income Tax Returns)
Here:
$47,000
State:
$52,932
Salary/wage: $40,645 (reported on 79.7% of returns)
Here:
$40,645
State:
$45,173
(% of AGI for various income ranges: 60.7% for AGIs below $25k, 75.0% for AGIs $25k-50k, 81.6% for AGIs $50k-75k, 79.9% for AGIs $75k-100k, 51.9% for AGIs $100k-200k)
Taxable interest for individuals: $420 (reported on 31.2% of returns)
This zip code:
$420
Indiana:
$1,311
(% of AGI for various income ranges: 1.0% for AGIs below $25k, 0.2% for AGIs $25k-50k, 0.1% for AGIs $50k-75k, 0.3% for AGIs $75k-100k, 0.2% for AGIs $100k-200k)
Ordinary dividends: $914 (reported on 10.9% of returns)
Here:
$914
State:
$4,690
Net capital gain/loss in AGI: +$7,643 (reported on 10.9% of returns)
Here:
+$7,643
State:
+$10,406
(% of AGI for various income ranges: 2.1% for AGIs below $25k, 1.4% for AGIs $25k-50k, 5.0% for AGIs $50k-75k)
Profit/loss from business: +$8,573 (reported on 17.2% of returns)
Here:
+$8,573
State:
+$11,105
(% of AGI for various income ranges: 15.0% for AGIs below $25k, 6.9% for AGIs $25k-50k, 0.9% for AGIs $50k-75k)
Taxable individual retirement arrangement distribution: $9,514 (reported on 10.9% of returns)
47393:
$9,514
Indiana:
$13,841
Total itemized deductions: $19,758 (22% of AGI, reported on 18.8% of returns)
Here:
$19,758
State:
$20,913
Here:
22.4% of AGI
State:
18.2% of AGI
(% of AGI for various income ranges: 8.4% for AGIs $25k-50k, 8.7% for AGIs $50k-75k, 9.7% for AGIs $75k-100k, 8.8% for AGIs $100k-200k)
Charity contributions: $3,989 (reported on 14.1% of returns)
Here:
$3,989
State:
$4,697
Taxes paid: $5,667 (reported on 18.8% of returns)
47393:
$5,667
State:
$7,456
(% of AGI for various income ranges: 1.3% for AGIs $25k-50k, 2.2% for AGIs $50k-75k, 2.6% for AGIs $75k-100k, 3.6% for AGIs $100k-200k)
Earned income credit: $2,073 (reported on 17.2% of returns)
Here:
$2,073
State:
$2,265
(% of AGI for various income ranges: 5.2% for AGIs below $25k, 1.1% for AGIs $25k-50k)
Percentage of individuals using paid preparers for their 2012 taxes: 59.4%
Here:
59%
State:
53%
(% for various income ranges: 59.3% for AGIs below $25k, 60.0% for AGIs $25k-50k, 50.0% for AGIs $50k-75k, 60.0% for AGIs $75k-100k, 80.0% for AGIs $100k-200k)
Averages for the 2004 tax year for zip code 47393, filed in 2005:
Average Adjusted Gross Income (AGI) in 2004: $35,889 (Individual Income Tax Returns)
Here:
$35,889
State:
$44,790
Salary/wage: $36,334 (reported on 82.6% of returns)
Here:
$36,334
State:
$39,615
(% of AGI for various income ranges: 145.5% for AGIs below $10k, 64.7% for AGIs $10k-25k, 85.6% for AGIs $25k-50k, 91.0% for AGIs $50k-75k, 92.4% for AGIs $75k-100k, 61.9% for AGIs over 100k)
Taxable interest for individuals: $511 (reported on 42.7% of returns)
This zip code:
$511
Indiana:
$1,535
(% of AGI for various income ranges: 6.8% for AGIs below $10k, 2.5% for AGIs $10k-25k, 0.6% for AGIs $25k-50k, 0.1% for AGIs $50k-75k, 0.1% for AGIs $75k-100k, 0.1% for AGIs over 100k)
Taxable dividends: $431 (reported on 15.5% of returns)
Here:
$431
State:
$2,998
(% of AGI for various income ranges: 2.8% for AGIs below $10k, 0.2% for AGIs $10k-25k, 0.3% for AGIs $25k-50k, 0.1% for AGIs $50k-75k, 0.2% for AGIs $75k-100k)
Net capital gain/loss: +$563 (reported on 15.7% of returns)
Here:
+$563
State:
+$8,619
(% of AGI for various income ranges: -6.2% for AGIs below $10k, 1.6% for AGIs $10k-25k, 0.2% for AGIs $25k-50k, 0.3% for AGIs $50k-75k, -0.1% for AGIs $75k-100k)
Profit/loss from business: +$6,128 (reported on 14.3% of returns)
Here:
+$6,128
State:
+$10,071
(% of AGI for various income ranges: 12.4% for AGIs below $10k, 13.7% for AGIs $10k-25k, 2.6% for AGIs $25k-50k, 0.1% for AGIs $50k-75k)
Profit/loss from farming: +$633 (reported on 12.0% of returns)
Here:
+$633
State:
-$2,212
(% of AGI for various income ranges: -47.2% for AGIs below $10k, 8.0% for AGIs $10k-25k, 1.2% for AGIs $25k-50k, -0.9% for AGIs $50k-75k)
IRA payment deduction: $3,364 (reported on 1.7% of returns)
47393:
$3,364
Indiana:
$2,840
Total itemized deductions: $14,869 (23% of AGI, reported on 25.6% of returns)
Here:
$14,869
State:
$17,065
Here:
22.6% of AGI
State:
19.5% of AGI
(% of AGI for various income ranges: 3.9% for AGIs $10k-25k, 10.2% for AGIs $25k-50k, 9.8% for AGIs $50k-75k, 17.3% for AGIs $75k-100k, 13.6% for AGIs over 100k)
Charity contributions deductions: $3,066 (4% of AGI, reported on 18.4% of returns)
Here:
$3,066
State:
$3,550
Here:
4.2% of AGI
State:
3.8% of AGI
(% of AGI for various income ranges: 1.3% for AGIs $25k-50k, 1.5% for AGIs $50k-75k, 2.6% for AGIs $75k-100k, 2.8% for AGIs over 100k)
Total tax: $4,181 (reported on 72.3% of returns)
47393:
$4,181
State:
$6,914
(% of AGI for various income ranges: 2.8% for AGIs below $10k, 5.0% for AGIs $10k-25k, 5.8% for AGIs $25k-50k, 8.0% for AGIs $50k-75k, 10.2% for AGIs $75k-100k, 16.6% for AGIs over 100k)
Earned income credit: $1,767 (reported on 13.1% of returns)
Here:
$1,767
State:
$1,685
Percentage of individuals using paid preparers for their 2004 taxes: 61.4%
Here:
61%
State:
59%
(% for various income ranges: 57.7% for AGIs below $10k, 65.6% for AGIs $10k-25k, 59.1% for AGIs $25k-50k, 59.5% for AGIs $50k-75k, 67.6% for AGIs $75k-100k, 77.8% for AGIs over 100k)
Household received Food Stamps/SNAP in the past 12 months: 5 Household did not receive Food Stamps/SNAP in the past 12 months: 520
Women who had a birth in the past 12 months: 90 (58 now married, 30 unmarried) Women who did not have a birth in the past 12 months: 405 (175 now married, 229 unmarried)
Housing units in zip code 47393 with a mortgage: 360 (23 second mortgage, 24 both second mortgage and home equity loan) Median monthly owner costs for units with a mortgage: $1,308 Median monthly owner costs for units without a mortgage: $577
Residents with income below the poverty level in 2022:
This zip code:
12.7%
Whole state:
12.6%
Residents with income below 50% of the poverty level in 2022:
This zip code:
7.5%
Whole state:
6.3%
Median number of rooms in houses and condos:
Here:
7.3
State:
6.6
Median number of rooms in apartments:
Here:
6.6
State:
4.3
Notable locations in this zip code not listed on our city pages
Notable locations in zip code 47393: Radford Hog Farms (A), Webster Volunteer Fire Department (B), Williamsburg Volunteer Fire Department (C). Display/hide their locations on the map
Streams, rivers, and creeks: William Creek (A), Tie Run (B), Wash Branch (C), Town Creek (D), Hopewell Run (E), High Brook (F), Knoll Run (G), Fruit Branch (H), Dover Run (I). Display/hide their locations on the map
Size of family households: 209 2-persons, 92 3-persons, 20 4-persons, 19 5-persons, 65 6-persons, 50 7-or-more-persons
Size of nonfamily households: 22 1-person, 50 2-persons
460 married couples with children.
86 single-parent households (27 men, 59 women).
79.0% of residents of 47393 zip code speak English at home.
3.0% of residents speak Spanish at home (79% very well, 21% well).
20.1% of residents speak other Indo-European language at home (70% very well, 22% well, 8% not well).
Foreign born population: 8 (0.5%) (0.0% of them are naturalized citizens)
:
0.5%
Whole state:
6.1%
100%Honduras
26%German
16%Pennsylvania German
13%American
7%English
3%Irish
Year of entry for the foreign-born population
02010 or later
02000 to 2009
71990 to 1999
0Before 1990
Facilities with environmental interests located in this zip code:
ROYSTER CLARK INC (9417 US 35 in WILLIAMSBURG, IN)
STATE MASTER (Indiana facility tracking) - CRTK-3960, EPCRA, LUST-199503516, LEAKING STORAGE TANK, UST-9176, UNDERGROUND STORAGE TANK PROGRAM (Resource Conservation and Recovery Act (tracking hazardous waste)) Organizations: KAISER ESTECH (CONTACT/OWNER)
Alternative names: KAISER ESTECH
37.2%Bottled, tank, or LP gas
18.8%Electricity
17.6%Utility gas
16.8%Wood
10.0%Fuel oil, kerosene, etc.
Population in 1990: 1,272. Population change in the 1990s: +290 (+22.8%).
Place of birth for U.S.-born residents:
This state: 1,250
Northeast: 211
Midwest: 233
South: 61
64% of the 47393 zip code residents lived in the same house 5 years ago. Out of people who lived in different houses, 52% lived in this county. Out of people who lived in different counties, 50% lived in Indiana.
99% of the 47393 zip code residents lived in the same house 1 year ago. Out of people who lived in different houses, 162% moved from different county within same state.
Private vs. public school enrollment:
Students in private schools in grades 1 to 8 (elementary and middle school): 98
Here:
44.2%
Indiana:
14.9%
Students in private schools in grades 9 to 12 (high school): 6
Here:
6.0%
Indiana:
11.4%
Occupation by median earnings in the past 12 months ($)
68,592Installation, maintenance, and repair occupations
53,092Office and administrative support occupations
45,328Management occupations
34,340Production occupations
33,563Sales and related occupations
29,952Construction and extraction occupations
Companies with federal contracts located in this zip code:
LADD LAWN CARE (6824 N CENTERVILLE RD in WILLIAMSBURG, IN; small business) : $11,155 in 5 contractsin 2003
Contracts for Landscaping/Groundskeeping Services, Snow Removal/Salt Service (also spreading aggregate or other snow melting material) by Army Signed by year:2000: $0; 2001: $0; 2002: $0; 2003: $11,155; 2004: $0; 2005: $0; 2006: $0.
Biggest contracts:
$5,985 with Army for Landscaping/Groundskeeping Services. Signed on 2003-03-08. Completion date: 2004-03-31.
$3,610 with Army for Snow Removal/Salt Service (also spreading aggregate or other snow melting material). Signed on 2003-04-29. Completion date: 2003-10-31.
$1,560, same as above.Signed on 2003-05-21. Completion date: 2003-10-31.
$0, same as above.Signed on 2003-04-29. Completion date: 2003-10-31.
Top industries in this zip code by the number of employees in 2005:
Administrative and Support and Waste Management and Remediation Services: Janitorial Services (10-19 employees: 1 establishment)
Other Services (except Public Administration): Professional Organizations (1-4: 1)
Other Services (except Public Administration): Religious Organizations (1-4: 1)
Fatal accident statistics in 2014:
Fatal accident count: 1
Vehicles involved in fatal accidents: 1
Fatal accidents caused by drunken drivers: 0
Fatalities: 1
Persons involved in fatal accidents: 1
Pedestrians involved in fatal accidents: 0
2002 - 2018 National Fire Incident Reporting System (NFIRS) incidents
According to the data from the years 2002 - 2018 the average number of fires per year is 12. The highest number of fire incidents - 31 took place in 2004, and the least - 0 in 2017. The data has a dropping trend.
When looking into fire subcategories, the most reports belonged to: Structure Fires (47.7%), and Outside Fires (44.2%).
Fire incident types reported to NFIRS in Zip Code 47393


+$633
-$2,212
(% of AGI for various income ranges: -47.2% for AGIs below $10k, 8.0% for AGIs $10k-25k, 1.2% for AGIs $25k-50k, -0.9% for AGIs $50k-75k) Nearest zip codes: 47339, 47345, 47355, 47341, 47358, 47346.


 According to the data from the years 2002 - 2018 the average number of fires per year is 12. The highest number of fire incidents - 31 took place in 2004, and the least - 0 in 2017. The data has a dropping trend.
 When looking into fire subcategories, the most reports belonged to: Structure Fires (47.7%), and Outside Fires (44.2%).