Estimated zip code population in 2022: 1,198 Zip code population in 2010: 1,231 Zip code population in 2000: 1,278
Houses and condos: 608 Renter-occupied apartments: 49
% of renters here:
8%
State:
29%
March 2022 cost of living index in zip code 47386: 82.6 (low, U.S. average is 100)
Land area: 17.8 sq. mi. Water area: 0.1 sq. mi.
Population density: 67 people per square mile
(very low).
OSM Map
General Map
Google Map
MSN Map
OSM Map
General Map
Google Map
MSN Map
OSM Map
General Map
Google Map
MSN Map
OSM Map
General Map
Google Map
MSN Map
Please wait while loading the map...
Real estate property taxes paid for housing units in 2022:
This zip code:
0.7% ($1,172)
Indiana:
0.7% ($1,467)
Median real estate property taxes paid for housing units with mortgages in 2022: $1,354 (0.7%) Median real estate property taxes paid for housing units with no mortgage in 2022: $1,073 (0.8%)
Business Search- 14 Million verified businesses
Males: 534
(44.6%)
Females: 664
(55.4%)
For population 25 years and over in 47386:
High school or higher: 87.5%
Bachelor's degree or higher: 27.6%
Graduate or professional degree: 16.7%
Mean travel time to work (commute): 35.5 minutes
For population 15 years and over in 47386:
Never married: 18.1%
Now married: 54.5%
Separated: 0.3%
Widowed: 16.4%
Divorced: 10.7%
Zip code 47386 compared to state average:
Unemployed percentage significantly below state average.
Black race population percentage significantly below state average.
Hispanic race population percentage significantly below state average.
Median age significantly above state average.
Foreign-born population percentage significantly below state average.
Renting percentage significantly below state average.
Length of stay since moving in significantly above state average.
Estimated median house/condo value in 2022: $170,620
47386:
$170,620
Indiana:
$208,700
Median resident age:
This zip code:
60.8 years
Indiana median age:
38.2 years
Average household size:
This zip code:
2.0 people
Indiana:
2.4 people
Averages for the 2020 tax year for zip code 47386, filed in 2021:
Average Adjusted Gross Income (AGI) in 2020: $58,645 (Individual Income Tax Returns)
Here:
$58,645
State:
$64,978
Salary/wage: $54,180 (reported on 75.9% of returns)
Here:
$54,180
State:
$55,245
(% of AGI for various income ranges: 927.5% for AGIs below $25k, 2999.2% for AGIs $25k-50k, 6814.3% for AGIs $50k-75k, 7762.0% for AGIs $75k-100k, 17460.0% for AGIs $100k-200k)
Taxable interest for individuals: $425 (reported on 27.6% of returns)
This zip code:
$425
Indiana:
$1,351
(% of AGI for various income ranges: 16.7% for AGIs below $25k, 9.2% for AGIs $25k-50k, 35.7% for AGIs $50k-75k, 20.0% for AGIs $100k-200k)
Ordinary dividends: $1,100 (reported on 17.2% of returns)
Here:
$1,100
State:
$5,827
(% of AGI for various income ranges: 19.2% for AGIs below $25k, 92.9% for AGIs $50k-75k, 36.7% for AGIs $100k-200k)
Net capital gain/loss in AGI: +$2,557 (reported on 12.1% of returns)
Here:
+$2,557
State:
+$17,730
(% of AGI for various income ranges: 45.8% for AGIs $25k-50k, 206.7% for AGIs $100k-200k)
Profit/loss from business: +$5,114 (reported on 12.1% of returns)
Here:
+$5,114
State:
+$12,144
(% of AGI for various income ranges: 145.0% for AGIs $25k-50k, 368.0% for AGIs $75k-100k)
Taxable individual retirement arrangement distribution: $15,900 (reported on 12.1% of returns)
47386:
$15,900
Indiana:
$18,302
(% of AGI for various income ranges: 284.2% for AGIs $25k-50k, 1544.0% for AGIs $75k-100k)
Earned income credit: $1,733 (reported on 10.3% of returns)
Here:
$1,733
State:
$2,298
(% of AGI for various income ranges: 39.2% for AGIs below $25k, 47.5% for AGIs $25k-50k)
Percentage of individuals using paid preparers for their 2020 taxes: 91.4%
Here:
91%
State:
94%
(% for various income ranges: 88.9% for AGIs below $25k, 92.9% for AGIs $25k-50k, 100.0% for AGIs $50k-75k, 85.7% for AGIs $75k-100k, 90.0% for AGIs $100k-200k)
Averages for the 2012 tax year for zip code 47386, filed in 2013:
Average Adjusted Gross Income (AGI) in 2012: $46,296 (Individual Income Tax Returns)
Here:
$46,296
State:
$52,932
Salary/wage: $37,921 (reported on 82.5% of returns)
Here:
$37,921
State:
$45,173
(% of AGI for various income ranges: 55.8% for AGIs below $25k, 66.0% for AGIs $25k-50k, 72.4% for AGIs $50k-75k, 75.8% for AGIs $75k-100k, 63.8% for AGIs $100k-200k)
Taxable interest for individuals: $470 (reported on 35.1% of returns)
This zip code:
$470
Indiana:
$1,311
(% of AGI for various income ranges: 0.8% for AGIs below $25k, 0.2% for AGIs $25k-50k, 0.5% for AGIs $50k-75k, 0.3% for AGIs $100k-200k)
Ordinary dividends: $1,112 (reported on 14.0% of returns)
Here:
$1,112
State:
$4,690
(% of AGI for various income ranges: 0.4% for AGIs below $25k, 0.6% for AGIs $50k-75k, 0.9% for AGIs $75k-100k)
Profit/loss from business: +$6,786 (reported on 12.3% of returns)
Here:
+$6,786
State:
+$11,105
Taxable individual retirement arrangement distribution: $11,050 (reported on 10.5% of returns)
47386:
$11,050
Indiana:
$13,841
Total itemized deductions: $16,627 (18% of AGI, reported on 19.3% of returns)
Here:
$16,627
State:
$20,913
Here:
17.8% of AGI
State:
18.2% of AGI
(% of AGI for various income ranges: 12.1% for AGIs below $25k, 5.4% for AGIs $50k-75k, 7.5% for AGIs $75k-100k, 10.2% for AGIs $100k-200k)
Charity contributions: $3,538 (reported on 14.0% of returns)
Here:
$3,538
State:
$4,697
Taxes paid: $6,118 (reported on 19.3% of returns)
47386:
$6,118
State:
$7,456
(% of AGI for various income ranges: 2.4% for AGIs below $25k, 1.5% for AGIs $50k-75k, 2.8% for AGIs $75k-100k, 4.8% for AGIs $100k-200k)
Earned income credit: $1,789 (reported on 15.8% of returns)
Here:
$1,789
State:
$2,265
(% of AGI for various income ranges: 4.3% for AGIs below $25k, 0.9% for AGIs $25k-50k)
Percentage of individuals using paid preparers for their 2012 taxes: 59.6%
Here:
60%
State:
53%
(% for various income ranges: 52.2% for AGIs below $25k, 61.5% for AGIs $25k-50k, 60.0% for AGIs $50k-75k, 66.7% for AGIs $75k-100k, 80.0% for AGIs $100k-200k)
Averages for the 2004 tax year for zip code 47386, filed in 2005:
Average Adjusted Gross Income (AGI) in 2004: $45,988 (Individual Income Tax Returns)
Here:
$45,988
State:
$44,790
Salary/wage: $40,855 (reported on 85.9% of returns)
Here:
$40,855
State:
$39,615
(% of AGI for various income ranges: 67.6% for AGIs below $10k, 60.1% for AGIs $10k-25k, 70.0% for AGIs $25k-50k, 84.2% for AGIs $50k-75k, 79.7% for AGIs $75k-100k, 77.0% for AGIs over 100k)
Taxable interest for individuals: $845 (reported on 53.9% of returns)
This zip code:
$845
Indiana:
$1,535
(% of AGI for various income ranges: 3.7% for AGIs below $10k, 3.0% for AGIs $10k-25k, 1.1% for AGIs $25k-50k, 0.7% for AGIs $50k-75k, 1.0% for AGIs $75k-100k, 0.4% for AGIs over 100k)
Taxable dividends: $609 (reported on 19.6% of returns)
Here:
$609
State:
$2,998
(% of AGI for various income ranges: 0.5% for AGIs $10k-25k, 0.5% for AGIs $25k-50k, 0.2% for AGIs $50k-75k, 0.3% for AGIs $75k-100k, 0.1% for AGIs over 100k)
Net capital gain/loss: +$3,636 (reported on 11.2% of returns)
Here:
+$3,636
State:
+$8,619
(% of AGI for various income ranges: -0.9% for AGIs below $10k, 2.8% for AGIs $25k-50k, 0.9% for AGIs $50k-75k, 0.5% for AGIs $75k-100k)
Profit/loss from business: +$5,146 (reported on 13.9% of returns)
Here:
+$5,146
State:
+$10,071
(% of AGI for various income ranges: -0.5% for AGIs below $10k, 6.8% for AGIs $10k-25k, 2.2% for AGIs $25k-50k, 1.5% for AGIs $50k-75k, 1.2% for AGIs $75k-100k)
Total itemized deductions: $15,609 (19% of AGI, reported on 29.6% of returns)
Here:
$15,609
State:
$17,065
Here:
18.6% of AGI
State:
19.5% of AGI
(% of AGI for various income ranges: 10.6% for AGIs $25k-50k, 9.6% for AGIs $50k-75k, 13.2% for AGIs $75k-100k, 11.1% for AGIs over 100k)
Charity contributions deductions: $2,736 (3% of AGI, reported on 21.3% of returns)
Here:
$2,736
State:
$3,550
Here:
3.0% of AGI
State:
3.8% of AGI
(% of AGI for various income ranges: 1.2% for AGIs $25k-50k, 1.0% for AGIs $50k-75k, 2.4% for AGIs $75k-100k, 1.1% for AGIs over 100k)
Total tax: $6,112 (reported on 81.6% of returns)
47386:
$6,112
State:
$6,914
(% of AGI for various income ranges: 3.0% for AGIs below $10k, 4.7% for AGIs $10k-25k, 6.7% for AGIs $25k-50k, 8.1% for AGIs $50k-75k, 10.4% for AGIs $75k-100k, 19.4% for AGIs over 100k)
Earned income credit: $1,441 (reported on 10.0% of returns)
Here:
$1,441
State:
$1,685
Percentage of individuals using paid preparers for their 2004 taxes: 59.7%
Here:
60%
State:
59%
(% for various income ranges: 47.1% for AGIs below $10k, 66.4% for AGIs $10k-25k, 66.0% for AGIs $25k-50k, 61.2% for AGIs $50k-75k, 53.8% for AGIs $75k-100k, 53.7% for AGIs over 100k)
Likely homosexual households (counted as self-reported same-sex unmarried-partner households)
Lesbian couples: 0.0% of all households
Gay men: 0.3% of all households
Household received Food Stamps/SNAP in the past 12 months: 4 Household did not receive Food Stamps/SNAP in the past 12 months: 590
Women who had a birth in the past 12 months: 3 (0 now married, 2 unmarried) Women who did not have a birth in the past 12 months: 128 (70 now married, 57 unmarried)
Housing units in zip code 47386 with a mortgage: 205 (16 second mortgage, 14 both second mortgage and home equity loan) Houses without a mortgage: 29
Median monthly owner costs for units with a mortgage: $1,088 Median monthly owner costs for units without a mortgage: $349
Residents with income below the poverty level in 2022:
This zip code:
6.9%
Whole state:
12.6%
Residents with income below 50% of the poverty level in 2022:
This zip code:
6.7%
Whole state:
6.3%
Median number of rooms in houses and condos:
Here:
6.2
State:
6.6
Median number of rooms in apartments:
Here:
6.0
State:
4.3
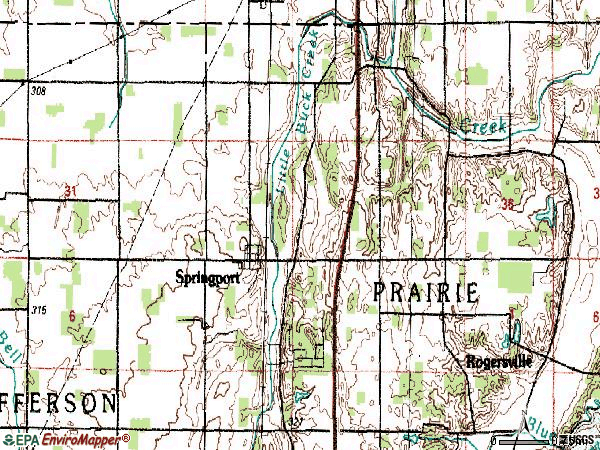
Notable locations in this zip code not listed on our city pages
Streams, rivers, and creeks: Port Run (A), Spring Run (B), Hillside Brook (C), Chief Run (D), Moon Brook (E), Brave Run (F). Display/hide their locations on the map
Size of family households: 192 2-persons, 72 3-persons, 53 4-persons, 6 5-persons
Size of nonfamily households: 242 1-person, 28 2-persons
100 married couples with children.
16 single-parent households (16 women).
99.7% of residents of 47386 zip code speak English at home.
1.3% of residents speak Spanish at home (100% very well).
Foreign born population: 2 (0.2%) (100.0% of them are naturalized citizens)
This zip code:
0.2%
Whole state:
6.1%
50%Japan
39%German
21%English
19%American
3%Irish
2%Swedish
2%Dutch
1%Welsh
Year of entry for the foreign-born population
02010 or later
22000 to 2009
01990 to 1999
0Before 1990
Facilities with environmental interests located in this zip code:
IRVING MATERIALS INCORPORATED (1078 EAST LURAY in SPRINGPORT, IN)
AIR MINOR (AIRS/AFS) STATE MASTER (Indiana facility tracking) - ACES-OP-06500021, AIR PROGRAM STATE MASTER (Indiana facility tracking) CRITERIA AND HAZARDOUS AIR POLLUTANT INVENTORY (Inventory of air pollution sources) Business SIC and NAICS classification: CONSTRUCTION SAND AND GRAVEL
Housing units lacking complete plumbing facilities: 0.7%
45.8%Electricity
31.1%Utility gas
20.6%Bottled, tank, or LP gas
1.4%Wood
1.0%Fuel oil, kerosene, etc.
Population in 1990: 3,393.
Place of birth for U.S.-born residents:
This state: 1,058
Midwest: 57
South: 58
West: 10
78% of the 47386 zip code residents lived in the same house 5 years ago. Out of people who lived in different houses, 58% lived in this county. Out of people who lived in different counties, 50% lived in Indiana.
97% of the 47386 zip code residents lived in the same house 1 year ago. Out of people who lived in different houses, 123% moved from different county within same state.
Private vs. public school enrollment:
Students in private schools in grades 1 to 8 (elementary and middle school): 28
Here:
31.3%
Indiana:
14.9%
Students in private schools in grades 9 to 12 (high school):
Here:
0.0%
Indiana:
11.4%
Students in private undergraduate colleges:
Here:
0.0%
Indiana:
22.3%
Occupation by median earnings in the past 12 months ($)
73,332Business and financial operations occupations
65,007Construction and extraction occupations
59,154Office and administrative support occupations
56,904Education, training, and library occupations
51,664Building and grounds cleaning and maintenance occupations
48,887Production occupations
Top industries in this zip code by the number of employees in 2005:
Mining: Construction Sand and Gravel Mining (10-19 employees: 1 establishment)
Construction: Site Preparation Contractors (5-9: 1)
Information: Data Processing, Hosting, and Related Services (1-4: 1)
Professional, Scientific, and Technical Services: All Other Professional, Scientific, and Technical Services (1-4: 1)
Professional, Scientific, and Technical Services: Engineering Services (1-4: 1)
Most common first names in zip code 47386 among deceased individuals
Name
Count
Lived (average)
Mary
8
78.9 years
Robert
7
78.6 years
John
5
75.8 years
Ruth
5
72.4 years
Charles
4
71.5 years
James
4
78.0 years
William
4
76.0 years
Ada
3
79.3 years
George
3
73.7 years
Gerald
3
72.6 years
Most common last names in zip code 47386 among deceased individuals
Last name
Count
Lived (average)
Bunner
9
78.2 years
Smith
7
57.9 years
Martin
6
70.5 years
Painter
6
84.7 years
Livezey
4
81.0 years
Chambers
4
80.7 years
Cox
4
80.5 years
Abrell
3
64.0 years
Baty
3
81.0 years
Beall
3
73.0 years
Discuss Springport, Indiana (IN) on our hugely popular Indiana forum.


 Nearest zip codes: 47367, 47361, 47302, 47388, 47356, 47362.