Estimated zip code population in 2022: 15,703 Zip code population in 2010: 15,014 Zip code population in 2000: 14,808
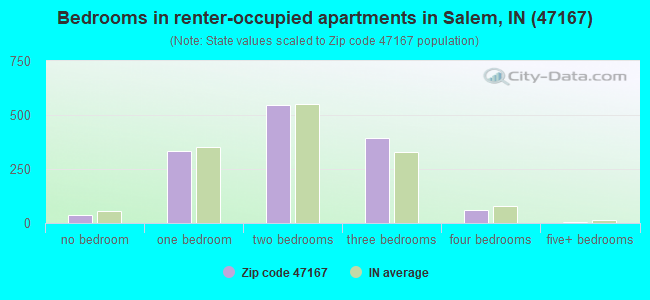
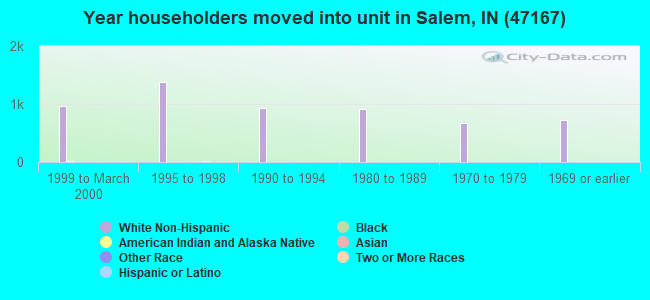
Houses and condos: 6,637 Renter-occupied apartments: 1,372
% of renters here:
22%
State:
29%
March 2022 cost of living index in zip code 47167: 85.1 (less than average, U.S. average is 100)
Land area: 213.4 sq. mi. Water area: 1.4 sq. mi.
Population density: 74 people per square mile
(very low).
OSM Map
General Map
Google Map
MSN Map
OSM Map
General Map
Google Map
MSN Map
OSM Map
General Map
Google Map
MSN Map
OSM Map
General Map
Google Map
MSN Map
Please wait while loading the map...
Real estate property taxes paid for housing units in 2022:
This zip code:
0.5% ($956)
Indiana:
0.7% ($1,467)
Median real estate property taxes paid for housing units with mortgages in 2022: $1,100 (0.6%) Median real estate property taxes paid for housing units with no mortgage in 2022: $718 (0.5%)
Averages for the 2020 tax year for zip code 47167, filed in 2021:
Average Adjusted Gross Income (AGI) in 2020: $48,900 (Individual Income Tax Returns)
Here:
$48,900
State:
$64,978
Salary/wage: $44,468 (reported on 81.4% of returns)
Here:
$44,468
State:
$55,245
(% of AGI for various income ranges: 1182.5% for AGIs below $25k, 3673.2% for AGIs $25k-50k, 6144.8% for AGIs $50k-75k, 9331.6% for AGIs $75k-100k, 16976.5% for AGIs $100k-200k, 57050.0% for AGIs over 200k)
Taxable interest for individuals: $1,015 (reported on 21.9% of returns)
This zip code:
$1,015
Indiana:
$1,351
(% of AGI for various income ranges: 19.3% for AGIs below $25k, 17.1% for AGIs $25k-50k, 28.0% for AGIs $50k-75k, 59.4% for AGIs $75k-100k, 81.0% for AGIs $100k-200k, 406.7% for AGIs over 200k)
Ordinary dividends: $4,533 (reported on 12.6% of returns)
Here:
$4,533
State:
$5,827
(% of AGI for various income ranges: 28.7% for AGIs below $25k, 32.9% for AGIs $25k-50k, 44.8% for AGIs $50k-75k, 77.0% for AGIs $75k-100k, 242.8% for AGIs $100k-200k, 4490.0% for AGIs over 200k)
Net capital gain/loss in AGI: +$8,748 (reported on 11.6% of returns)
Here:
+$8,748
State:
+$17,730
(% of AGI for various income ranges: 16.0% for AGIs below $25k, 47.1% for AGIs $25k-50k, 72.3% for AGIs $50k-75k, 146.2% for AGIs $75k-100k, 572.0% for AGIs $100k-200k, 9000.0% for AGIs over 200k)
Profit/loss from business: +$14,176 (reported on 13.0% of returns)
Here:
+$14,176
State:
+$12,144
(% of AGI for various income ranges: 131.4% for AGIs below $25k, 200.8% for AGIs $25k-50k, 266.0% for AGIs $50k-75k, 168.6% for AGIs $75k-100k, 504.0% for AGIs $100k-200k, 8916.7% for AGIs over 200k)
Taxable individual retirement arrangement distribution: $12,897 (reported on 8.2% of returns)
47167:
$12,897
Indiana:
$18,302
(% of AGI for various income ranges: 59.7% for AGIs below $25k, 72.5% for AGIs $25k-50k, 171.9% for AGIs $50k-75k, 262.2% for AGIs $75k-100k, 659.5% for AGIs $100k-200k)
Total itemized deductions: $33,178 (reported on 2.5% of returns)
Here:
$33,178
State:
$35,601
(% of AGI for various income ranges: 45.9% for AGIs below $25k, 80.0% for AGIs $50k-75k, 160.8% for AGIs $75k-100k, 413.2% for AGIs $100k-200k, 6666.7% for AGIs over 200k)
Charity contributions: $14,315 (reported on 1.8% of returns)
Here:
$14,315
State:
$15,596
(% of AGI for various income ranges: 16.4% for AGIs $25k-50k, 47.8% for AGIs $75k-100k, 155.5% for AGIs $100k-200k, 2476.7% for AGIs over 200k)
Taxes paid: $6,783 (reported on 2.5% of returns)
47167:
$6,783
State:
$7,542
(% of AGI for various income ranges: 4.5% for AGIs below $25k, 15.9% for AGIs $50k-75k, 41.8% for AGIs $75k-100k, 121.5% for AGIs $100k-200k, 1040.0% for AGIs over 200k)
Earned income credit: $2,163 (reported on 18.8% of returns)
Here:
$2,163
State:
$2,298
(% of AGI for various income ranges: 98.5% for AGIs below $25k, 67.7% for AGIs $25k-50k, 2.2% for AGIs $50k-75k)
Percentage of individuals using paid preparers for their 2020 taxes: 95.0%
Here:
95%
State:
94%
(% for various income ranges: 93.7% for AGIs below $25k, 95.5% for AGIs $25k-50k, 96.2% for AGIs $50k-75k, 95.7% for AGIs $75k-100k, 97.1% for AGIs $100k-200k, 90.0% for AGIs over 200k)
Averages for the 2012 tax year for zip code 47167, filed in 2013:
Average Adjusted Gross Income (AGI) in 2012: $41,001 (Individual Income Tax Returns)
Here:
$41,001
State:
$52,932
Salary/wage: $36,674 (reported on 83.6% of returns)
Here:
$36,674
State:
$45,173
(% of AGI for various income ranges: 71.9% for AGIs below $25k, 81.7% for AGIs $25k-50k, 81.4% for AGIs $50k-75k, 80.8% for AGIs $75k-100k, 71.1% for AGIs $100k-200k, 40.1% for AGIs over 200k)
Taxable interest for individuals: $1,299 (reported on 25.6% of returns)
This zip code:
$1,299
Indiana:
$1,311
(% of AGI for various income ranges: 1.9% for AGIs below $25k, 0.5% for AGIs $25k-50k, 0.6% for AGIs $50k-75k, 0.6% for AGIs $75k-100k, 0.9% for AGIs $100k-200k, 0.6% for AGIs over 200k)
Ordinary dividends: $2,616 (reported on 14.2% of returns)
Here:
$2,616
State:
$4,690
(% of AGI for various income ranges: 1.3% for AGIs below $25k, 0.4% for AGIs $25k-50k, 0.6% for AGIs $50k-75k, 0.7% for AGIs $75k-100k, 2.0% for AGIs $100k-200k, 0.8% for AGIs over 200k)
Net capital gain/loss in AGI: +$6,527 (reported on 11.8% of returns)
Here:
+$6,527
State:
+$10,406
(% of AGI for various income ranges: 0.6% for AGIs below $25k, 0.9% for AGIs $25k-50k, 0.9% for AGIs $50k-75k, 1.1% for AGIs $75k-100k, 3.9% for AGIs $100k-200k, 6.1% for AGIs over 200k)
Profit/loss from business: +$9,446 (reported on 13.7% of returns)
Here:
+$9,446
State:
+$11,105
(% of AGI for various income ranges: 7.4% for AGIs below $25k, 2.3% for AGIs $25k-50k, 2.4% for AGIs $50k-75k, 1.6% for AGIs $75k-100k, 2.0% for AGIs $100k-200k, 6.1% for AGIs over 200k)
Taxable individual retirement arrangement distribution: $10,358 (reported on 9.8% of returns)
47167:
$10,358
Indiana:
$13,841
(% of AGI for various income ranges: 3.4% for AGIs below $25k, 2.4% for AGIs $25k-50k, 2.0% for AGIs $50k-75k, 2.3% for AGIs $75k-100k, 3.9% for AGIs $100k-200k)
Total itemized deductions: $18,492 (21% of AGI, reported on 16.7% of returns)
Here:
$18,492
State:
$20,913
Here:
20.8% of AGI
State:
18.2% of AGI
(% of AGI for various income ranges: 5.0% for AGIs below $25k, 5.3% for AGIs $25k-50k, 5.7% for AGIs $50k-75k, 9.0% for AGIs $75k-100k, 11.4% for AGIs $100k-200k, 11.9% for AGIs over 200k)
Charity contributions: $4,015 (reported on 11.8% of returns)
Here:
$4,015
State:
$4,697
(% of AGI for various income ranges: 0.5% for AGIs below $25k, 0.6% for AGIs $25k-50k, 0.7% for AGIs $50k-75k, 1.4% for AGIs $75k-100k, 2.1% for AGIs $100k-200k, 2.5% for AGIs over 200k)
Taxes paid: $5,890 (reported on 16.6% of returns)
47167:
$5,890
State:
$7,456
(% of AGI for various income ranges: 0.7% for AGIs below $25k, 1.1% for AGIs $25k-50k, 1.6% for AGIs $50k-75k, 3.0% for AGIs $75k-100k, 4.4% for AGIs $100k-200k, 5.5% for AGIs over 200k)
Earned income credit: $2,131 (reported on 22.2% of returns)
Here:
$2,131
State:
$2,265
(% of AGI for various income ranges: 6.4% for AGIs below $25k, 1.3% for AGIs $25k-50k)
Percentage of individuals using paid preparers for their 2012 taxes: 66.4%
Here:
66%
State:
53%
(% for various income ranges: 66.1% for AGIs below $25k, 65.2% for AGIs $25k-50k, 65.7% for AGIs $50k-75k, 68.8% for AGIs $75k-100k, 70.3% for AGIs $100k-200k, 83.3% for AGIs over 200k)
Averages for the 2004 tax year for zip code 47167, filed in 2005:
Average Adjusted Gross Income (AGI) in 2004: $34,234 (Individual Income Tax Returns)
Here:
$34,234
State:
$44,790
Salary/wage: $31,825 (reported on 85.1% of returns)
Here:
$31,825
State:
$39,615
(% of AGI for various income ranges: 117.7% for AGIs below $10k, 77.3% for AGIs $10k-25k, 83.8% for AGIs $25k-50k, 84.7% for AGIs $50k-75k, 83.0% for AGIs $75k-100k, 55.0% for AGIs over 100k)
Taxable interest for individuals: $1,739 (reported on 39.0% of returns)
This zip code:
$1,739
Indiana:
$1,535
(% of AGI for various income ranges: 9.9% for AGIs below $10k, 3.0% for AGIs $10k-25k, 1.6% for AGIs $25k-50k, 1.2% for AGIs $50k-75k, 1.6% for AGIs $75k-100k, 2.5% for AGIs over 100k)
Taxable dividends: $1,294 (reported on 16.8% of returns)
Here:
$1,294
State:
$2,998
(% of AGI for various income ranges: 3.2% for AGIs below $10k, 0.7% for AGIs $10k-25k, 0.4% for AGIs $25k-50k, 0.3% for AGIs $50k-75k, 0.4% for AGIs $75k-100k, 1.3% for AGIs over 100k)
Net capital gain/loss: +$6,978 (reported on 13.2% of returns)
Here:
+$6,978
State:
+$8,619
(% of AGI for various income ranges: -3.6% for AGIs below $10k, 0.9% for AGIs $10k-25k, 1.1% for AGIs $25k-50k, 1.4% for AGIs $50k-75k, 2.1% for AGIs $75k-100k, 10.5% for AGIs over 100k)
Profit/loss from business: +$8,859 (reported on 15.0% of returns)
Here:
+$8,859
State:
+$10,071
(% of AGI for various income ranges: 15.5% for AGIs below $10k, 5.0% for AGIs $10k-25k, 3.4% for AGIs $25k-50k, 2.2% for AGIs $50k-75k, 1.7% for AGIs $75k-100k, 6.8% for AGIs over 100k)
IRA payment deduction: $2,919 (reported on 2.4% of returns)
47167:
$2,919
Indiana:
$2,840
(% of AGI for various income ranges: 0.3% for AGIs $10k-25k, 0.2% for AGIs $25k-50k, 0.2% for AGIs $50k-75k, 0.2% for AGIs $75k-100k, 0.2% for AGIs over 100k)
Self-employed pension: $13,286 (reported on 0.2% of returns)
Here:
$13,286
Indiana:
$15,305
Total itemized deductions: $14,566 (23% of AGI, reported on 20.4% of returns)
Here:
$14,566
State:
$17,065
Here:
22.5% of AGI
State:
19.5% of AGI
(% of AGI for various income ranges: 8.2% for AGIs below $10k, 5.0% for AGIs $10k-25k, 7.5% for AGIs $25k-50k, 9.6% for AGIs $50k-75k, 12.2% for AGIs $75k-100k, 10.3% for AGIs over 100k)
Charity contributions deductions: $3,058 (4% of AGI, reported on 14.7% of returns)
Here:
$3,058
State:
$3,550
Here:
4.3% of AGI
State:
3.8% of AGI
(% of AGI for various income ranges: 0.5% for AGIs below $10k, 0.7% for AGIs $10k-25k, 0.8% for AGIs $25k-50k, 1.4% for AGIs $50k-75k, 1.6% for AGIs $75k-100k, 2.6% for AGIs over 100k)
Total tax: $4,142 (reported on 73.0% of returns)
47167:
$4,142
State:
$6,914
(% of AGI for various income ranges: 3.5% for AGIs below $10k, 4.1% for AGIs $10k-25k, 6.4% for AGIs $25k-50k, 8.3% for AGIs $50k-75k, 10.3% for AGIs $75k-100k, 18.3% for AGIs over 100k)
Earned income credit: $1,492 (reported on 18.4% of returns)
Here:
$1,492
State:
$1,685
Percentage of individuals using paid preparers for their 2004 taxes: 69.4%
Here:
69%
State:
59%
(% for various income ranges: 64.9% for AGIs below $10k, 69.6% for AGIs $10k-25k, 70.9% for AGIs $25k-50k, 70.7% for AGIs $50k-75k, 69.4% for AGIs $75k-100k, 75.2% for AGIs over 100k)
Likely homosexual households (counted as self-reported same-sex unmarried-partner households)
Lesbian couples: 0.2% of all households
Gay men: 0.0% of all households
Household received Food Stamps/SNAP in the past 12 months: 743 Household did not receive Food Stamps/SNAP in the past 12 months: 5,491
Women who had a birth in the past 12 months: 260 (163 now married, 92 unmarried) Women who did not have a birth in the past 12 months: 3,147 (1,334 now married, 1,812 unmarried)
Housing units in zip code 47167 with a mortgage: 2,863 (228 second mortgage, 179 both second mortgage and home equity loan) Houses without a mortgage: 72
Median monthly owner costs for units with a mortgage: $1,141 Median monthly owner costs for units without a mortgage: $411
Residents with income below the poverty level in 2022:
This zip code:
15.3%
Whole state:
12.6%
Residents with income below 50% of the poverty level in 2022:
This zip code:
10.7%
Whole state:
6.3%
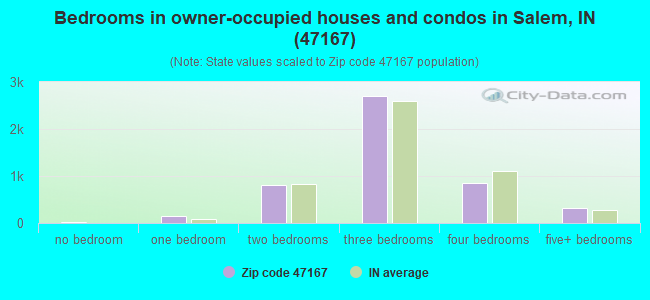
Median number of rooms in houses and condos:
Here:
6.5
State:
6.6
Median number of rooms in apartments:
Here:
4.7
State:
4.3
Notable locations in this zip code not listed on our city pages
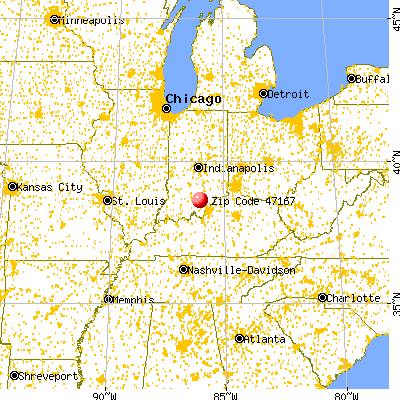
Notable locations in zip code 47167: Stone Poultry Farms (A), Henry Poultry Farms (B), Washington County Landfill (C), Salem Speedway (D), Salem Fire Department (E). Display/hide their locations on the map
Churches in zip code 47167 include: Fort Hill Church (A), Franklin Church (B), Blue River Church (C), Old Blue River Friends Church (D), Blue River Quaker Church (E), Highland Friends Church (F), Bunker Hill Church (G), Kansas Church (H), Conoway Church (I). Display/hide their locations on the map
Cemeteries: McKnight Cemetery (1), Becks Cemetery (2), Blue River Hicksite Cemetery (3), Blue River Quaker Orthodox Cemetery (4), Stalker Cemetery (5), Norris Cemetery (6), Coggswell Cemetery (7). Display/hide their locations on the map
Streams, rivers, and creeks: Lick Creek (A), West Fork Blue River (B), Rinkers Creek (C), Hoggatt Branch (D), Goose Creek (E), Mill Creek (F), Lockwood Branch (G). Display/hide their locations on the map
Parks in zip code 47167 include: Rotary Springs Camp (1), Elk Creek Public Fishing Area (2), Wonder Valley Camp (3). Display/hide their locations on the map
2,144 married couples with children.
946 single-parent households (153 men, 793 women).
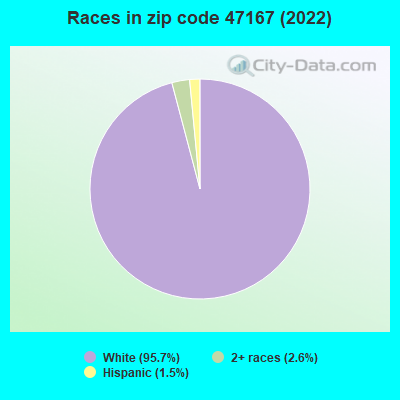
97.1% of residents of 47167 zip code speak English at home.
1.4% of residents speak Spanish at home (71% very well, 21% well, 8% not well).
1.1% of residents speak other Indo-European language at home (63% very well, 32% well, 6% not well).
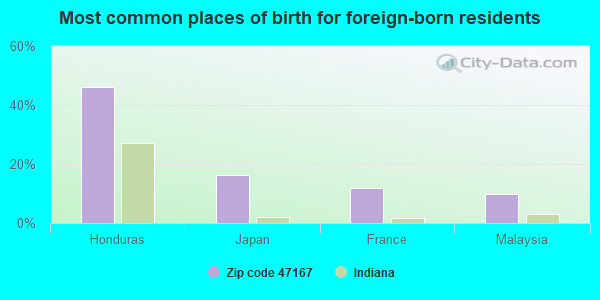
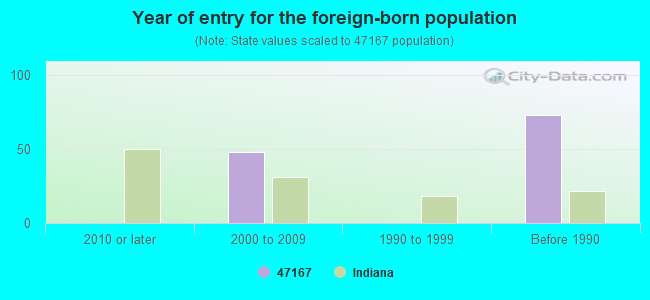
Foreign born population: 94 (0.6%) (64.7% of them are naturalized citizens)
This zip code:
0.6%
Whole state:
6.1%
46%Honduras
16%Japan
12%France
10%Malaysia
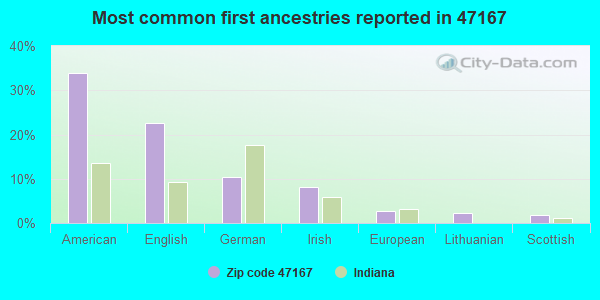
34%American
23%English
10%German
8%Irish
3%European
2%Lithuanian
2%Scottish
Year of entry for the foreign-born population
02010 or later
482000 to 2009
01990 to 1999
73Before 1990
Major facilities with environmental interests located in this zip code:
SALEM WATER WORKS (38 PUBLIC SQUARE in SALEM, IN)
(Integrated Compliance Information System) - ICIS-05-1998-0721, FORMAL ENFORCEMENT ACTION (Integrated Compliance Information System) - ICIS-05-1998-4152, FORMAL ENFORCEMENT ACTION STATE MASTER (Indiana facility tracking) COMMUNITY WATER SYSTEM (SDWIS) - SDWIS-IN5288005 17677, WATER TREATMENT PLANT, SDWIS-IN5288005 7622, Business SIC classification: WATER SUPPLY
HANSON AGGREGATES MIDWEST INC (1510 W MARKET ST in SALEM, IN)
AIR MINOR (AIRS/AFS) STATE MASTER (Indiana facility tracking) - ACES-OP-17500002, AIR PROGRAM, ACES-OP-17500004, UST-4974, UNDERGROUND STORAGE TANK PROGRAM National Pollutant Discharge Elimination System NON-MAJOR (Tracking pollutant discharge elimination systems) - permit Business SIC classification: CRUSHED AND BROKEN LIMESTONE; CUT STONE AND STONE PRODUCTS Organizations: JAMES R SMITH CERT 11597 (CONTACT/OPERATOR)
, HANSON AGGREGATES MIDWEST, INC (CONTACT/OWNER)
Alternative names: HANSON AGGREGATES, SALEM
CHILD CRAFT INDUSTRIES INCORPORATED (501 E. MARKET ST. in SALEM, IN)
AIR MAJOR (AIRS/AFS) STATE MASTER (Indiana facility tracking) - UST-374, UNDERGROUND STORAGE TANK PROGRAM, ACES-OP-17500001, AIR PROGRAM, ACES-OP-17500008, CRTK-7992, EPCRA, SPILL-199004077, RELEASE ASSESSMENT COMPLIANCE ACTIVITY (Tracking inspections of insecticide, fungicide, and rodenticide, and toxic substances) CRITERIA AND HAZARDOUS AIR POLLUTANT INVENTORY (Inventory of air pollution sources) HAZARDOUS WASTE BIENNIAL REPORTER (Resource Conservation and Recovery Act (tracking hazardous waste)) (Resource Conservation and Recovery Act (tracking hazardous waste)) TRI REPORTER (Tracking of toxic chemicals releasing facilities) Business SIC classification: WOOD HOUSEHOLD FURNITURE, EXCEPT UPHOLSTERED; MATTRESSES, FOUNDATIONS, AND CONVERTIBLE BEDS; WOOD TELEVISION, RADIO, PHONOGRAPH, AND SEWING MACHINE CABINETS; WOOD OFFICE FURNITURE Business NAICS classification: NONUPHOLSTERED WOOD HOUSEHOLD FURNITURE MANUFACTURING.; SHOWCASE, PARTITION, SHELVING, AND LOCKER MANUFACTURING. Organizations: WILLIAM S SUVAK (CONTACT/OWNER)
BRAND MARKETING ASHLAND INCORPORATED (403 SOUTH MAIN STREET in SALEM, IN)
AIR SYNTHETIC MINOR (AIRS/AFS) STATE MASTER (Indiana facility tracking) - ACES-OP-17500005, AIR PROGRAM (Resource Conservation and Recovery Act (tracking hazardous waste)) Business SIC classification: WOOD PRODUCTS Organizations: LINK NORMAN (CORP) (CONTACT/OWNER)
Alternative names: LINK OP HANDLE CO INC
A T & T SALEM (BEELINE RD & SR 60 in SALEM, IN)
STATE MASTER (Indiana facility tracking) - CRTK-3944, EPCRA, UST-931, UNDERGROUND STORAGE TANK PROGRAM (Resource Conservation and Recovery Act (tracking hazardous waste)) Alternative names: AT AND T LONG LINES SALEM IND
SALEM WWTP (209 W JOSEPH LN in SALEM, IN)
STATE MASTER (Indiana facility tracking) - CRTK-1272, EPCRA, CRTK-6364, National Pollutant Discharge Elimination System MAJOR (Tracking pollutant discharge elimination systems) - permit Business SIC classification: SEWERAGE SYSTEMS Organizations: TERRY PENNINGTON #5119 (CONTACT/OPERATOR)
, SALEM CITY HALL (CONTACT/OWNER)
Alternative names: SALEM MUNICIPAL SEWER DEPT., SALEM MUNICIPAL STP
BRADIE M SHRUM LOWER ELEM (1103 N SHELBY ST in SALEM, IN)
(National Center for Education Statistics) - STATE ID-8864 Organizations: SALEM COMMUNITY SCHOOLS (SCHOOL DISTRICT)
BRADIE M SHRUM UPPER ELEM (1101 N SHELBY ST in SALEM, IN)
(National Center for Education Statistics) - STATE ID-8859 Organizations: SALEM COMMUNITY SCHOOLS (SCHOOL DISTRICT)
SALEM HIGH SCHOOL (700 N HARRISON ST in SALEM, IN)
(National Center for Education Statistics) - STATE ID-8857 Organizations: SALEM COMMUNITY SCHOOLS (SCHOOL DISTRICT)
SALEM MIDDLE SCHOOL (1001 N HARRISON ST in SALEM, IN)
(National Center for Education Statistics) - STATE ID-8861 Organizations: SALEM COMMUNITY SCHOOLS (SCHOOL DISTRICT)
DELANEY PARK (8215 DELANEY PARK ROAD in SALEM, IN)
STATE MASTER (Indiana facility tracking) National Pollutant Discharge Elimination System NON-MAJOR (Tracking pollutant discharge elimination systems) - permit Business SIC classification: AMUSEMENT AND RECREATION SERVICES Organizations: MELVIN HUNSUCKER 062802 (CONTACT/OPERATOR)
BOBS CLEANERS (108 N WATER in SALEM, IN)
STATE MASTER (Indiana facility tracking) Conditionally Exempt Small Quantity Generators, less than 100 kg/month of hazardous waste (Resource Conservation and Recovery Act (tracking hazardous waste)) - notification Organizations: HARLEN WILLIAM (CONTACT/OWNER)
Housing units lacking complete plumbing facilities: 4.6% Housing units lacking complete kitchen facilities: 4.6%
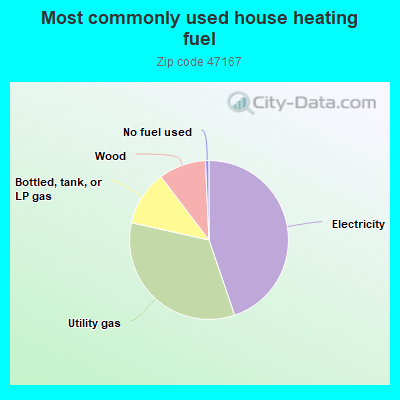
44.6%Electricity
33.6%Utility gas
11.1%Bottled, tank, or LP gas
9.6%Wood
0.7%No fuel used
Population in 1990: 10,949. Population change in the 1990s: +3,859 (+35.2%).
Place of birth for U.S.-born residents:
This state: 10,908
Northeast: 269
Midwest: 885
South: 2,888
West: 480
60% of the 47167 zip code residents lived in the same house 5 years ago. Out of people who lived in different houses, 64% lived in this county. Out of people who lived in different counties, 50% lived in Indiana.
90% of the 47167 zip code residents lived in the same house 1 year ago. Out of people who lived in different houses, 53% moved from this county. Out of people who lived in different houses, 31% moved from different county within same state. Out of people who lived in different houses, 13% moved from different state. Out of people who lived in different houses, 4% moved from abroad.
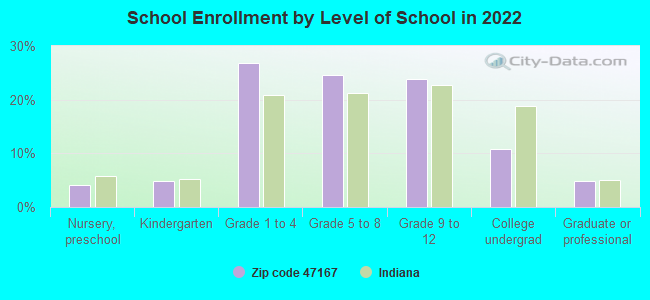
Private vs. public school enrollment:
Students in private schools in grades 1 to 8 (elementary and middle school): 400
Here:
24.6%
Indiana:
14.9%
Students in private schools in grades 9 to 12 (high school): 26
Here:
3.5%
Indiana:
11.4%
Students in private undergraduate colleges: 76
Here:
22.1%
Indiana:
22.3%
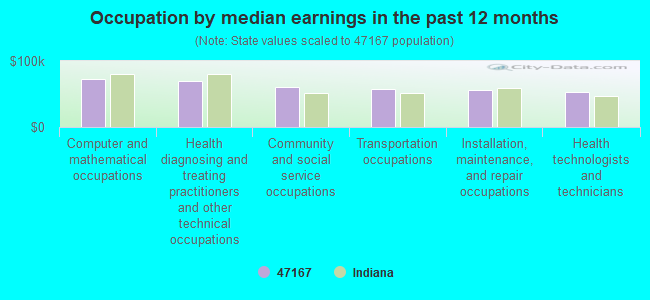
Occupation by median earnings in the past 12 months ($)
72,505Computer and mathematical occupations
69,109Health diagnosing and treating practitioners and other technical occupations
60,650Community and social service occupations
57,010Transportation occupations
56,034Installation, maintenance, and repair occupations
53,738Health technologists and technicians
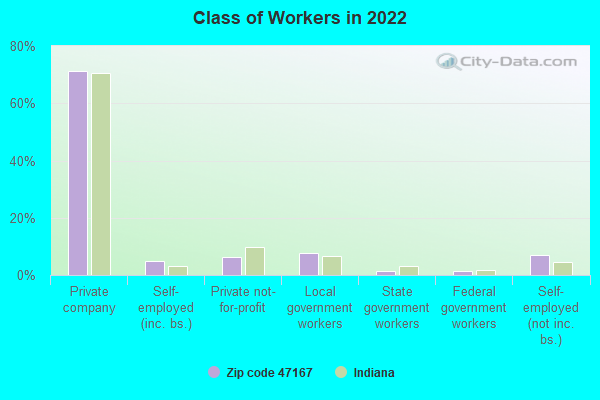
Top industries in this zip code by the number of employees in 2005:
Health Care and Social Assistance: Nursing Care Facilities (100-249: 1)
Health Care and Social Assistance: General Medical and Surgical Hospitals (100-249: 1)
People in group quarters in 2010:
161 people in nursing facilities/skilled-nursing facilities
77 people in local jails and other municipal confinement facilities
14 people in group homes intended for adults
8 people in other noninstitutional facilities
People in group quarters in 2000:
246 people in nursing homes
46 people in local jails and other confinement facilities (including police lockups)
13 people in homes for the mentally ill
12 people in orthopedic wards and institutions for the physically handicapped
10 people in other noninstitutional group quarters
7 people in homes for the physically handicapped
Fatal accident statistics in 2014:
Fatal accident count: 4
Vehicles involved in fatal accidents: 5
Fatal accidents caused by drunken drivers: 1
Fatalities: 5
Persons involved in fatal accidents: 7
Pedestrians involved in fatal accidents: 0
Fatal accident statistics in 2013:
Fatal accident count: 1
Vehicles involved in fatal accidents: 1
Fatal accidents caused by drunken drivers: 0
Fatalities: 1
Persons involved in fatal accidents: 1
Pedestrians involved in fatal accidents: 0
2003 - 2018 National Fire Incident Reporting System (NFIRS) incidents
Based on the data from the years 2003 - 2018 the average number of fires per year is 43. The highest number of fire incidents - 87 took place in 2010, and the least - 0 in 2013. The data has a growing trend.
When looking into fire subcategories, the most reports belonged to: Outside Fires (36.5%), and Structure Fires (36.1%).
Fire incident types reported to NFIRS in Zip Code 47167


 Nearest zip codes: 47165, 47108, 47120, 47281, 47164, 47106.


 Based on the data from the years 2003 - 2018 the average number of fires per year is 43. The highest number of fire incidents - 87 took place in 2010, and the least - 0 in 2013. The data has a growing trend.
 When looking into fire subcategories, the most reports belonged to: Outside Fires (36.5%), and Structure Fires (36.1%).