Estimated zip code population in 2022: 699 Zip code population in 2010: 1,174 Zip code population in 2000: 1,027
Houses and condos: 430 Renter-occupied apartments: 18
% of renters here:
6%
State:
29%
March 2022 cost of living index in zip code 47142: 84.1 (less than average, U.S. average is 100)
Land area: 37.0 sq. mi. Water area: 0.8 sq. mi.
Population density: 19 people per square mile
(very low).
OSM Map
General Map
Google Map
MSN Map
OSM Map
General Map
Google Map
MSN Map
OSM Map
General Map
Google Map
MSN Map
OSM Map
General Map
Google Map
MSN Map
Please wait while loading the map...
Real estate property taxes paid for housing units in 2022:
This zip code:
0.3% ($619)
Indiana:
0.7% ($1,467)
Median real estate property taxes paid for housing units with mortgages in 2022: $540 (0.3%) Median real estate property taxes paid for housing units with no mortgage in 2022: $755 (0.4%)
Business Search- 14 Million verified businesses
Males: 380
(54.4%)
Females: 319
(45.6%)
For population 25 years and over in 47142:
High school or higher: 92.5%
Bachelor's degree or higher: 7.7%
Graduate or professional degree: 3.8%
Unemployed: 3.7%
Mean travel time to work (commute): 47.3 minutes
For population 15 years and over in 47142:
Never married: 12.6%
Now married: 64.2%
Separated: 0.3%
Widowed: 4.5%
Divorced: 18.4%
Zip code 47142 compared to state average:
Black race population percentage significantly below state average.
Hispanic race population percentage significantly below state average.
Median age significantly above state average.
Renting percentage significantly below state average.
Length of stay since moving in significantly above state average.
Percentage of population with a bachelor's degree or higher significantly below state average.
Estimated median house/condo value in 2022: $187,557
47142:
$187,557
Indiana:
$208,700
According to our research of Indiana and other state lists, there were 2 registered sex offenders living in 47142 zip code as of July 05, 2024. The ratio of all residents to sex offenders in zip code 47142 is 508 to 1. The ratio of registered sex offenders to all residents in this zip code is near the state average.
Median resident age:
This zip code:
48.4 years
Indiana median age:
38.2 years
Average household size:
This zip code:
2.2 people
Indiana:
2.4 people
Averages for the 2020 tax year for zip code 47142, filed in 2021:
Average Adjusted Gross Income (AGI) in 2020: $51,145 (Individual Income Tax Returns)
Here:
$51,145
State:
$64,978
Salary/wage: $47,326 (reported on 83.3% of returns)
Here:
$47,326
State:
$55,245
(% of AGI for various income ranges: 1123.6% for AGIs below $25k, 3718.8% for AGIs $25k-50k, 7030.0% for AGIs $50k-75k, 9963.3% for AGIs $75k-100k, 19496.7% for AGIs $100k-200k)
Taxable interest for individuals: $283 (reported on 14.3% of returns)
This zip code:
$283
Indiana:
$1,351
(% of AGI for various income ranges: 10.9% for AGIs below $25k, 2.5% for AGIs $25k-50k, 10.0% for AGIs $75k-100k)
Ordinary dividends: $2,367 (reported on 7.1% of returns)
Here:
$2,367
State:
$5,827
(% of AGI for various income ranges: 88.8% for AGIs $25k-50k)
Net capital gain/loss in AGI: +$6,725 (reported on 9.5% of returns)
Here:
+$6,725
State:
+$17,730
(% of AGI for various income ranges: 538.0% for AGIs $50k-75k)
Profit/loss from business: +$2,500 (reported on 14.3% of returns)
Here:
+$2,500
State:
+$12,144
(% of AGI for various income ranges: 120.0% for AGIs below $25k, 36.0% for AGIs $50k-75k)
Taxable individual retirement arrangement distribution: $25,200 (reported on 4.8% of returns)
47142:
$25,200
Indiana:
$18,302
(% of AGI for various income ranges: 458.2% for AGIs below $25k)
Earned income credit: $2,138 (reported on 19.0% of returns)
Here:
$2,138
State:
$2,298
(% of AGI for various income ranges: 96.4% for AGIs below $25k, 81.2% for AGIs $25k-50k)
Percentage of individuals using paid preparers for their 2020 taxes: 92.9%
Here:
93%
State:
94%
(% for various income ranges: 93.3% for AGIs below $25k, 100.0% for AGIs $25k-50k, 100.0% for AGIs $50k-75k, 80.0% for AGIs $75k-100k, 83.3% for AGIs $100k-200k)
Averages for the 2012 tax year for zip code 47142, filed in 2013:
Average Adjusted Gross Income (AGI) in 2012: $39,657 (Individual Income Tax Returns)
Here:
$39,657
State:
$52,932
Salary/wage: $37,281 (reported on 83.8% of returns)
Here:
$37,281
State:
$45,173
(% of AGI for various income ranges: 66.6% for AGIs below $25k, 86.2% for AGIs $25k-50k, 84.0% for AGIs $50k-75k, 93.5% for AGIs $75k-100k, 62.1% for AGIs $100k-200k)
Taxable interest for individuals: $288 (reported on 21.6% of returns)
This zip code:
$288
Indiana:
$1,311
(% of AGI for various income ranges: 0.8% for AGIs below $25k, 0.2% for AGIs $50k-75k)
Ordinary dividends: $400 (reported on 10.8% of returns)
Here:
$400
State:
$4,690
Net capital gain/loss in AGI: +$4,633 (reported on 8.1% of returns)
Here:
+$4,633
State:
+$10,406
Profit/loss from business: +$6,286 (reported on 18.9% of returns)
Here:
+$6,286
State:
+$11,105
Total itemized deductions: $15,629 (23% of AGI, reported on 18.9% of returns)
Here:
$15,629
State:
$20,913
Here:
22.6% of AGI
State:
18.2% of AGI
Charity contributions: $2,600 (reported on 10.8% of returns)
Here:
$2,600
State:
$4,697
Taxes paid: $4,143 (reported on 18.9% of returns)
47142:
$4,143
State:
$7,456
Earned income credit: $2,144 (reported on 24.3% of returns)
Here:
$2,144
State:
$2,265
(% of AGI for various income ranges: 6.6% for AGIs below $25k, 1.6% for AGIs $25k-50k)
Percentage of individuals using paid preparers for their 2012 taxes: 70.3%
Here:
70%
State:
53%
(% for various income ranges: 66.7% for AGIs below $25k, 75.0% for AGIs $25k-50k, 60.0% for AGIs $50k-75k, 133.3% for AGIs $75k-100k)
Averages for the 2004 tax year for zip code 47142, filed in 2005:
Average Adjusted Gross Income (AGI) in 2004: $29,883 (Individual Income Tax Returns)
Here:
$29,883
State:
$44,790
Salary/wage: $29,190 (reported on 85.1% of returns)
Here:
$29,190
State:
$39,615
(% of AGI for various income ranges: 72.9% for AGIs below $10k, 77.7% for AGIs $10k-25k, 87.0% for AGIs $25k-50k, 87.2% for AGIs $50k-75k, 76.6% for AGIs $75k-100k)
Taxable interest for individuals: $590 (reported on 35.7% of returns)
This zip code:
$590
Indiana:
$1,535
(% of AGI for various income ranges: 11.0% for AGIs below $10k, 1.3% for AGIs $10k-25k, 0.2% for AGIs $25k-50k, 0.1% for AGIs $50k-75k, 0.2% for AGIs $75k-100k)
Taxable dividends: $294 (reported on 12.7% of returns)
Here:
$294
State:
$2,998
Net capital gain/loss: +$2,559 (reported on 8.4% of returns)
Here:
+$2,559
State:
+$8,619
Profit/loss from business: +$4,215 (reported on 16.1% of returns)
Here:
+$4,215
State:
+$10,071
(% of AGI for various income ranges: 7.7% for AGIs below $10k, 6.7% for AGIs $10k-25k, 2.6% for AGIs $25k-50k, -0.4% for AGIs $50k-75k)
Total itemized deductions: $11,734 (24% of AGI, reported on 19.6% of returns)
Here:
$11,734
State:
$17,065
Here:
24.0% of AGI
State:
19.5% of AGI
(% of AGI for various income ranges: 7.1% for AGIs $10k-25k, 5.8% for AGIs $25k-50k, 10.9% for AGIs $50k-75k, 8.9% for AGIs $75k-100k)
Charity contributions deductions: $820 (2% of AGI, reported on 15.1% of returns)
Here:
$820
State:
$3,550
Here:
1.7% of AGI
State:
3.8% of AGI
Total tax: $3,122 (reported on 73.0% of returns)
47142:
$3,122
State:
$6,914
(% of AGI for various income ranges: 3.6% for AGIs below $10k, 4.5% for AGIs $10k-25k, 6.8% for AGIs $25k-50k, 8.9% for AGIs $50k-75k, 11.4% for AGIs $75k-100k)
Earned income credit: $1,513 (reported on 18.9% of returns)
Here:
$1,513
State:
$1,685
Percentage of individuals using paid preparers for their 2004 taxes: 72.5%
Here:
72%
State:
59%
(% for various income ranges: 73.3% for AGIs below $10k, 69.2% for AGIs $10k-25k, 74.8% for AGIs $25k-50k, 72.5% for AGIs $50k-75k, 73.9% for AGIs $75k-100k)
Household received Food Stamps/SNAP in the past 12 months: 5 Household did not receive Food Stamps/SNAP in the past 12 months: 313
Women who had a birth in the past 12 months: 28 (30 now married, 0 unmarried) Women who did not have a birth in the past 12 months: 143 (77 now married, 65 unmarried)
Housing units in zip code 47142 with a mortgage: 215 (18 second mortgage, 19 both second mortgage and home equity loan) Houses without a mortgage: 24
Median monthly owner costs for units with a mortgage: $1,183 Median monthly owner costs for units without a mortgage: $459
Residents with income below the poverty level in 2022:
This zip code:
7.0%
Whole state:
12.6%
Residents with income below 50% of the poverty level in 2022:
This zip code:
4.1%
Whole state:
6.3%
Median number of rooms in houses and condos:
Here:
6.9
State:
6.6
Median number of rooms in apartments:
Here:
7.9
State:
4.3
Notable locations in this zip code not listed on our city pages
Size of family households: 94 2-persons, 76 3-persons, 27 4-persons, 4 5-persons
Size of nonfamily households: 105 1-person, 12 2-persons
133 married couples with children.
0 single-parent households ().
96.2% of residents of 47142 zip code speak English at home.
2.8% of residents speak other Indo-European language at home (100% very well).
Foreign born population: 34 (5.0%) (100.0% of them are naturalized citizens)
This zip code:
5.0%
Whole state:
6.1%
41%Romania
66%American
9%German
7%Irish
7%Canadian
7%European
0%Italian
0%Norwegian
Year of entry for the foreign-born population
202010 or later
02000 to 2009
01990 to 1999
15Before 1990
Facilities with environmental interests located in this zip code:
MULZER CRUSHED STONE NEW AMSTERDAM QUARRY (9610 RIVER ROAD SW in MAUCKPORT, IN)
STATE MASTER (Indiana facility tracking) - ACES-OP-06100019, AIR PROGRAM National Pollutant Discharge Elimination System NON-MAJOR (Tracking pollutant discharge elimination systems) - permit National Pollutant Discharge Elimination System NON-MAJOR (Tracking pollutant discharge elimination systems) - permit Business SIC classification: CRUSHED AND BROKEN LIMESTONE; MARINE CARGO HANDLING Organizations: MR BRIAN J PETERS (CONTACT/OPERATOR)
, (EXPIRED PERMIT) (CONTACT/OPERATOR)
, MULZER CRUSHED STONE NEW AMSTR (CONTACT/OWNER)
Alternative names: MULZER CRUSHED STONE, NEW AMST
MULZER CRUSHED STONE (R.R. 1 RIVER ROAD in MAUCKPORT, IN)
AIR SYNTHETIC MINOR (AIRS/AFS)
Housing units lacking complete plumbing facilities: 3.5% Housing units lacking complete kitchen facilities: 8.0%
41.7%Electricity
38.4%Bottled, tank, or LP gas
16.8%Wood
3.6%Utility gas
Population in 1990: 520. Population change in the 1990s: +507 (+97.5%).
Place of birth for U.S.-born residents:
This state: 418
Northeast: 36
Midwest: 37
South: 163
West: 4
57% of the 47142 zip code residents lived in the same house 5 years ago. Out of people who lived in different houses, 25% lived in this county. Out of people who lived in different counties, 50% lived in Indiana.
100% of the 47142 zip code residents lived in the same house 1 year ago.
Private vs. public school enrollment:
Students in private schools in grades 1 to 8 (elementary and middle school):
Here:
0.0%
Indiana:
14.9%
Students in private schools in grades 9 to 12 (high school):
Here:
0.0%
Indiana:
11.4%
Students in private undergraduate colleges:
Here:
0.0%
Indiana:
22.3%
Occupation by median earnings in the past 12 months ($)
97,298Production occupations
55,502Management occupations
31,665Office and administrative support occupations
Top industries in this zip code by the number of employees in 2005:
Arts, Entertainment, and Recreation: Nature Parks and Other Similar Institutions (10-19 employees: 1 establishment)
Mining: Construction Sand and Gravel Mining (5-9: 1)
Administrative and Support and Waste Management and Remediation Services: Other Services to Buildings and Dwellings (1-4: 1)
Construction: Siding Contractors (1-4: 1)
Wholesale Trade: Medical, Dental, and Hospital Equipment and Supplies Merchant Wholesalers (1-4: 1)
Fatal accident statistics in 2011:
Fatal accident count: 1
Vehicles involved in fatal accidents: 2
Fatal accidents caused by drunken drivers: 1
Fatalities: 1
Persons involved in fatal accidents: 5
Pedestrians involved in fatal accidents: 0
Home Mortgage Disclosure Act Aggregated Statistics For Year 2009 (Based on 2 partial tracts)
A) FHA, FSA/RHS & VA Home Purchase Loans
B) Conventional Home Purchase Loans
C) Refinancings
D) Home Improvement Loans
F) Non-occupant Loans on < 5 Family Dwellings (A B C & D)
G) Loans On Manufactured Home Dwelling (A B C & D)
Number
Average Value
Number
Average Value
Number
Average Value
Number
Average Value
Number
Average Value
Number
Average Value
LOANS ORIGINATED
11
$110,519
10
$116,159
57
$122,484
2
$37,470
4
$132,302
12
$78,449
APPLICATIONS APPROVED, NOT ACCEPTED
0
$0
1
$65,690
6
$99,305
0
$0
0
$0
1
$66,610
APPLICATIONS DENIED
5
$85,580
4
$93,908
27
$124,182
3
$64,763
0
$0
4
$56,785
APPLICATIONS WITHDRAWN
0
$0
4
$108,595
10
$126,012
0
$0
0
$0
0
$0
FILES CLOSED FOR INCOMPLETENESS
1
$82,340
0
$0
4
$141,902
0
$0
0
$0
0
$0
Aggregated Statistics For Year 2008 (Based on 2 partial tracts)
A) FHA, FSA/RHS & VA Home Purchase Loans
B) Conventional Home Purchase Loans
C) Refinancings
D) Home Improvement Loans
F) Non-occupant Loans on < 5 Family Dwellings (A B C & D)
G) Loans On Manufactured Home Dwelling (A B C & D)
Number
Average Value
Number
Average Value
Number
Average Value
Number
Average Value
Number
Average Value
Number
Average Value
LOANS ORIGINATED
6
$89,437
16
$87,344
51
$112,775
6
$54,510
5
$58,842
20
$75,774
APPLICATIONS APPROVED, NOT ACCEPTED
1
$97,150
5
$119,350
8
$110,041
0
$0
1
$290,510
4
$82,342
APPLICATIONS DENIED
1
$74,020
4
$65,805
33
$131,477
4
$62,912
1
$131,380
8
$81,129
APPLICATIONS WITHDRAWN
1
$96,680
2
$91,595
10
$131,610
0
$0
0
$0
2
$48,340
FILES CLOSED FOR INCOMPLETENESS
0
$0
0
$0
4
$123,052
0
$0
0
$0
0
$0
Aggregated Statistics For Year 2007 (Based on 2 partial tracts)
A) FHA, FSA/RHS & VA Home Purchase Loans
B) Conventional Home Purchase Loans
C) Refinancings
D) Home Improvement Loans
F) Non-occupant Loans on < 5 Family Dwellings (A B C & D)
G) Loans On Manufactured Home Dwelling (A B C & D)
Number
Average Value
Number
Average Value
Number
Average Value
Number
Average Value
Number
Average Value
Number
Average Value
LOANS ORIGINATED
11
$111,697
25
$98,145
55
$104,505
11
$50,970
6
$76,328
22
$70,294
APPLICATIONS APPROVED, NOT ACCEPTED
0
$0
6
$81,340
6
$88,588
3
$37,780
2
$76,330
4
$65,920
APPLICATIONS DENIED
2
$181,800
9
$97,300
33
$114,136
8
$50,655
2
$61,065
12
$71,048
APPLICATIONS WITHDRAWN
1
$77,250
2
$93,445
14
$113,171
0
$0
0
$0
1
$123,510
FILES CLOSED FOR INCOMPLETENESS
0
$0
1
$201,690
5
$79,938
0
$0
0
$0
0
$0
Aggregated Statistics For Year 2006 (Based on 2 partial tracts)
A) FHA, FSA/RHS & VA Home Purchase Loans
B) Conventional Home Purchase Loans
C) Refinancings
D) Home Improvement Loans
F) Non-occupant Loans on < 5 Family Dwellings (A B C & D)
G) Loans On Manufactured Home Dwelling (A B C & D)
Number
Average Value
Number
Average Value
Number
Average Value
Number
Average Value
Number
Average Value
Number
Average Value
LOANS ORIGINATED
8
$93,965
41
$92,678
63
$85,243
16
$47,995
14
$78,014
29
$60,346
APPLICATIONS APPROVED, NOT ACCEPTED
0
$0
7
$74,544
8
$110,561
1
$34,230
0
$0
2
$76,560
APPLICATIONS DENIED
1
$168,850
14
$95,329
48
$106,514
8
$51,118
3
$86,043
13
$82,805
APPLICATIONS WITHDRAWN
1
$141,090
5
$89,744
20
$107,601
2
$77,025
0
$0
3
$96,993
FILES CLOSED FOR INCOMPLETENESS
0
$0
2
$106,860
6
$95,758
0
$0
0
$0
0
$0
Aggregated Statistics For Year 2005 (Based on 2 partial tracts)
A) FHA, FSA/RHS & VA Home Purchase Loans
B) Conventional Home Purchase Loans
C) Refinancings
D) Home Improvement Loans
F) Non-occupant Loans on < 5 Family Dwellings (A B C & D)
G) Loans On Manufactured Home Dwelling (A B C & D)
Number
Average Value
Number
Average Value
Number
Average Value
Number
Average Value
Number
Average Value
Number
Average Value
LOANS ORIGINATED
6
$108,403
38
$105,546
80
$93,555
14
$50,754
12
$70,547
22
$62,451
APPLICATIONS APPROVED, NOT ACCEPTED
0
$0
5
$74,294
10
$97,470
2
$32,150
0
$0
3
$49,190
APPLICATIONS DENIED
1
$79,570
20
$76,098
57
$96,269
9
$48,110
0
$0
15
$64,671
APPLICATIONS WITHDRAWN
0
$0
7
$108,249
21
$103,820
4
$142,712
1
$104,080
1
$144,790
FILES CLOSED FOR INCOMPLETENESS
0
$0
4
$98,998
7
$120,474
0
$0
0
$0
0
$0
Aggregated Statistics For Year 2004 (Based on 2 partial tracts)
A) FHA, FSA/RHS & VA Home Purchase Loans
B) Conventional Home Purchase Loans
C) Refinancings
D) Home Improvement Loans
F) Non-occupant Loans on < 5 Family Dwellings (A B C & D)
G) Loans On Manufactured Home Dwelling (A B C & D)
Number
Average Value
Number
Average Value
Number
Average Value
Number
Average Value
Number
Average Value
Number
Average Value
LOANS ORIGINATED
6
$82,652
31
$79,328
93
$88,635
13
$39,819
7
$76,990
20
$63,515
APPLICATIONS APPROVED, NOT ACCEPTED
0
$0
7
$56,173
10
$83,777
1
$32,840
0
$0
6
$52,352
APPLICATIONS DENIED
1
$159,130
15
$79,289
50
$87,135
9
$30,172
1
$60,140
18
$67,874
APPLICATIONS WITHDRAWN
1
$147,570
2
$100,385
27
$107,203
1
$73,550
0
$0
3
$78,487
FILES CLOSED FOR INCOMPLETENESS
0
$0
1
$108,710
15
$117,593
1
$71,700
0
$0
1
$116,110
Aggregated Statistics For Year 2003 (Based on 2 partial tracts)
A) FHA, FSA/RHS & VA Home Purchase Loans
B) Conventional Home Purchase Loans
C) Refinancings
D) Home Improvement Loans
F) Non-occupant Loans on < 5 Family Dwellings (A B C & D)

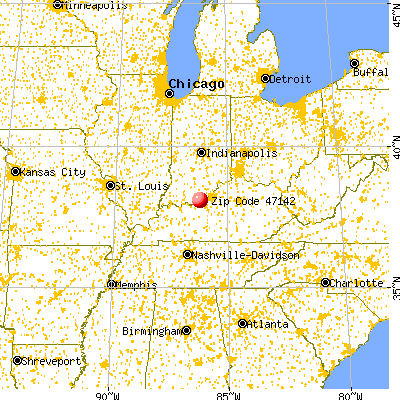


 Nearest zip codes: 47110, 40104, 47112, 40108, 47135, 47160.


