Estimated zip code population in 2022: 2,295 Zip code population in 2010: 2,059 Zip code population in 2000: 2,182
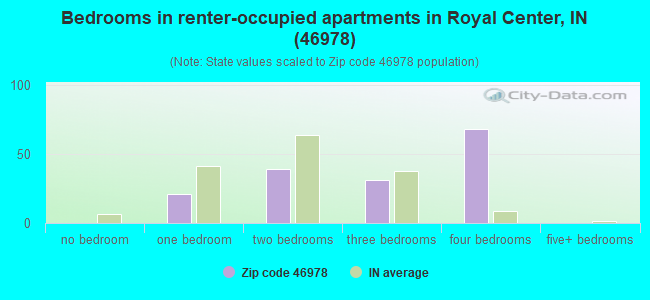
Houses and condos: 1,075 Renter-occupied apartments: 156
% of renters here:
17%
State:
29%
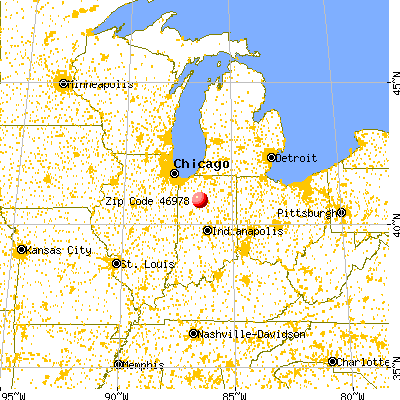
March 2022 cost of living index in zip code 46978: 84.6 (less than average, U.S. average is 100)
Land area: 63.5 sq. mi. Water area: 0.0 sq. mi.
Population density: 36 people per square mile
(very low).
OSM Map
General Map
Google Map
MSN Map
OSM Map
General Map
Google Map
MSN Map
OSM Map
General Map
Google Map
MSN Map
OSM Map
General Map
Google Map
MSN Map
Please wait while loading the map...
Real estate property taxes paid for housing units in 2022:
This zip code:
0.6% ($797)
Indiana:
0.7% ($1,467)
Median real estate property taxes paid for housing units with mortgages in 2022: $827 (0.6%) Median real estate property taxes paid for housing units with no mortgage in 2022: $729 (0.7%)
Business Search- 14 Million verified businesses
Males: 1,218
(53.1%)
Females: 1,077
(46.9%)
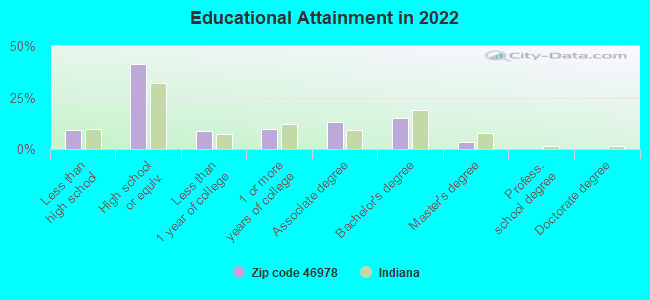
For population 25 years and over in 46978:
High school or higher: 90.1%
Bachelor's degree or higher: 18.0%
Graduate or professional degree: 3.3%
Unemployed: 2.3%
Mean travel time to work (commute): 29.2 minutes
For population 15 years and over in 46978:
Never married: 27.3%
Now married: 53.9%
Separated: 1.2%
Widowed: 4.1%
Divorced: 13.5%
Zip code 46978 compared to state average:
Median house value below state average.
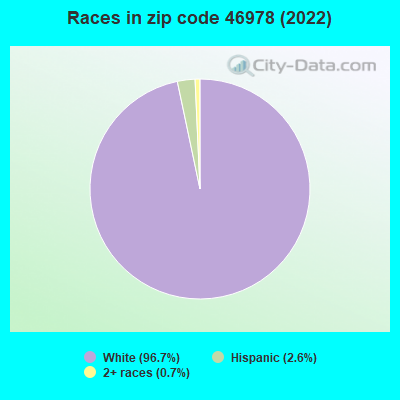
Black race population percentage significantly below state average.
Hispanic race population percentage below state average.
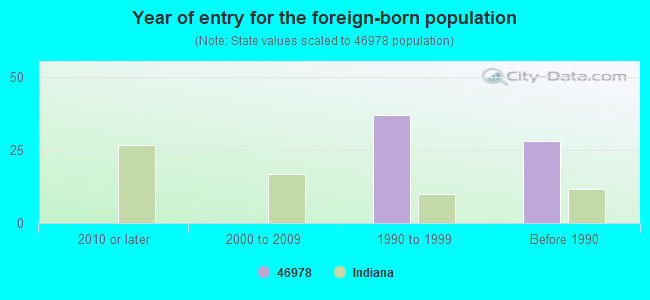
Foreign-born population percentage significantly below state average.
Renting percentage below state average.
Length of stay since moving in significantly above state average.
House age above state average.
Percentage of population with a bachelor's degree or higher below state average.
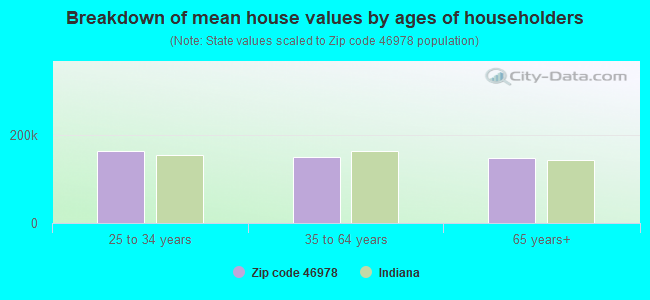
Estimated median house/condo value in 2022: $127,312
46978:
$127,312
Indiana:
$208,700
According to our research of Indiana and other state lists, there was 1 registered sex offender living in 46978 zip code as of July 03, 2024. The ratio of all residents to sex offenders in zip code 46978 is 2,137 to 1. The ratio of registered sex offenders to all residents in this zip code is much lower than the state average.
Median resident age:
This zip code:
39.7 years
Indiana median age:
38.2 years
Average household size:
This zip code:
2.5 people
Indiana:
2.4 people
Averages for the 2020 tax year for zip code 46978, filed in 2021:
Average Adjusted Gross Income (AGI) in 2020: $55,172 (Individual Income Tax Returns)
Here:
$55,172
State:
$64,978
Salary/wage: $47,951 (reported on 81.6% of returns)
Here:
$47,951
State:
$55,245
(% of AGI for various income ranges: 1134.8% for AGIs below $25k, 3413.3% for AGIs $25k-50k, 7040.8% for AGIs $50k-75k, 9162.9% for AGIs $75k-100k, 16553.8% for AGIs $100k-200k)
Taxable interest for individuals: $805 (reported on 38.8% of returns)
This zip code:
$805
Indiana:
$1,351
(% of AGI for various income ranges: 23.8% for AGIs below $25k, 41.4% for AGIs $25k-50k, 40.8% for AGIs $50k-75k, 24.3% for AGIs $75k-100k, 123.8% for AGIs $100k-200k)
Ordinary dividends: $2,582 (reported on 17.3% of returns)
Here:
$2,582
State:
$5,827
(% of AGI for various income ranges: 19.0% for AGIs below $25k, 19.0% for AGIs $25k-50k, 76.2% for AGIs $50k-75k, 45.7% for AGIs $75k-100k, 285.0% for AGIs $100k-200k)
Net capital gain/loss in AGI: +$3,721 (reported on 14.3% of returns)
Here:
+$3,721
State:
+$17,730
(% of AGI for various income ranges: 25.7% for AGIs below $25k, 31.4% for AGIs $25k-50k, 23.8% for AGIs $50k-75k, 32.9% for AGIs $75k-100k, 433.8% for AGIs $100k-200k)
Profit/loss from business: +$4,183 (reported on 12.2% of returns)
Here:
+$4,183
State:
+$12,144
(% of AGI for various income ranges: 33.8% for AGIs below $25k, 75.2% for AGIs $25k-50k, 176.9% for AGIs $50k-75k, 53.8% for AGIs $100k-200k)
Taxable individual retirement arrangement distribution: $11,731 (reported on 13.3% of returns)
46978:
$11,731
Indiana:
$18,302
(% of AGI for various income ranges: 107.1% for AGIs below $25k, 97.1% for AGIs $25k-50k, 325.4% for AGIs $50k-75k, 841.2% for AGIs $100k-200k)
Earned income credit: $2,077 (reported on 13.3% of returns)
Here:
$2,077
State:
$2,298
(% of AGI for various income ranges: 66.2% for AGIs below $25k, 62.4% for AGIs $25k-50k)
Percentage of individuals using paid preparers for their 2020 taxes: 94.9%
Here:
95%
State:
94%
(% for various income ranges: 93.3% for AGIs below $25k, 96.0% for AGIs $25k-50k, 94.7% for AGIs $50k-75k, 100.0% for AGIs $75k-100k, 92.9% for AGIs $100k-200k)
Averages for the 2012 tax year for zip code 46978, filed in 2013:
Average Adjusted Gross Income (AGI) in 2012: $46,789 (Individual Income Tax Returns)
Here:
$46,789
State:
$52,932
Salary/wage: $41,600 (reported on 83.2% of returns)
Here:
$41,600
State:
$45,173
(% of AGI for various income ranges: 70.0% for AGIs below $25k, 80.1% for AGIs $25k-50k, 81.1% for AGIs $50k-75k, 78.9% for AGIs $75k-100k, 62.6% for AGIs $100k-200k)
Taxable interest for individuals: $871 (reported on 40.0% of returns)
This zip code:
$871
Indiana:
$1,311
(% of AGI for various income ranges: 1.6% for AGIs below $25k, 0.8% for AGIs $25k-50k, 0.3% for AGIs $50k-75k, 0.4% for AGIs $75k-100k, 1.0% for AGIs $100k-200k)
Ordinary dividends: $2,567 (reported on 18.9% of returns)
Here:
$2,567
State:
$4,690
(% of AGI for various income ranges: 2.1% for AGIs below $25k, 0.6% for AGIs $25k-50k, 0.4% for AGIs $50k-75k, 1.3% for AGIs $75k-100k, 1.3% for AGIs $100k-200k)
Net capital gain/loss in AGI: +$1,455 (reported on 11.6% of returns)
Here:
+$1,455
State:
+$10,406
(% of AGI for various income ranges: 0.2% for AGIs $50k-75k, 1.1% for AGIs $100k-200k)
Profit/loss from business: +$5,209 (reported on 11.6% of returns)
Here:
+$5,209
State:
+$11,105
(% of AGI for various income ranges: 3.4% for AGIs below $25k, 1.8% for AGIs $25k-50k, 1.9% for AGIs $50k-75k, 0.9% for AGIs $75k-100k)
Taxable individual retirement arrangement distribution: $6,891 (reported on 11.6% of returns)
46978:
$6,891
Indiana:
$13,841
(% of AGI for various income ranges: 3.3% for AGIs below $25k, 1.8% for AGIs $25k-50k, 1.9% for AGIs $50k-75k, 1.9% for AGIs $100k-200k)
Total itemized deductions: $18,929 (21% of AGI, reported on 17.9% of returns)
Here:
$18,929
State:
$20,913
Here:
20.6% of AGI
State:
18.2% of AGI
(% of AGI for various income ranges: 7.5% for AGIs $25k-50k, 6.4% for AGIs $50k-75k, 9.2% for AGIs $75k-100k, 9.0% for AGIs $100k-200k)
Charity contributions: $3,823 (reported on 13.7% of returns)
Here:
$3,823
State:
$4,697
(% of AGI for various income ranges: 2.1% for AGIs below $25k, 1.1% for AGIs $50k-75k, 1.9% for AGIs $75k-100k, 1.1% for AGIs $100k-200k)
Taxes paid: $6,800 (reported on 17.9% of returns)
46978:
$6,800
State:
$7,456
(% of AGI for various income ranges: 1.2% for AGIs $25k-50k, 1.9% for AGIs $50k-75k, 3.2% for AGIs $75k-100k, 4.6% for AGIs $100k-200k)
Earned income credit: $2,435 (reported on 17.9% of returns)
Here:
$2,435
State:
$2,265
(% of AGI for various income ranges: 6.4% for AGIs below $25k, 1.5% for AGIs $25k-50k)
Percentage of individuals using paid preparers for their 2012 taxes: 65.3%
Here:
65%
State:
53%
(% for various income ranges: 57.1% for AGIs below $25k, 68.0% for AGIs $25k-50k, 70.6% for AGIs $50k-75k, 66.7% for AGIs $75k-100k, 77.8% for AGIs $100k-200k)
Averages for the 2004 tax year for zip code 46978, filed in 2005:
Average Adjusted Gross Income (AGI) in 2004: $36,271 (Individual Income Tax Returns)
Here:
$36,271
State:
$44,790
Salary/wage: $34,289 (reported on 85.2% of returns)
Here:
$34,289
State:
$39,615
(% of AGI for various income ranges: 142.7% for AGIs below $10k, 69.6% for AGIs $10k-25k, 81.8% for AGIs $25k-50k, 84.9% for AGIs $50k-75k, 84.9% for AGIs $75k-100k, 65.8% for AGIs over 100k)
Taxable interest for individuals: $1,276 (reported on 50.4% of returns)
This zip code:
$1,276
Indiana:
$1,535
(% of AGI for various income ranges: 9.5% for AGIs below $10k, 3.7% for AGIs $10k-25k, 1.4% for AGIs $25k-50k, 1.5% for AGIs $50k-75k, 1.0% for AGIs $75k-100k, 1.6% for AGIs over 100k)
Taxable dividends: $1,518 (reported on 21.9% of returns)
Here:
$1,518
State:
$2,998
(% of AGI for various income ranges: 2.8% for AGIs below $10k, 1.5% for AGIs $10k-25k, 0.5% for AGIs $25k-50k, 0.7% for AGIs $50k-75k, 1.4% for AGIs $75k-100k, 1.0% for AGIs over 100k)
Net capital gain/loss: +$1,810 (reported on 14.8% of returns)
Here:
+$1,810
State:
+$8,619
(% of AGI for various income ranges: 1.2% for AGIs below $10k, 0.9% for AGIs $10k-25k, 0.2% for AGIs $25k-50k, 0.3% for AGIs $50k-75k, 2.3% for AGIs $75k-100k, 0.9% for AGIs over 100k)
Profit/loss from business: +$3,195 (reported on 12.4% of returns)
Here:
+$3,195
State:
+$10,071
(% of AGI for various income ranges: 3.5% for AGIs below $10k, 1.7% for AGIs $10k-25k, 1.6% for AGIs $25k-50k, 1.0% for AGIs $50k-75k, 0.6% for AGIs $75k-100k)
Profit/loss from farming: +$333 (reported on 7.8% of returns)
Here:
+$333
State:
-$2,212
(% of AGI for various income ranges: 0.9% for AGIs below $10k, -0.2% for AGIs $10k-25k, 0.8% for AGIs $25k-50k, 1.0% for AGIs $50k-75k, -3.0% for AGIs $75k-100k)
IRA payment deduction: $2,389 (reported on 1.7% of returns)
46978:
$2,389
Indiana:
$2,840
Total itemized deductions: $13,631 (20% of AGI, reported on 17.0% of returns)
Here:
$13,631
State:
$17,065
Here:
20.3% of AGI
State:
19.5% of AGI
(% of AGI for various income ranges: 4.6% for AGIs $10k-25k, 6.7% for AGIs $25k-50k, 5.5% for AGIs $50k-75k, 7.2% for AGIs $75k-100k, 9.2% for AGIs over 100k)
Charity contributions deductions: $2,635 (4% of AGI, reported on 13.2% of returns)
Here:
$2,635
State:
$3,550
Here:
3.7% of AGI
State:
3.8% of AGI
(% of AGI for various income ranges: 0.8% for AGIs $10k-25k, 1.1% for AGIs $25k-50k, 0.6% for AGIs $50k-75k, 1.3% for AGIs $75k-100k, 1.5% for AGIs over 100k)
Total tax: $4,333 (reported on 73.5% of returns)
46978:
$4,333
State:
$6,914
(% of AGI for various income ranges: 3.5% for AGIs below $10k, 3.3% for AGIs $10k-25k, 6.4% for AGIs $25k-50k, 8.6% for AGIs $50k-75k, 10.6% for AGIs $75k-100k, 16.8% for AGIs over 100k)
Earned income credit: $1,669 (reported on 13.7% of returns)
Here:
$1,669
State:
$1,685
Percentage of individuals using paid preparers for their 2004 taxes: 71.3%
Here:
71%
State:
59%
(% for various income ranges: 63.2% for AGIs below $10k, 71.5% for AGIs $10k-25k, 71.8% for AGIs $25k-50k, 75.4% for AGIs $50k-75k, 73.4% for AGIs $75k-100k, 89.2% for AGIs over 100k)
Household received Food Stamps/SNAP in the past 12 months: 37 Household did not receive Food Stamps/SNAP in the past 12 months: 880
Women who had a birth in the past 12 months: 7 (0 now married, 6 unmarried) Women who did not have a birth in the past 12 months: 437 (222 now married, 215 unmarried)
Housing units in zip code 46978 with a mortgage: 449 (89 second mortgage, 87 both second mortgage and home equity loan) Houses without a mortgage: 16
Median monthly owner costs for units with a mortgage: $1,090 Median monthly owner costs for units without a mortgage: $404
Residents with income below the poverty level in 2022:
This zip code:
15.6%
Whole state:
12.6%
Residents with income below 50% of the poverty level in 2022:
This zip code:
8.6%
Whole state:
6.3%
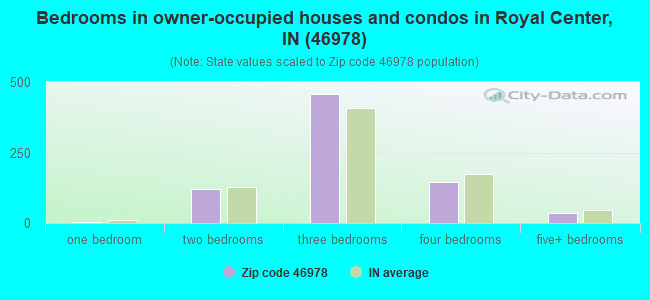
Median number of rooms in houses and condos:
Here:
7.1
State:
6.6
Median number of rooms in apartments:
Here:
5.4
State:
4.3
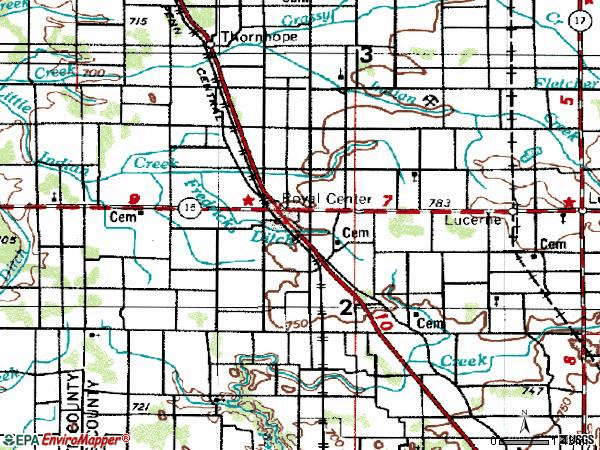
Notable locations in this zip code not listed on our city pages
Churches in zip code 46978 include: Indian Creek Church (A), Center Church (B), Crooked Creek Church (C), West Union Church (D). Display/hide their locations on the map
Cemeteries: Royal Center Cemetery (1), Zion Cemetery (2), Grant Cemetery (3), Crooked Creek Cemetery (4), Cline Cemetery (5), Thompson Cemetery (6). Display/hide their locations on the map
Size of family households: 282 2-persons, 132 3-persons, 135 4-persons, 42 5-persons, 4 6-persons, 32 7-or-more-persons
Size of nonfamily households: 228 1-person, 58 2-persons, 2 3-persons
390 married couples with children.
92 single-parent households (1 men, 91 women).
98.3% of residents of 46978 zip code speak English at home.
0.4% of residents speak Spanish at home (38% very well, 62% well).
0.3% of residents speak other Indo-European language at home (100% very well).
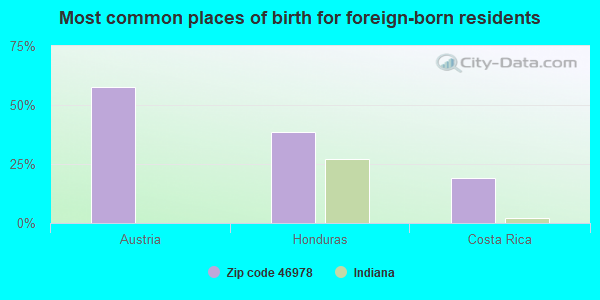
Foreign born population: 26 (1.1%) (34.4% of them are naturalized citizens)
This zip code:
1.1%
Whole state:
6.1%
58%Austria
38%Honduras
19%Costa Rica
25%German
19%American
9%Irish
8%English
5%Scottish
3%Italian
2%Icelander
Year of entry for the foreign-born population
02010 or later
02000 to 2009
371990 to 1999
28Before 1990
Facilities with environmental interests located in this zip code:
ROYAL CENTER LOCKER PLANT INC (104 N CHICAGO ST in ROYAL CENTER, IN)
(Integrated Compliance Information System) - ICIS-05-1997-0226, FORMAL ENFORCEMENT ACTION STATE MASTER (Indiana facility tracking) - CRTK-21529, EPCRA Business SIC classification: MEAT PACKING PLANTS
ROYAL CENTER WWTP (7100 W 650 N in ROYAL CENTER, IN)
STATE MASTER (Indiana facility tracking) - CRTK-1061, EPCRA, CRTK-1761, UST-8029, UNDERGROUND STORAGE TANK PROGRAM National Pollutant Discharge Elimination System NON-MAJOR (Tracking pollutant discharge elimination systems) - permit Business SIC classification: SEWERAGE SYSTEMS Organizations: ALLEN L TRIBBETT (CONTACT/OPERATOR)
, TOWN COUNCIL PRESIDENT (CONTACT/OWNER)
Alternative names: ROYAL CENTER MUNICIPAL STP, ROYAL CENTER WASTEWATER PLANT
NIPSCO ROYAL CENTER UNDERGROUND GAS (8710 N 525 W in ROYAL CENTER, IN)
AIR SYNTHETIC MINOR (AIRS/AFS) STATE MASTER (Indiana facility tracking) - CRTK-1647, EPCRA, UST-6067, UNDERGROUND STORAGE TANK PROGRAM, ACES-OP-01700026, AIR PROGRAM CRITERIA AND HAZARDOUS AIR POLLUTANT INVENTORY (Inventory of air pollution sources) Conditionally Exempt Small Quantity Generators, less than 100 kg/month of hazardous waste (Resource Conservation and Recovery Act (tracking hazardous waste)) - notification HAZARDOUS WASTE BIENNIAL REPORTER (Resource Conservation and Recovery Act (tracking hazardous waste)) Business SIC classification: NATURAL GAS TRANSMISSION Business NAICS classification: PIPELINE TRANSPORTATION OF NATURAL GAS. Organizations: NISOURCE (CONTACT/OWNER)
Alternative names: NIPSCO-ROYAL CENTER, NIPSCO ROYAL CENTER N.G. PROC, NIPSCO ROYAL CENTER NAT.GAS COMPRESSORS, NIPSCO ROYAL CTR UNDERGROUND GAS STORAGE
BLUE SPRUCE, INC. (ROYAL CENTER PIKE in ROYAL CENTER, IN)
AIR MINOR (AIRS/AFS) STATE MASTER (Indiana facility tracking) - ACES-CP-2798, AIR PROGRAM Business SIC classification: NONCLASSIFIABLE ESTABLISHMENTS
PIONEER ELEMENTARY SCHOOL (BOX 517 in ROYAL CENTER, IN)
(National Center for Education Statistics) - STATE ID-0649 Organizations: PIONEER REGIONAL SCHOOL CORP (SCHOOL DISTRICT)
PIONEER JR-SR HIGH SCHOOL (BOX 547 US HWY 35 in ROYAL CENTER, IN)
(National Center for Education Statistics) - STATE ID-0645 Organizations: PIONEER REGIONAL SCHOOL CORP (SCHOOL DISTRICT)
PIONEER REGIONAL SCHOOL CORP (115 S CHICAGO ST in ROYAL CENTER, IN)
STATE MASTER (Indiana facility tracking) - UST-21463, UNDERGROUND STORAGE TANK PROGRAM COMPLIANCE ACTIVITY (Tracking inspections of insecticide, fungicide, and rodenticide, and toxic substances) Alternative names: PIONEER RIGIONAL SCH CORP
Housing units lacking complete plumbing facilities: 0.5% Housing units lacking complete kitchen facilities: 1.2%
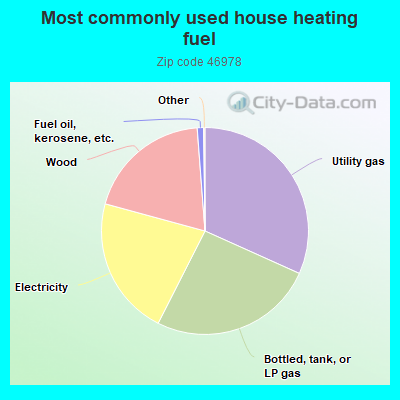
31.8%Utility gas
25.8%Bottled, tank, or LP gas
21.8%Electricity
19.6%Wood
1.0%Fuel oil, kerosene, etc.
Population in 1990: 1,558. Population change in the 1990s: +624 (+40.1%).
Place of birth for U.S.-born residents:
This state: 1,919
Northeast: 47
Midwest: 143
South: 71
West: 28
64% of the 46978 zip code residents lived in the same house 5 years ago. Out of people who lived in different houses, 55% lived in this county. Out of people who lived in different counties, 50% lived in Indiana.
99% of the 46978 zip code residents lived in the same house 1 year ago. Out of people who lived in different houses, 17% moved from this county. Out of people who lived in different houses, 167% moved from different county within same state.
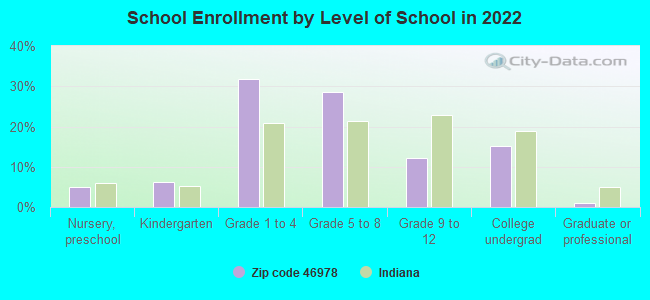
Private vs. public school enrollment:
Students in private schools in grades 1 to 8 (elementary and middle school): 76
Here:
23.0%
Indiana:
14.9%
Students in private schools in grades 9 to 12 (high school):
Here:
0.0%
Indiana:
11.4%
Students in private undergraduate colleges:
Here:
0.0%
Indiana:
22.3%
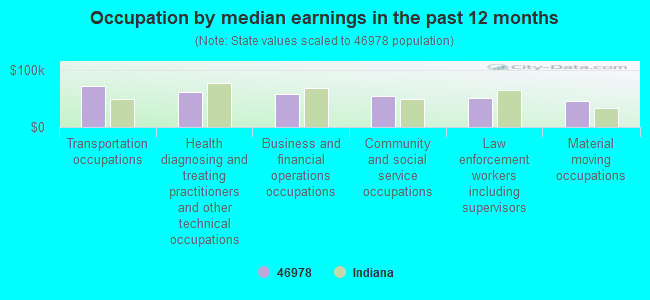
Occupation by median earnings in the past 12 months ($)
72,599Transportation occupations
61,139Health diagnosing and treating practitioners and other technical occupations
58,980Business and financial operations occupations
54,649Community and social service occupations
51,264Law enforcement workers including supervisors
45,893Material moving occupations
Top industries in this zip code by the number of employees in 2005:
Utilities: Electric Power Distribution (20-49 employees: 1 establishment)
Accommodation and Food Services: Full-Service Restaurants (10-19: 1, 5-9: 1)
Accommodation and Food Services: Limited-Service Restaurants (10-19: 1, 1-4: 1)
Finance and Insurance: Commercial Banking (10-19: 1)
Other Services (except Public Administration): Religious Organizations (5-9: 1, 1-4: 3)
Construction: New Single-Family Housing Construction (except Operative Builders) (5-9: 1, 1-4: 1)
Construction: Site Preparation Contractors (5-9: 1)
Fatal accident statistics in 2013:
Fatal accident count: 1
Vehicles involved in fatal accidents: 1
Fatal accidents caused by drunken drivers: 1
Fatalities: 1
Persons involved in fatal accidents: 1
Pedestrians involved in fatal accidents: 0
Fatal accident statistics in 2011:
Fatal accident count: 2
Vehicles involved in fatal accidents: 4
Fatal accidents caused by drunken drivers: 1
Fatalities: 4
Persons involved in fatal accidents: 6
Pedestrians involved in fatal accidents: 0
2002 - 2018 National Fire Incident Reporting System (NFIRS) incidents
Based on the data from the years 2002 - 2018 the average number of fires per year is 11. The highest number of reported fire incidents - 25 took place in 2003, and the least - 0 in 2017. The data has a constant trend.
When looking into fire subcategories, the most reports belonged to: Structure Fires (44.6%), and Outside Fires (38.0%).
Fire incident types reported to NFIRS in Zip Code 46978


+$333
-$2,212
(% of AGI for various income ranges: 0.9% for AGIs below $10k, -0.2% for AGIs $10k-25k, 0.8% for AGIs $25k-50k, 1.0% for AGIs $50k-75k, -3.0% for AGIs $75k-100k) Nearest zip codes: 46985, 47926, 46950, 47950, 46947, 46939.
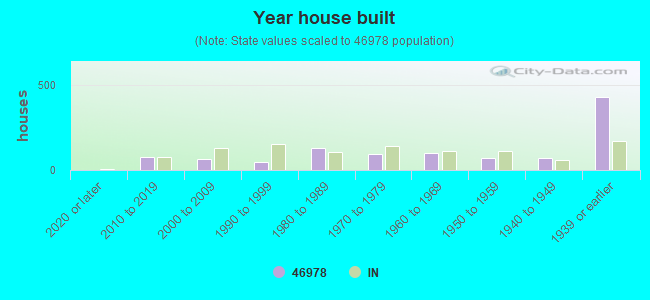


 Based on the data from the years 2002 - 2018 the average number of fires per year is 11. The highest number of reported fire incidents - 25 took place in 2003, and the least - 0 in 2017. The data has a constant trend.
 When looking into fire subcategories, the most reports belonged to: Structure Fires (44.6%), and Outside Fires (38.0%).