Averages for the 2020 tax year for zip code 46764, filed in 2021:
Average Adjusted Gross Income (AGI) in 2020: $60,297 (Individual Income Tax Returns)
Here:
$60,297
State:
$64,978
Salary/wage: $53,502 (reported on 82.6% of returns)
Here:
$53,502
State:
$55,245
(% of AGI for various income ranges: 1215.0% for AGIs below $25k, 3795.8% for AGIs $25k-50k, 7387.5% for AGIs $50k-75k, 9396.7% for AGIs $75k-100k, 20748.3% for AGIs $100k-200k)
Taxable interest for individuals: $652 (reported on 30.4% of returns)
This zip code:
$652
Indiana:
$1,351
(% of AGI for various income ranges: 5.0% for AGIs below $25k, 25.0% for AGIs $25k-50k, 23.8% for AGIs $50k-75k, 5.0% for AGIs $75k-100k, 128.3% for AGIs $100k-200k)
Ordinary dividends: $1,458 (reported on 17.4% of returns)
Here:
$1,458
State:
$5,827
(% of AGI for various income ranges: 9.4% for AGIs below $25k, 29.2% for AGIs $25k-50k, 73.8% for AGIs $50k-75k, 110.0% for AGIs $100k-200k)
Net capital gain/loss in AGI: +$4,220 (reported on 14.5% of returns)
Here:
+$4,220
State:
+$17,730
(% of AGI for various income ranges: 87.5% for AGIs $25k-50k, 116.3% for AGIs $50k-75k, 373.3% for AGIs $100k-200k)
Profit/loss from business: +$7,200 (reported on 11.6% of returns)
Here:
+$7,200
State:
+$12,144
(% of AGI for various income ranges: 78.1% for AGIs below $25k, 196.7% for AGIs $25k-50k, 358.3% for AGIs $75k-100k)
Taxable individual retirement arrangement distribution: $14,200 (reported on 8.7% of returns)
46764:
$14,200
Indiana:
$18,302
(% of AGI for various income ranges: 140.6% for AGIs below $25k, 783.8% for AGIs $50k-75k)
Earned income credit: $2,314 (reported on 10.1% of returns)
Here:
$2,314
State:
$2,298
(% of AGI for various income ranges: 58.1% for AGIs below $25k, 57.5% for AGIs $25k-50k)
Percentage of individuals using paid preparers for their 2020 taxes: 92.8%
Here:
93%
State:
94%
(% for various income ranges: 91.7% for AGIs below $25k, 87.5% for AGIs $25k-50k, 100.0% for AGIs $50k-75k, 87.5% for AGIs $75k-100k, 100.0% for AGIs $100k-200k, 100.0% for AGIs over 200k)
Averages for the 2012 tax year for zip code 46764, filed in 2013:
Average Adjusted Gross Income (AGI) in 2012: $47,236 (Individual Income Tax Returns)
Here:
$47,236
State:
$52,932
Salary/wage: $43,320 (reported on 84.4% of returns)
Here:
$43,320
State:
$45,173
(% of AGI for various income ranges: 74.4% for AGIs below $25k, 76.3% for AGIs $25k-50k, 87.7% for AGIs $50k-75k, 90.8% for AGIs $75k-100k, 63.0% for AGIs $100k-200k)
Taxable interest for individuals: $1,029 (reported on 32.8% of returns)
This zip code:
$1,029
Indiana:
$1,311
(% of AGI for various income ranges: 1.8% for AGIs below $25k, 1.6% for AGIs $25k-50k, 0.2% for AGIs $50k-75k, 0.1% for AGIs $75k-100k, 0.6% for AGIs $100k-200k)
Ordinary dividends: $2,778 (reported on 14.1% of returns)
Here:
$2,778
State:
$4,690
(% of AGI for various income ranges: 0.8% for AGIs below $25k, 0.5% for AGIs $25k-50k, 0.1% for AGIs $50k-75k, 2.0% for AGIs $100k-200k)
Net capital gain/loss in AGI: +$3,600 (reported on 12.5% of returns)
Here:
+$3,600
State:
+$10,406
(% of AGI for various income ranges: 0.3% for AGIs below $25k, 3.2% for AGIs $100k-200k)
Profit/loss from business: +$7,150 (reported on 15.6% of returns)
Here:
+$7,150
State:
+$11,105
(% of AGI for various income ranges: 5.3% for AGIs below $25k, 3.7% for AGIs $25k-50k, 3.1% for AGIs $50k-75k, 2.4% for AGIs $75k-100k)
Taxable individual retirement arrangement distribution: $9,000 (reported on 7.8% of returns)
46764:
$9,000
Indiana:
$13,841
Total itemized deductions: $16,227 (19% of AGI, reported on 23.4% of returns)
Here:
$16,227
State:
$20,913
Here:
19.0% of AGI
State:
18.2% of AGI
(% of AGI for various income ranges: 9.3% for AGIs $25k-50k, 6.8% for AGIs $50k-75k, 9.5% for AGIs $75k-100k, 10.1% for AGIs $100k-200k)
Charity contributions: $3,678 (reported on 14.1% of returns)
Here:
$3,678
State:
$4,697
(% of AGI for various income ranges: 0.9% for AGIs below $25k, 1.0% for AGIs $50k-75k, 1.3% for AGIs $75k-100k, 1.7% for AGIs $100k-200k)
Taxes paid: $5,240 (reported on 23.4% of returns)
46764:
$5,240
State:
$7,456
(% of AGI for various income ranges: 2.0% for AGIs $25k-50k, 1.9% for AGIs $50k-75k, 3.2% for AGIs $75k-100k, 3.9% for AGIs $100k-200k)
Earned income credit: $1,873 (reported on 17.2% of returns)
Here:
$1,873
State:
$2,265
(% of AGI for various income ranges: 4.5% for AGIs below $25k, 1.4% for AGIs $25k-50k)
Percentage of individuals using paid preparers for their 2012 taxes: 62.5%
Here:
62%
State:
53%
(% for various income ranges: 60.0% for AGIs below $25k, 66.7% for AGIs $25k-50k, 58.3% for AGIs $50k-75k, 66.7% for AGIs $75k-100k, 66.7% for AGIs $100k-200k)
Averages for the 2004 tax year for zip code 46764, filed in 2005:
Average Adjusted Gross Income (AGI) in 2004: $38,086 (Individual Income Tax Returns)
Here:
$38,086
State:
$44,790
Salary/wage: $35,173 (reported on 87.7% of returns)
Here:
$35,173
State:
$39,615
(% of AGI for various income ranges: 94.9% for AGIs below $10k, 86.9% for AGIs $10k-25k, 86.3% for AGIs $25k-50k, 90.0% for AGIs $50k-75k, 90.5% for AGIs $75k-100k, 50.3% for AGIs over 100k)
Taxable interest for individuals: $877 (reported on 43.6% of returns)
This zip code:
$877
Indiana:
$1,535
(% of AGI for various income ranges: 5.9% for AGIs below $10k, 1.4% for AGIs $10k-25k, 1.6% for AGIs $25k-50k, 0.4% for AGIs $50k-75k, 0.2% for AGIs $75k-100k, 1.1% for AGIs over 100k)
Taxable dividends: $771 (reported on 20.1% of returns)
Here:
$771
State:
$2,998
(% of AGI for various income ranges: 0.5% for AGIs below $10k, 0.2% for AGIs $10k-25k, 0.3% for AGIs $25k-50k, 0.2% for AGIs $50k-75k, 0.2% for AGIs $75k-100k, 1.1% for AGIs over 100k)
Net capital gain/loss: +$5,404 (reported on 13.7% of returns)
Here:
+$5,404
State:
+$8,619
(% of AGI for various income ranges: -1.8% for AGIs below $10k, -0.6% for AGIs $10k-25k, 0.7% for AGIs $25k-50k, -0.0% for AGIs $50k-75k, 9.3% for AGIs over 100k)
Profit/loss from business: +$5,053 (reported on 14.4% of returns)
Here:
+$5,053
State:
+$10,071
(% of AGI for various income ranges: 8.4% for AGIs below $10k, 1.2% for AGIs $10k-25k, 3.8% for AGIs $25k-50k, 0.3% for AGIs $50k-75k, 4.1% for AGIs $75k-100k)
IRA payment deduction: $1,727 (reported on 1.7% of returns)
46764:
$1,727
Indiana:
$2,840
Total itemized deductions: $14,703 (21% of AGI, reported on 29.4% of returns)
Here:
$14,703
State:
$17,065
Here:
21.4% of AGI
State:
19.5% of AGI
(% of AGI for various income ranges: 6.0% for AGIs $10k-25k, 12.1% for AGIs $25k-50k, 11.8% for AGIs $50k-75k, 13.5% for AGIs $75k-100k, 12.2% for AGIs over 100k)
Charity contributions deductions: $2,352 (3% of AGI, reported on 21.8% of returns)
Here:
$2,352
State:
$3,550
Here:
3.4% of AGI
State:
3.8% of AGI
(% of AGI for various income ranges: 1.6% for AGIs $25k-50k, 1.2% for AGIs $50k-75k, 1.9% for AGIs $75k-100k, 1.7% for AGIs over 100k)
Total tax: $4,488 (reported on 75.5% of returns)
46764:
$4,488
State:
$6,914
(% of AGI for various income ranges: 2.9% for AGIs below $10k, 4.3% for AGIs $10k-25k, 6.7% for AGIs $25k-50k, 7.3% for AGIs $50k-75k, 9.0% for AGIs $75k-100k, 16.7% for AGIs over 100k)
Earned income credit: $1,526 (reported on 14.6% of returns)
Here:
$1,526
State:
$1,685
Percentage of individuals using paid preparers for their 2004 taxes: 64.3%
Here:
64%
State:
59%
(% for various income ranges: 52.2% for AGIs below $10k, 64.1% for AGIs $10k-25k, 73.6% for AGIs $25k-50k, 66.1% for AGIs $50k-75k, 60.0% for AGIs $75k-100k, 77.4% for AGIs over 100k)
Household received Food Stamps/SNAP in the past 12 months: 29 Household did not receive Food Stamps/SNAP in the past 12 months: 437
Women who had a birth in the past 12 months: 18 (19 now married, 0 unmarried) Women who did not have a birth in the past 12 months: 401 (202 now married, 199 unmarried)
Housing units in zip code 46764 with a mortgage: 346 (103 second mortgage, 15 both second mortgage and home equity loan) Houses without a mortgage: 21
Median monthly owner costs for units with a mortgage: $1,319 Median monthly owner costs for units without a mortgage: $341
Residents with income below the poverty level in 2022:
This zip code:
15.9%
Whole state:
12.6%
Residents with income below 50% of the poverty level in 2022:
This zip code:
5.6%
Whole state:
6.3%
Median number of rooms in houses and condos:
Here:
6.1
State:
6.6
Median number of rooms in apartments:
Here:
5.6
State:
4.3
Notable locations in this zip code not listed on our city pages
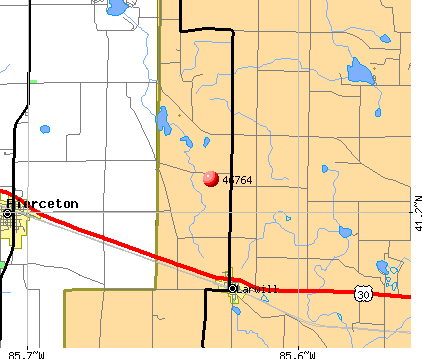
Lakes and reservoirs: Larwill Lake (A), Baugher Lake (B), Rine Lake (C), Tadpole Lake (D), Robinson Lake (E), Souder Lake (F), Indian Lake (G). Display/hide their locations on the map
449 married couples with children.
36 single-parent households (33 men, 3 women).
93.5% of residents of 46764 zip code speak English at home.
4.7% of residents speak Spanish at home (95% very well, 3% not well, 2% not at all).
0.8% of residents speak other Indo-European language at home (100% very well).
Foreign born population: 30 (2.1%) (51.2% of them are naturalized citizens)
This zip code:
2.1%
Whole state:
6.1%
53%Honduras
27%China, excluding Hong Kong and Taiwan
40%English
19%German
6%Belgian
5%European
3%Irish
2%Italian
2%American
Year of entry for the foreign-born population
12010 or later
12000 to 2009
231990 to 1999
1Before 1990
Facilities with environmental interests located in this zip code:
AMOCO FERTILIZER PLT (CTR OF TOWN in LARWILL, IN)
STATE MASTER (Indiana facility tracking) (Resource Conservation and Recovery Act (tracking hazardous waste))
Housing units lacking complete plumbing facilities: 1.8% Housing units lacking complete kitchen facilities: 0.9%
45.5%Electricity
36.7%Bottled, tank, or LP gas
8.6%Utility gas
4.9%Fuel oil, kerosene, etc.
2.4%Wood
2.4%No fuel used
Population in 1990: 1,496.
Place of birth for U.S.-born residents:
This state: 1,283
Northeast: 39
Midwest: 57
South: 48
West: 27
66% of the 46764 zip code residents lived in the same house 5 years ago. Out of people who lived in different houses, 28% lived in this county. Out of people who lived in different counties, 50% lived in Indiana.
91% of the 46764 zip code residents lived in the same house 1 year ago. Out of people who lived in different houses, 1% moved from this county. Out of people who lived in different houses, 100% moved from different county within same state. Out of people who lived in different houses, 1% moved from abroad.
Private vs. public school enrollment:
Students in private schools in grades 1 to 8 (elementary and middle school): 17
Here:
8.8%
Indiana:
14.9%
Students in private schools in grades 9 to 12 (high school): 2
Here:
1.8%
Indiana:
11.4%
Students in private undergraduate colleges:
Here:
0.0%
Indiana:
22.3%
Occupation by median earnings in the past 12 months ($)
88,566Computer and mathematical occupations
84,009Management occupations
60,026Health diagnosing and treating practitioners and other technical occupations
52,880Education, training, and library occupations
51,322Transportation occupations
50,024Installation, maintenance, and repair occupations
Top industries in this zip code by the number of employees in 2005:
Health Care and Social Assistance: Residential Mental Retardation Facilities (20-49 employees: 1 establishment)
Other Services (except Public Administration): Beauty Salons (5-9: 1)
Professional, Scientific, and Technical Services: Veterinary Services (1-4: 1)
Administrative and Support and Waste Management and Remediation Services: Landscaping Services (1-4: 1)
Wholesale Trade: Industrial Machinery and Equipment Merchant Wholesalers (1-4: 1)
Construction: New Single-Family Housing Construction (except Operative Builders) (1-4: 1)
Construction: Site Preparation Contractors (1-4: 1)
People in group quarters in 2000:
16 people in homes for the mentally retarded
Home Mortgage Disclosure Act Aggregated Statistics For Year 2009 (Based on 4 partial tracts)
A) FHA, FSA/RHS & VA Home Purchase Loans
B) Conventional Home Purchase Loans
C) Refinancings
D) Home Improvement Loans
F) Non-occupant Loans on < 5 Family Dwellings (A B C & D)
G) Loans On Manufactured Home Dwelling (A B C & D)
Number
Average Value
Number
Average Value
Number
Average Value
Number
Average Value
Number
Average Value
Number
Average Value
LOANS ORIGINATED
16
$119,601
25
$115,217
167
$134,809
9
$67,321
16
$133,538
6
$74,147
APPLICATIONS APPROVED, NOT ACCEPTED
0
$0
2
$88,275
12
$129,027
1
$4,670
0
$0
1
$121,400
APPLICATIONS DENIED
3
$123,710
5
$78,546
36
$132,137
2
$27,590
2
$60,975
3
$76,583
APPLICATIONS WITHDRAWN
3
$134,990
3
$70,350
27
$144,857
2
$69,875
0
$0
1
$63,320
FILES CLOSED FOR INCOMPLETENESS
1
$72,380
2
$105,895
7
$183,026
0
$0
0
$0
0
$0
Aggregated Statistics For Year 2008 (Based on 4 partial tracts)
A) FHA, FSA/RHS & VA Home Purchase Loans
B) Conventional Home Purchase Loans
C) Refinancings
D) Home Improvement Loans
F) Non-occupant Loans on < 5 Family Dwellings (A B C & D)
G) Loans On Manufactured Home Dwelling (A B C & D)
Number
Average Value
Number
Average Value
Number
Average Value
Number
Average Value
Number
Average Value
Number
Average Value
LOANS ORIGINATED
12
$109,742
31
$127,920
80
$123,264
9
$56,066
10
$132,385
8
$85,425
APPLICATIONS APPROVED, NOT ACCEPTED
0
$0
4
$112,968
11
$110,055
2
$62,625
1
$101,810
1
$199,960
APPLICATIONS DENIED
6
$99,038
7
$104,244
41
$136,657
8
$36,434
2
$90,940
4
$89,680
APPLICATIONS WITHDRAWN
1
$109,280
3
$178,120
21
$140,343
3
$51,747
0
$0
0
$0
FILES CLOSED FOR INCOMPLETENESS
1
$92,410
2
$147,165
5
$124,420
2
$47,295
0
$0
0
$0
Aggregated Statistics For Year 2007 (Based on 4 partial tracts)
A) FHA, FSA/RHS & VA Home Purchase Loans
B) Conventional Home Purchase Loans
C) Refinancings
D) Home Improvement Loans
F) Non-occupant Loans on < 5 Family Dwellings (A B C & D)
G) Loans On Manufactured Home Dwelling (A B C & D)
Number
Average Value
Number
Average Value
Number
Average Value
Number
Average Value
Number
Average Value
Number
Average Value
LOANS ORIGINATED
7
$101,166
66
$115,912
89
$111,191
15
$53,723
15
$113,876
10
$84,373
APPLICATIONS APPROVED, NOT ACCEPTED
0
$0
7
$113,747
16
$124,091
4
$27,720
2
$43,205
2
$81,775
APPLICATIONS DENIED
1
$124,580
14
$123,289
61
$110,698
9
$49,348
5
$59,890
3
$92,990
APPLICATIONS WITHDRAWN
1
$153,270
5
$131,758
21
$132,471
1
$65,180
2
$128,715
2
$30,960
FILES CLOSED FOR INCOMPLETENESS
0
$0
2
$73,985
10
$163,439
0
$0
0
$0
0
$0
Aggregated Statistics For Year 2006 (Based on 4 partial tracts)
A) FHA, FSA/RHS & VA Home Purchase Loans
B) Conventional Home Purchase Loans
C) Refinancings
D) Home Improvement Loans
F) Non-occupant Loans on < 5 Family Dwellings (A B C & D)
G) Loans On Manufactured Home Dwelling (A B C & D)
Number
Average Value
Number
Average Value
Number
Average Value
Number
Average Value
Number
Average Value
Number
Average Value
LOANS ORIGINATED
10
$86,351
77
$112,783
91
$104,535
18
$30,931
14
$96,714
9
$89,762
APPLICATIONS APPROVED, NOT ACCEPTED
0
$0
8
$107,636
22
$107,834
3
$41,060
1
$95,170
2
$71,420
APPLICATIONS DENIED
0
$0
18
$94,731
66
$115,997
11
$56,394
3
$123,920
7
$58,941
APPLICATIONS WITHDRAWN
0
$0
5
$104,202
39
$109,432
1
$98,700
2
$142,305
1
$51,990
FILES CLOSED FOR INCOMPLETENESS
0
$0
3
$137,100
13
$115,240
0
$0
0
$0
0
$0
Aggregated Statistics For Year 2005 (Based on 4 partial tracts)
A) FHA, FSA/RHS & VA Home Purchase Loans
B) Conventional Home Purchase Loans
C) Refinancings
D) Home Improvement Loans
F) Non-occupant Loans on < 5 Family Dwellings (A B C & D)
G) Loans On Manufactured Home Dwelling (A B C & D)
Number
Average Value
Number
Average Value
Number
Average Value
Number
Average Value
Number
Average Value
Number
Average Value
LOANS ORIGINATED
7
$90,349
82
$110,855
107
$110,160
18
$52,118
13
$102,802
11
$77,296
APPLICATIONS APPROVED, NOT ACCEPTED
1
$179,700
11
$83,694
19
$107,568
2
$49,075
1
$46,390
3
$92,793
APPLICATIONS DENIED
3
$80,457
22
$90,029
87
$111,369
15
$32,745
6
$103,938
11
$64,311
APPLICATIONS WITHDRAWN
1
$116,060
8
$105,008
54
$128,424
5
$115,370
2
$161,900
2
$129,480
FILES CLOSED FOR INCOMPLETENESS
0
$0
5
$81,348
6
$138,260
0
$0
0
$0
0
$0
Aggregated Statistics For Year 2004 (Based on 4 partial tracts)
A) FHA, FSA/RHS & VA Home Purchase Loans
B) Conventional Home Purchase Loans
C) Refinancings
D) Home Improvement Loans
F) Non-occupant Loans on < 5 Family Dwellings (A B C & D)
G) Loans On Manufactured Home Dwelling (A B C & D)
Number
Average Value
Number
Average Value
Number
Average Value
Number
Average Value
Number
Average Value
Number
Average Value
LOANS ORIGINATED
7
$106,279
63
$116,556
142
$104,191
19
$44,473
20
$95,180
9
$68,853
APPLICATIONS APPROVED, NOT ACCEPTED
0
$0
7
$104,270
17
$109,022
2
$8,055
1
$142,210
0
$0
APPLICATIONS DENIED
3
$105,810
15
$87,422
83
$107,869
10
$20,125
6
$85,207
5
$84,104
APPLICATIONS WITHDRAWN
0
$0
5
$103,948
59
$128,924
2
$21,710
2
$67,035
4
$85,788
FILES CLOSED FOR INCOMPLETENESS
0
$0
2
$117,345
11
$109,975
1
$151,470
0
$0
0
$0
Aggregated Statistics For Year 2003 (Based on 4 partial tracts)
A) FHA, FSA/RHS & VA Home Purchase Loans
B) Conventional Home Purchase Loans
C) Refinancings
D) Home Improvement Loans
F) Non-occupant Loans on < 5 Family Dwellings (A B C & D)
Detailed PMIC statistics for the following Tracts:0502.00
, 0503.00
2002 - 2015 National Fire Incident Reporting System (NFIRS) incidents
Based on the data from the years 2002 - 2015 the average number of fire incidents per year is 14. The highest number of reported fires - 26 took place in 2007, and the least - 0 in 2014. The data has a dropping trend.
When looking into fire subcategories, the most incidents belonged to: Outside Fires (44.0%), and Structure Fires (40.4%).
Fire incident types reported to NFIRS in Zip Code 46764

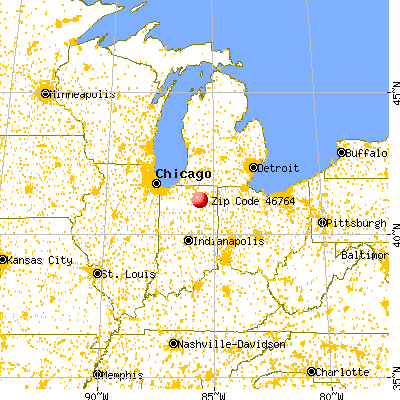


 Nearest zip codes: 46562, 46555, 46760, 46732, 46787, 46725.


 Based on the data from the years 2002 - 2015 the average number of fire incidents per year is 14. The highest number of reported fires - 26 took place in 2007, and the least - 0 in 2014. The data has a dropping trend.
 When looking into fire subcategories, the most incidents belonged to: Outside Fires (44.0%), and Structure Fires (40.4%).