Estimated zip code population in 2022: 2,738 Zip code population in 2010: 2,306 Zip code population in 2000: 2,180
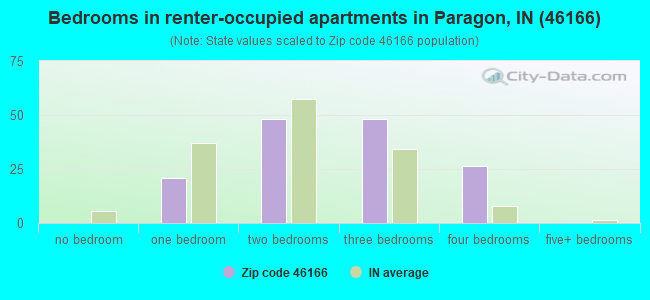
Houses and condos: 1,142 Renter-occupied apartments: 142
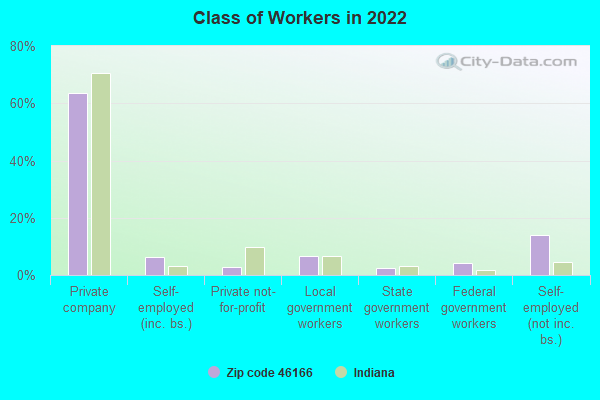
% of renters here:
15%
State:
29%
March 2022 cost of living index in zip code 46166: 85.1 (less than average, U.S. average is 100)
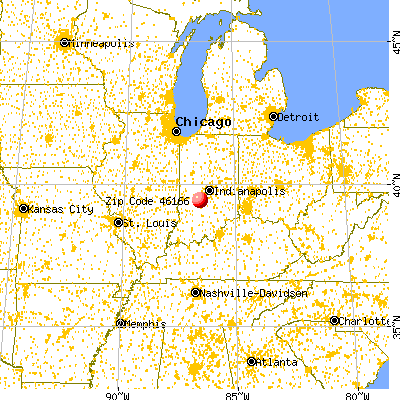
Land area: 34.9 sq. mi. Water area: 0.1 sq. mi.
Population density: 78 people per square mile
(very low).
OSM Map
General Map
Google Map
MSN Map
OSM Map
General Map
Google Map
MSN Map
OSM Map
General Map
Google Map
MSN Map
OSM Map
General Map
Google Map
MSN Map
Please wait while loading the map...
Real estate property taxes paid for housing units in 2022:
This zip code:
0.4% ($626)
Indiana:
0.7% ($1,467)
Median real estate property taxes paid for housing units with mortgages in 2022: $785 (0.5%) Median real estate property taxes paid for housing units with no mortgage in 2022: $469 (0.3%)
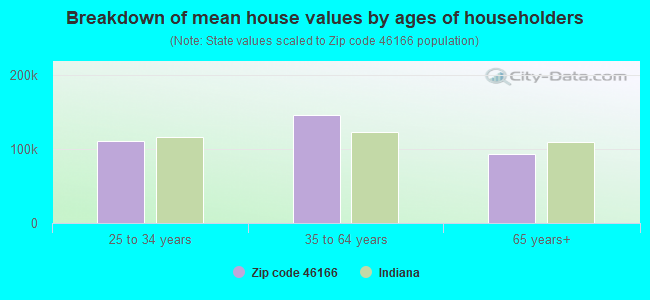
Estimated median house/condo value in 2022: $167,437
46166:
$167,437
Indiana:
$208,700
According to our research of Indiana and other state lists, there were 2 registered sex offenders living in 46166 zip code as of July 03, 2024. The ratio of all residents to sex offenders in zip code 46166 is 923 to 1. The ratio of registered sex offenders to all residents in this zip code is lower than the state average.
Median resident age:
This zip code:
38.8 years
Indiana median age:
38.2 years
Average household size:
This zip code:
2.9 people
Indiana:
2.4 people
Averages for the 2020 tax year for zip code 46166, filed in 2021:
Average Adjusted Gross Income (AGI) in 2020: $49,405 (Individual Income Tax Returns)
Here:
$49,405
State:
$64,978
Salary/wage: $45,524 (reported on 83.1% of returns)
Here:
$45,524
State:
$55,245
(% of AGI for various income ranges: 992.4% for AGIs below $25k, 3692.4% for AGIs $25k-50k, 6874.6% for AGIs $50k-75k, 9647.0% for AGIs $75k-100k, 17401.2% for AGIs $100k-200k)
Taxable interest for individuals: $455 (reported on 18.6% of returns)
This zip code:
$455
Indiana:
$1,351
(% of AGI for various income ranges: 10.0% for AGIs below $25k, 5.2% for AGIs $25k-50k, 15.4% for AGIs $50k-75k, 3.0% for AGIs $75k-100k, 43.8% for AGIs $100k-200k)
Ordinary dividends: $1,200 (reported on 5.9% of returns)
Here:
$1,200
State:
$5,827
(% of AGI for various income ranges: 20.8% for AGIs $25k-50k, 40.0% for AGIs $100k-200k)
Net capital gain/loss in AGI: +$5,712 (reported on 6.8% of returns)
Here:
+$5,712
State:
+$17,730
(% of AGI for various income ranges: 28.4% for AGIs $25k-50k, 26.2% for AGIs $50k-75k, 440.0% for AGIs $100k-200k)
Profit/loss from business: +$6,927 (reported on 12.7% of returns)
Here:
+$6,927
State:
+$12,144
(% of AGI for various income ranges: 87.2% for AGIs below $25k, 101.2% for AGIs $25k-50k, 356.9% for AGIs $50k-75k, 86.2% for AGIs $100k-200k)
Taxable individual retirement arrangement distribution: $20,843 (reported on 5.9% of returns)
46166:
$20,843
Indiana:
$18,302
(% of AGI for various income ranges: 62.4% for AGIs below $25k, 118.0% for AGIs $25k-50k, 983.0% for AGIs $75k-100k)
Total itemized deductions: $30,367 (reported on 2.5% of returns)
Here:
$30,367
State:
$35,601
(% of AGI for various income ranges: 1138.8% for AGIs $100k-200k)
Charity contributions: $9,050 (reported on 1.7% of returns)
Here:
$9,050
State:
$15,596
(% of AGI for various income ranges: 72.4% for AGIs $25k-50k)
Taxes paid: $6,750 (reported on 3.4% of returns)
46166:
$6,750
State:
$7,542
(% of AGI for various income ranges: 337.5% for AGIs $100k-200k)
Earned income credit: $2,205 (reported on 16.9% of returns)
Here:
$2,205
State:
$2,298
(% of AGI for various income ranges: 80.7% for AGIs below $25k, 82.8% for AGIs $25k-50k)
Percentage of individuals using paid preparers for their 2020 taxes: 93.2%
Here:
93%
State:
94%
(% for various income ranges: 90.5% for AGIs below $25k, 93.5% for AGIs $25k-50k, 94.4% for AGIs $50k-75k, 100.0% for AGIs $75k-100k, 92.9% for AGIs $100k-200k)
Averages for the 2012 tax year for zip code 46166, filed in 2013:
Average Adjusted Gross Income (AGI) in 2012: $38,826 (Individual Income Tax Returns)
Here:
$38,826
State:
$52,932
Salary/wage: $35,921 (reported on 86.1% of returns)
Here:
$35,921
State:
$45,173
(% of AGI for various income ranges: 71.0% for AGIs below $25k, 79.6% for AGIs $25k-50k, 81.7% for AGIs $50k-75k, 87.2% for AGIs $75k-100k, 75.7% for AGIs $100k-200k)
Taxable interest for individuals: $331 (reported on 15.8% of returns)
This zip code:
$331
Indiana:
$1,311
(% of AGI for various income ranges: 0.5% for AGIs below $25k, 0.1% for AGIs $50k-75k)
Ordinary dividends: $386 (reported on 6.9% of returns)
Here:
$386
State:
$4,690
Net capital gain/loss in AGI: +$660 (reported on 5.0% of returns)
Here:
+$660
State:
+$10,406
Profit/loss from business: +$9,207 (reported on 14.9% of returns)
Here:
+$9,207
State:
+$11,105
(% of AGI for various income ranges: 9.4% for AGIs below $25k, 3.7% for AGIs $25k-50k, 3.2% for AGIs $50k-75k, 2.9% for AGIs $75k-100k)
Taxable individual retirement arrangement distribution: $5,717 (reported on 5.9% of returns)
46166:
$5,717
Indiana:
$13,841
Total itemized deductions: $15,175 (21% of AGI, reported on 19.8% of returns)
Here:
$15,175
State:
$20,913
Here:
21.2% of AGI
State:
18.2% of AGI
(% of AGI for various income ranges: 7.0% for AGIs $25k-50k, 8.0% for AGIs $50k-75k, 10.4% for AGIs $75k-100k, 11.2% for AGIs $100k-200k)
Charity contributions: $2,700 (reported on 12.9% of returns)
Here:
$2,700
State:
$4,697
(% of AGI for various income ranges: 0.9% for AGIs $25k-50k, 0.9% for AGIs $50k-75k, 1.1% for AGIs $75k-100k, 1.4% for AGIs $100k-200k)
Taxes paid: $4,820 (reported on 19.8% of returns)
46166:
$4,820
State:
$7,456
(% of AGI for various income ranges: 1.5% for AGIs $25k-50k, 2.1% for AGIs $50k-75k, 3.7% for AGIs $75k-100k, 4.7% for AGIs $100k-200k)
Earned income credit: $2,346 (reported on 23.8% of returns)
Here:
$2,346
State:
$2,265
(% of AGI for various income ranges: 8.3% for AGIs below $25k, 1.3% for AGIs $25k-50k)
Percentage of individuals using paid preparers for their 2012 taxes: 62.4%
Here:
62%
State:
53%
(% for various income ranges: 61.4% for AGIs below $25k, 65.4% for AGIs $25k-50k, 56.2% for AGIs $50k-75k, 66.7% for AGIs $75k-100k, 66.7% for AGIs $100k-200k)
Averages for the 2004 tax year for zip code 46166, filed in 2005:
Average Adjusted Gross Income (AGI) in 2004: $36,220 (Individual Income Tax Returns)
Here:
$36,220
State:
$44,790
Salary/wage: $33,974 (reported on 88.4% of returns)
Here:
$33,974
State:
$39,615
(% of AGI for various income ranges: 90.2% for AGIs below $10k, 77.3% for AGIs $10k-25k, 82.7% for AGIs $25k-50k, 84.9% for AGIs $50k-75k, 91.3% for AGIs $75k-100k, 70.5% for AGIs over 100k)
Taxable interest for individuals: $637 (reported on 29.6% of returns)
This zip code:
$637
Indiana:
$1,535
(% of AGI for various income ranges: 7.3% for AGIs below $10k, 0.8% for AGIs $10k-25k, 0.4% for AGIs $25k-50k, 0.3% for AGIs $50k-75k, 0.3% for AGIs $75k-100k, 0.1% for AGIs over 100k)
Taxable dividends: $266 (reported on 8.2% of returns)
Here:
$266
State:
$2,998
(% of AGI for various income ranges: 0.3% for AGIs below $10k, 0.1% for AGIs $25k-50k, 0.0% for AGIs $50k-75k, 0.0% for AGIs $75k-100k)
Net capital gain/loss: +$3,222 (reported on 6.6% of returns)
Here:
+$3,222
State:
+$8,619
(% of AGI for various income ranges: 1.5% for AGIs below $10k, 0.7% for AGIs $25k-50k, 0.2% for AGIs $50k-75k, 1.7% for AGIs $75k-100k)
Profit/loss from business: +$6,493 (reported on 15.8% of returns)
Here:
+$6,493
State:
+$10,071
(% of AGI for various income ranges: -3.0% for AGIs below $10k, 7.2% for AGIs $10k-25k, 3.2% for AGIs $25k-50k, 4.0% for AGIs $50k-75k, 0.4% for AGIs $75k-100k)
IRA payment deduction: $2,278 (reported on 1.9% of returns)
46166:
$2,278
Indiana:
$2,840
Total itemized deductions: $14,348 (23% of AGI, reported on 25.8% of returns)
Here:
$14,348
State:
$17,065
Here:
23.3% of AGI
State:
19.5% of AGI
(% of AGI for various income ranges: 6.3% for AGIs $10k-25k, 10.0% for AGIs $25k-50k, 9.7% for AGIs $50k-75k, 14.1% for AGIs $75k-100k, 11.2% for AGIs over 100k)
Charity contributions deductions: $1,965 (3% of AGI, reported on 17.8% of returns)
Here:
$1,965
State:
$3,550
Here:
3.2% of AGI
State:
3.8% of AGI
(% of AGI for various income ranges: 0.5% for AGIs $10k-25k, 0.9% for AGIs $25k-50k, 1.2% for AGIs $50k-75k, 1.0% for AGIs $75k-100k, 1.2% for AGIs over 100k)
Total tax: $4,294 (reported on 70.5% of returns)
46166:
$4,294
State:
$6,914
(% of AGI for various income ranges: 3.0% for AGIs below $10k, 4.0% for AGIs $10k-25k, 6.0% for AGIs $25k-50k, 8.8% for AGIs $50k-75k, 10.4% for AGIs $75k-100k, 15.2% for AGIs over 100k)
Earned income credit: $1,803 (reported on 20.1% of returns)
Here:
$1,803
State:
$1,685
Percentage of individuals using paid preparers for their 2004 taxes: 64.9%
Here:
65%
State:
59%
(% for various income ranges: 54.5% for AGIs below $10k, 68.2% for AGIs $10k-25k, 69.0% for AGIs $25k-50k, 61.4% for AGIs $50k-75k, 74.7% for AGIs $75k-100k, 59.4% for AGIs over 100k)
Likely homosexual households (counted as self-reported same-sex unmarried-partner households)
Lesbian couples: 0.6% of all households
Gay men: 0.0% of all households
Household received Food Stamps/SNAP in the past 12 months: 62 Household did not receive Food Stamps/SNAP in the past 12 months: 894
Women who had a birth in the past 12 months: 20 (6 now married, 11 unmarried) Women who did not have a birth in the past 12 months: 627 (338 now married, 289 unmarried)
Housing units in zip code 46166 with a mortgage: 498 (20 second mortgage, 5 home equity loan, 16 both second mortgage and home equity loan) Houses without a mortgage: 6
Median monthly owner costs for units with a mortgage: $1,222 Median monthly owner costs for units without a mortgage: $468
Residents with income below the poverty level in 2022:
This zip code:
8.3%
Whole state:
12.6%
Residents with income below 50% of the poverty level in 2022:
This zip code:
2.5%
Whole state:
6.3%
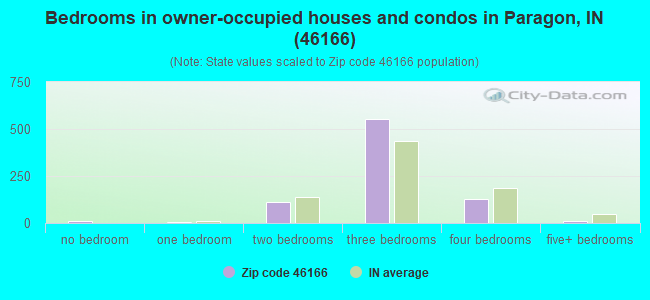
Median number of rooms in houses and condos:
Here:
6.5
State:
6.6
Median number of rooms in apartments:
Here:
5.1
State:
4.3
Notable locations in this zip code not listed on our city pages
Size of family households: 290 2-persons, 267 3-persons, 111 4-persons, 76 5-persons, 17 6-persons, 17 7-or-more-persons
Size of nonfamily households: 115 1-person, 26 2-persons, 30 3-persons
312 married couples with children.
112 single-parent households (30 men, 82 women).
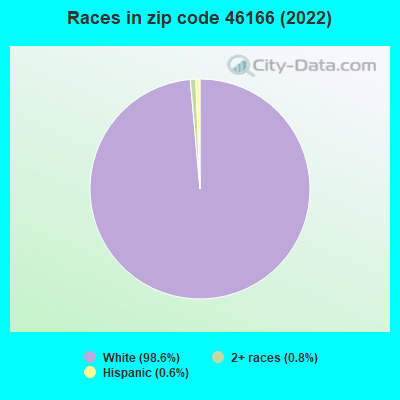
93.9% of residents of 46166 zip code speak English at home.
5.2% of residents speak Spanish at home (100% very well).
0.3% of residents speak other language at home (100% well).
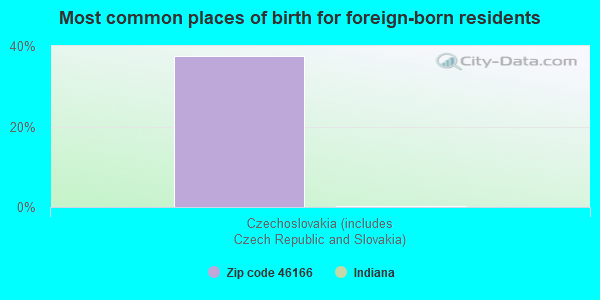
Foreign born population: 8 (0.3%) (0.0% of them are naturalized citizens)
:
0.3%
Whole state:
6.1%
38%Czechoslovakia (includes Czech Republic and Slovakia)
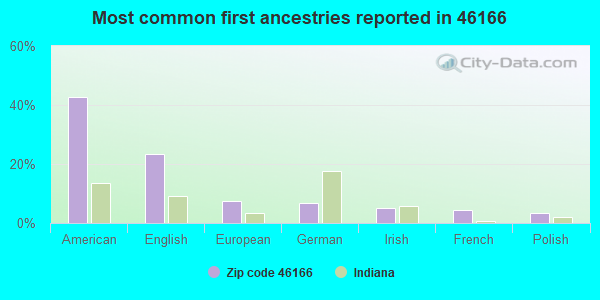
43%American
23%English
7%European
7%German
5%Irish
4%French
3%Polish
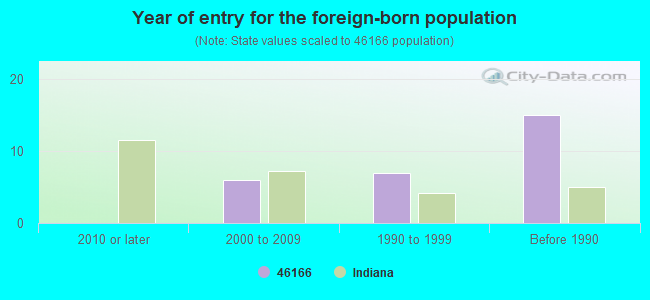
Year of entry for the foreign-born population
02010 or later
62000 to 2009
71990 to 1999
15Before 1990
Facilities with environmental interests located in this zip code:
PARAGON MUNICIPAL WWTP (SR 67 & PARAGON RD in PARAGON, IN)
STATE MASTER (Indiana facility tracking) - IN-NPDES-IN0040479, National Pollutant Discharge Elimination System Permit National Pollutant Discharge Elimination System NON-MAJOR (Tracking pollutant discharge elimination systems) - permit Business SIC classification: SEWERAGE SYSTEMS Organizations: JOHN S TROTTER (CONTACT/OPERATOR)
, TOWN BOARD PRESIDENT (CONTACT/OWNER)
Alternative names: PARAGON MUNICIPAL STP
PORTER CAVE & CAMPGROUND (RR 1 in PARAGON, IN)
(Integrated Compliance Information System) - ICIS-05-1997-0634, FORMAL ENFORCEMENT ACTION STATE MASTER (Indiana facility tracking)
PETRO PLUS-MAGIC MART (399 LIBERTY ST in PARAGON, IN)
Housing units lacking complete plumbing facilities: 4.7% Housing units lacking complete kitchen facilities: 7.6%
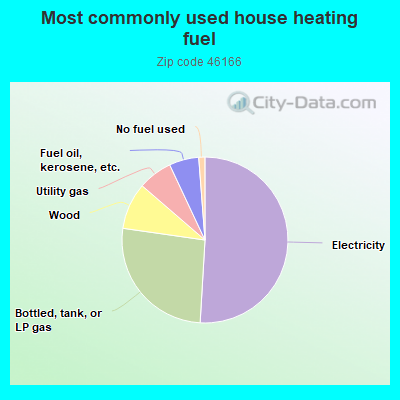
51.1%Electricity
26.4%Bottled, tank, or LP gas
9.1%Wood
6.7%Utility gas
5.8%Fuel oil, kerosene, etc.
1.2%No fuel used
Population in 1990: 1,244. Population change in the 1990s: +936 (+75.2%).
Place of birth for U.S.-born residents:
This state: 2,192
Northeast: 58
Midwest: 68
South: 353
West: 6
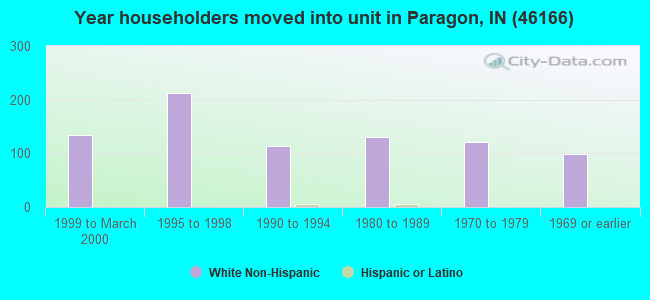
57% of the 46166 zip code residents lived in the same house 5 years ago. Out of people who lived in different houses, 59% lived in this county. Out of people who lived in different counties, 50% lived in Indiana.
91% of the 46166 zip code residents lived in the same house 1 year ago. Out of people who lived in different houses, 39% moved from this county. Out of people who lived in different houses, 22% moved from different county within same state. Out of people who lived in different houses, 40% moved from different state.
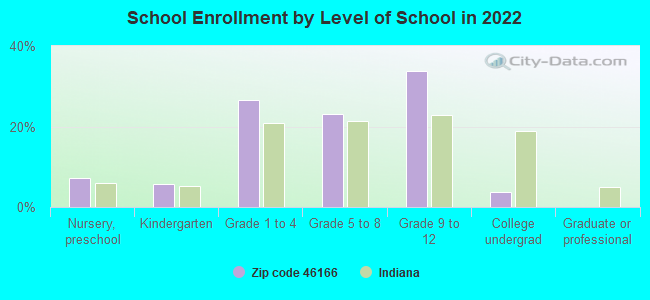
Private vs. public school enrollment:
Students in private schools in grades 1 to 8 (elementary and middle school): 21
Here:
7.8%
Indiana:
14.9%
Students in private schools in grades 9 to 12 (high school): 24
Here:
13.0%
Indiana:
11.4%
Students in private undergraduate colleges:
Here:
0.0%
Indiana:
22.3%
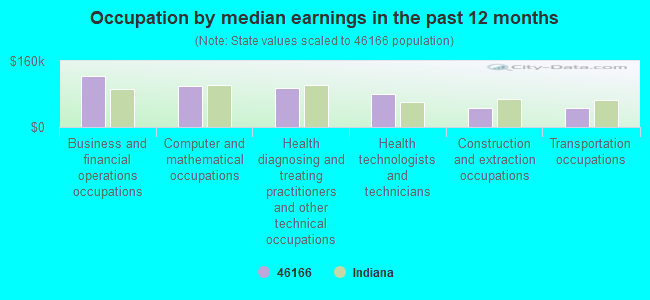
Occupation by median earnings in the past 12 months ($)
122,714Business and financial operations occupations
99,555Computer and mathematical occupations
95,677Health diagnosing and treating practitioners and other technical occupations
78,870Health technologists and technicians
47,218Construction and extraction occupations
45,559Transportation occupations
Top industries in this zip code by the number of employees in 2005:
Wholesale Trade: Construction and Mining (except Oil Well) Machinery and Equipment Merchant Wholesalers (20-49 employees: 1 establishment)
Finance and Insurance: Commercial Banking (5-9: 1)
Construction: Poured Concrete Foundation and Structure Contractors (5-9: 1)
Construction: Electrical Contractors (1-4: 2)
Professional, Scientific, and Technical Services: Engineering Services (1-4: 1)
Construction: Other Building Finishing Contractors (1-4: 1)
Fatal accident statistics in 2012:
Fatal accident count: 1
Vehicles involved in fatal accidents: 1
Fatal accidents caused by drunken drivers: 0
Fatalities: 1
Persons involved in fatal accidents: 3
Pedestrians involved in fatal accidents: 0
Fatal accident statistics in 2010:
Fatal accident count: 1
Vehicles involved in fatal accidents: 3
Fatal accidents caused by drunken drivers: 0
Fatalities: 1
Persons involved in fatal accidents: 6
Pedestrians involved in fatal accidents: 0
Home Mortgage Disclosure Act Aggregated Statistics For Year 2009 (Based on 2 partial tracts)
A) FHA, FSA/RHS & VA Home Purchase Loans
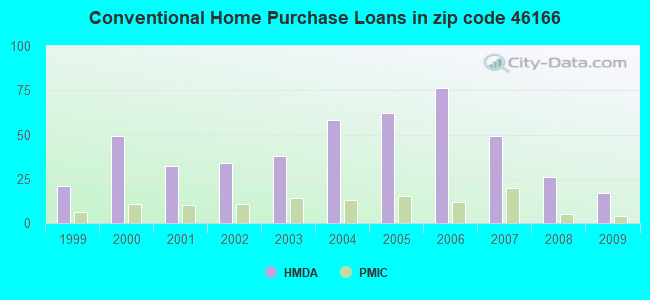
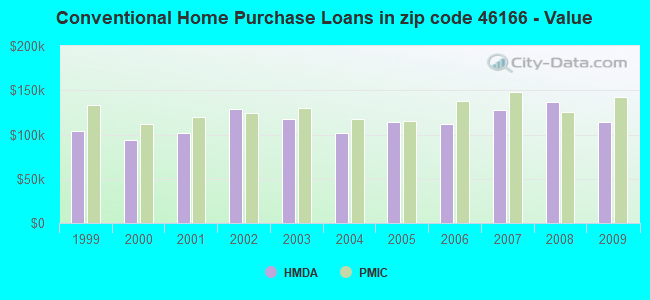
B) Conventional Home Purchase Loans
C) Refinancings
D) Home Improvement Loans
F) Non-occupant Loans on < 5 Family Dwellings (A B C & D)
G) Loans On Manufactured Home Dwelling (A B C & D)
Number
Average Value
Number
Average Value
Number
Average Value
Number
Average Value
Number
Average Value
Number
Average Value
LOANS ORIGINATED
15
$112,011
17
$114,404
99
$134,179
11
$60,892
8
$70,814
11
$77,667
APPLICATIONS APPROVED, NOT ACCEPTED
2
$69,670
1
$102,760
9
$135,994
1
$5,920
0
$0
0
$0
APPLICATIONS DENIED
9
$73,946
9
$56,012
48
$137,818
6
$75,140
2
$53,260
10
$61,709
APPLICATIONS WITHDRAWN
3
$69,940
1
$107,600
27
$121,190
2
$125,355
1
$52,720
3
$63,127
FILES CLOSED FOR INCOMPLETENESS
1
$95,760
0
$0
7
$141,494
1
$62,950
0
$0
1
$48,960
Aggregated Statistics For Year 2008 (Based on 2 partial tracts)
A) FHA, FSA/RHS & VA Home Purchase Loans
B) Conventional Home Purchase Loans
C) Refinancings
D) Home Improvement Loans
F) Non-occupant Loans on < 5 Family Dwellings (A B C & D)
G) Loans On Manufactured Home Dwelling (A B C & D)
Number
Average Value
Number
Average Value
Number
Average Value
Number
Average Value
Number
Average Value
Number
Average Value
LOANS ORIGINATED
19
$142,145
26
$136,424
61
$127,823
12
$56,042
10
$120,082
13
$97,792
APPLICATIONS APPROVED, NOT ACCEPTED
1
$225,960
3
$153,330
12
$118,360
2
$35,510
0
$0
2
$54,070
APPLICATIONS DENIED
5
$131,380
9
$51,828
56
$131,628
11
$31,155
3
$101,860
6
$80,520
APPLICATIONS WITHDRAWN
3
$174,133
3
$97,020
21
$136,729
1
$32,280
1
$76,400
2
$81,505
FILES CLOSED FOR INCOMPLETENESS
3
$91,820
1
$135,580
3
$166,780
1
$2,150
0
$0
1
$78,010
Aggregated Statistics For Year 2007 (Based on 2 partial tracts)
A) FHA, FSA/RHS & VA Home Purchase Loans
B) Conventional Home Purchase Loans
C) Refinancings
D) Home Improvement Loans
E) Loans on Dwellings For 5+ Families
F) Non-occupant Loans on < 5 Family Dwellings (A B C & D)
G) Loans On Manufactured Home Dwelling (A B C & D)
Number
Average Value
Number
Average Value
Number
Average Value
Number
Average Value
Number
Average Value
Number
Average Value
Number
Average Value
LOANS ORIGINATED
13
$107,476
49
$128,011
84
$124,662
23
$30,549
1
$107,600
9
$78,907
13
$89,598
APPLICATIONS APPROVED, NOT ACCEPTED
1
$112,440
5
$94,904
17
$157,096
4
$30,398
0
$0
1
$85,000
3
$82,853
APPLICATIONS DENIED
1
$103,830
16
$82,986
82
$125,242
18
$78,787
0
$0
4
$76,395
9
$76,754
APPLICATIONS WITHDRAWN
1
$137,730
6
$104,193
37
$131,228
3
$118,000
0
$0
2
$102,490
2
$128,045
FILES CLOSED FOR INCOMPLETENESS
1
$68,860
2
$96,840
11
$118,898
0
$0
0
$0
1
$38,740
0
$0
Aggregated Statistics For Year 2006 (Based on 2 partial tracts)
A) FHA, FSA/RHS & VA Home Purchase Loans
B) Conventional Home Purchase Loans
C) Refinancings
D) Home Improvement Loans
F) Non-occupant Loans on < 5 Family Dwellings (A B C & D)
G) Loans On Manufactured Home Dwelling (A B C & D)
Number
Average Value
Number
Average Value
Number
Average Value
Number
Average Value
Number
Average Value
Number
Average Value
LOANS ORIGINATED
13
$128,872
76
$111,649
79
$110,862
26
$54,855
10
$113,572
16
$103,296
APPLICATIONS APPROVED, NOT ACCEPTED
1
$126,970
15
$89,774
28
$128,582
2
$18,025
3
$101,860
2
$105,180
APPLICATIONS DENIED
5
$100,822
26
$84,321
99
$123,925
21
$36,097
3
$77,473
12
$68,326
APPLICATIONS WITHDRAWN
2
$90,115
9
$110,469
48
$135,441
5
$73,276
3
$115,133
2
$75,050
FILES CLOSED FOR INCOMPLETENESS
1
$54,880
1
$38,200
15
$144,471
1
$81,240
0
$0
0
$0
Aggregated Statistics For Year 2005 (Based on 2 partial tracts)
A) FHA, FSA/RHS & VA Home Purchase Loans
B) Conventional Home Purchase Loans
C) Refinancings
D) Home Improvement Loans
F) Non-occupant Loans on < 5 Family Dwellings (A B C & D)
G) Loans On Manufactured Home Dwelling (A B C & D)
Number
Average Value
Number
Average Value
Number
Average Value
Number
Average Value
Number
Average Value
Number
Average Value
LOANS ORIGINATED
9
$108,078
62
$114,230
108
$115,092
22
$47,320
11
$79,868
16
$85,374
APPLICATIONS APPROVED, NOT ACCEPTED
2
$81,505
8
$97,781
23
$120,489
3
$31,023
2
$66,980
5
$78,870
APPLICATIONS DENIED
2
$82,850
24
$105,964
110
$126,655
19
$46,664
10
$71,231
18
$90,623
APPLICATIONS WITHDRAWN
1
$100,070
7
$100,221
60
$122,314
4
$200,675
3
$99,530
4
$77,740
FILES CLOSED FOR INCOMPLETENESS
1
$71,550
5
$174,958
23
$138,243
1
$13,990
1
$100,610
2
$74,780
Aggregated Statistics For Year 2004 (Based on 2 partial tracts)
A) FHA, FSA/RHS & VA Home Purchase Loans
B) Conventional Home Purchase Loans
C) Refinancings
D) Home Improvement Loans
F) Non-occupant Loans on < 5 Family Dwellings (A B C & D)
G) Loans On Manufactured Home Dwelling (A B C & D)
Number
Average Value
Number
Average Value
Number
Average Value
Number
Average Value
Number
Average Value
Number
Average Value
LOANS ORIGINATED
11
$108,285
58
$101,339
130
$114,668
22
$41,842
16
$56,490
15
$74,567
APPLICATIONS APPROVED, NOT ACCEPTED
3
$79,087
9
$110,230
22
$100,410
1
$37,660
3
$84,467
2
$83,930
APPLICATIONS DENIED
5
$92,966
19
$74,159
97
$113,202
17
$36,078
6
$65,905
12
$68,326
APPLICATIONS WITHDRAWN
2
$86,620
8
$98,454
56
$119,042
2
$69,670
4
$62,272
3
$96,123
FILES CLOSED FOR INCOMPLETENESS
1
$45,190
1
$22,060
20
$124,951
1
$97,920
1
$32,280
0
$0
Aggregated Statistics For Year 2003 (Based on 2 partial tracts)
A) FHA, FSA/RHS & VA Home Purchase Loans
B) Conventional Home Purchase Loans
C) Refinancings
D) Home Improvement Loans
F) Non-occupant Loans on < 5 Family Dwellings (A B C & D)
Number
Average Value
Number
Average Value
Number
Average Value
Number
Average Value
Number
Average Value
LOANS ORIGINATED
19
$120,824
38
$118,020
256
$113,245
15
$24,031
12
$83,032
APPLICATIONS APPROVED, NOT ACCEPTED
1
$92,540
9
$101,981
38
$112,952
2
$48,150
3
$62,230
APPLICATIONS DENIED
3
$90,563
15
$99,530
112
$102,628
6
$11,837
5
$103,188
APPLICATIONS WITHDRAWN
1
$152,250
8
$110,222
51
$109,415
2
$14,255
2
$62,410
FILES CLOSED FOR INCOMPLETENESS
1
$158,710
2
$78,550
9
$118,719
1
$13,450
0
$0
Aggregated Statistics For Year 2002 (Based on 2 partial tracts)
A) FHA, FSA/RHS & VA Home Purchase Loans
B) Conventional Home Purchase Loans
C) Refinancings
D) Home Improvement Loans
F) Non-occupant Loans on < 5 Family Dwellings (A B C & D)
Number
Average Value
Number
Average Value
Number
Average Value
Number
Average Value
Number
Average Value
LOANS ORIGINATED
23
$107,670
34
$128,566
199
$108,073
16
$22,596
15
$67,143
APPLICATIONS APPROVED, NOT ACCEPTED
2
$62,140
5
$83,606
29
$119,288
3
$16,500
2
$65,905
APPLICATIONS DENIED
2
$93,880
18
$102,250
80
$99,537
10
$25,824
4
$94,552
APPLICATIONS WITHDRAWN
1
$145,800
9
$91,460
48
$105,022
3
$22,777
3
$81,060
FILES CLOSED FOR INCOMPLETENESS
1
$61,870
2
$57,565
18
$99,201
1
$32,280
1
$89,310
Aggregated Statistics For Year 2001 (Based on 2 partial tracts)
A) FHA, FSA/RHS & VA Home Purchase Loans
B) Conventional Home Purchase Loans
C) Refinancings
D) Home Improvement Loans
F) Non-occupant Loans on < 5 Family Dwellings (A B C & D)
Number
Average Value
Number
Average Value
Number
Average Value
Number
Average Value
Number
Average Value
LOANS ORIGINATED
21
$114,953
32
$101,262
202
$106,481
17
$14,051
10
$83,551
APPLICATIONS APPROVED, NOT ACCEPTED
1
$97,920
4
$99,395
37
$89,061
3
$18,113
1
$39,810
APPLICATIONS DENIED
2
$82,585
12
$74,333
114
$97,963
16
$13,114
3
$71,553
APPLICATIONS WITHDRAWN
1
$57,030
6
$127,417
39
$89,667
5
$6,778
1
$29,590
FILES CLOSED FOR INCOMPLETENESS
0
$0
2
$77,205
16
$92,401
0
$0
0
$0
Aggregated Statistics For Year 2000 (Based on 2 partial tracts)
A) FHA, FSA/RHS & VA Home Purchase Loans
B) Conventional Home Purchase Loans
C) Refinancings
D) Home Improvement Loans
F) Non-occupant Loans on < 5 Family Dwellings (A B C & D)
Number
Average Value
Number
Average Value
Number
Average Value
Number
Average Value
Number
Average Value
LOANS ORIGINATED
20
$105,125
49
$93,557
79
$81,762
22
$29,541
8
$101,682
APPLICATIONS APPROVED, NOT ACCEPTED
1
$98,450
7
$65,021
27
$70,837
7
$13,604
2
$37,930
APPLICATIONS DENIED
2
$128,850
20
$50,652
61
$75,496
11
$21,031
4
$112,578
APPLICATIONS WITHDRAWN
2
$76,665
10
$83,713
22
$90,824
3
$9,683
1
$41,960
FILES CLOSED FOR INCOMPLETENESS
0
$0
2
$43,040
8
$72,698
0
$0
1
$23,670
Aggregated Statistics For Year 1999 (Based on 1 partial tract)
A) FHA, FSA/RHS & VA Home Purchase Loans
B) Conventional Home Purchase Loans
C) Refinancings
D) Home Improvement Loans
F) Non-occupant Loans on < 5 Family Dwellings (A B C & D)
Detailed PMIC statistics for the following Tracts:5110.00
2002 - 2018 National Fire Incident Reporting System (NFIRS) incidents
Based on the data from the years 2002 - 2018 the average number of fire incidents per year is 23. The highest number of reported fires - 71 took place in 2010, and the least - 3 in 2016. The data has a declining trend.
When looking into fire subcategories, the most incidents belonged to: Outside Fires (47.4%), and Structure Fires (33.8%).
Fire incident types reported to NFIRS in Zip Code 46166


 Nearest zip codes: 47433, 46125, 47456, 46157, 47464, 46151.


 Based on the data from the years 2002 - 2018 the average number of fire incidents per year is 23. The highest number of reported fires - 71 took place in 2010, and the least - 3 in 2016. The data has a declining trend.
 When looking into fire subcategories, the most incidents belonged to: Outside Fires (47.4%), and Structure Fires (33.8%).