Estimated zip code population in 2022: 999 Zip code population in 2010: 1,189 Zip code population in 2000: 1,258
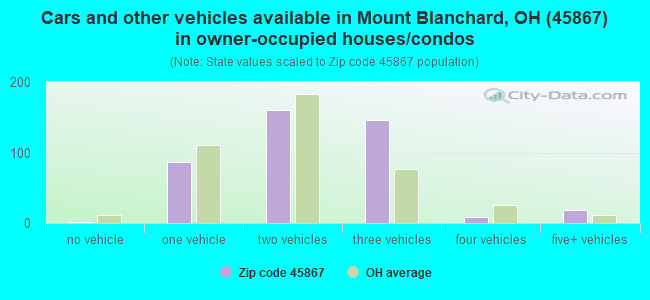
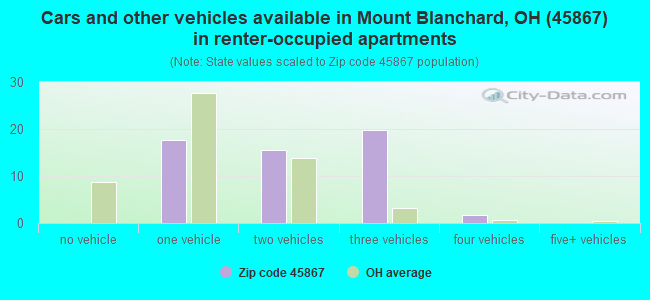
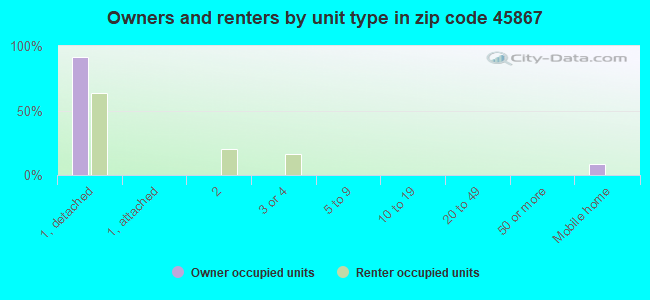
Houses and condos: 500 Renter-occupied apartments: 55
% of renters here:
12%
State:
33%
March 2022 cost of living index in zip code 45867: 83.0 (low, U.S. average is 100)
Land area: 25.6 sq. mi. Water area: 0.0 sq. mi.
Population density: 39 people per square mile
(very low).
OSM Map
General Map
Google Map
MSN Map
OSM Map
General Map
Google Map
MSN Map
OSM Map
General Map
Google Map
MSN Map
OSM Map
General Map
Google Map
MSN Map
Please wait while loading the map...
Real estate property taxes paid for housing units in 2022:
This zip code:
0.7% ($1,322)
Ohio:
1.3% ($2,639)
Median real estate property taxes paid for housing units with mortgages in 2022: $1,289 (0.9%) Median real estate property taxes paid for housing units with no mortgage in 2022: $1,351 (0.7%)
Business Search- 14 Million verified businesses
Males: 543
(54.4%)
Females: 455
(45.6%)
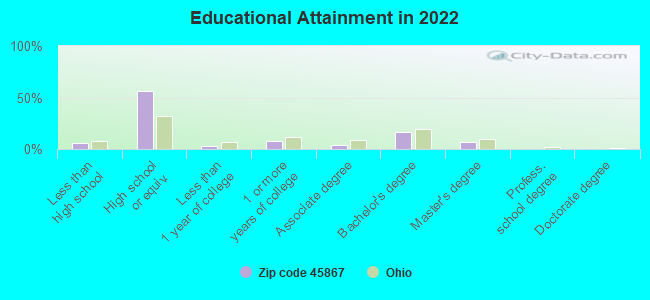
For population 25 years and over in 45867:
High school or higher: 93.2%
Bachelor's degree or higher: 23.3%
Graduate or professional degree: 7.1%
Unemployed: 1.9%
Mean travel time to work (commute): 35.6 minutes
For population 15 years and over in 45867:
Never married: 22.2%
Now married: 48.4%
Separated: 0.8%
Widowed: 16.2%
Divorced: 12.4%
Zip code 45867 compared to state average:
Unemployed percentage below state average.
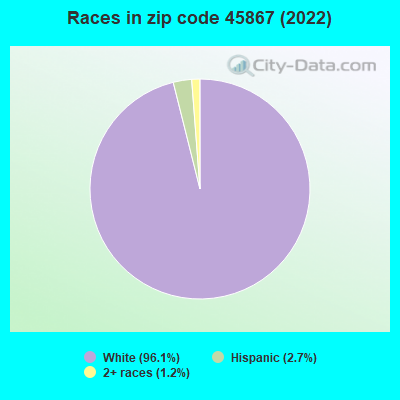
Black race population percentage significantly below state average.
Median age above state average.
Foreign-born population percentage significantly below state average.
Renting percentage significantly below state average.
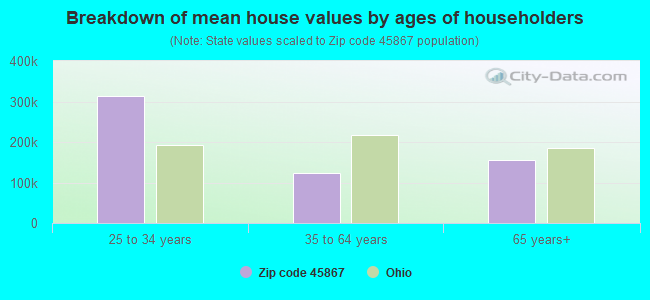
Estimated median house/condo value in 2022: $183,946
45867:
$183,946
Ohio:
$204,100
According to our research of Ohio and other state lists, there were 2 registered sex offenders living in 45867 zip code as of June 30, 2024. The ratio of all residents to sex offenders in zip code 45867 is 482 to 1. The ratio of registered sex offenders to all residents in this zip code is near the state average.
Median resident age:
This zip code:
44.6 years
Ohio median age:
39.9 years
Average household size:
This zip code:
2.1 people
Ohio:
2.4 people
Averages for the 2020 tax year for zip code 45867, filed in 2021:
Average Adjusted Gross Income (AGI) in 2020: $61,969 (Individual Income Tax Returns)
Here:
$61,969
State:
$67,288
Salary/wage: $52,573 (reported on 80.3% of returns)
Here:
$52,573
State:
$55,628
(% of AGI for various income ranges: 1264.5% for AGIs below $25k, 3441.4% for AGIs $25k-50k, 5584.4% for AGIs $50k-75k, 9538.0% for AGIs $75k-100k, 19514.0% for AGIs $100k-200k)
Taxable interest for individuals: $531 (reported on 21.3% of returns)
This zip code:
$531
Ohio:
$1,518
(% of AGI for various income ranges: 10.7% for AGIs $25k-50k, 30.0% for AGIs $50k-75k, 16.0% for AGIs $75k-100k, 38.0% for AGIs $100k-200k)
Ordinary dividends: $1,829 (reported on 23.0% of returns)
Here:
$1,829
State:
$7,167
(% of AGI for various income ranges: 65.5% for AGIs below $25k, 63.3% for AGIs $50k-75k, 106.0% for AGIs $75k-100k, 148.0% for AGIs $100k-200k)
Net capital gain/loss in AGI: +$4,067 (reported on 19.7% of returns)
Here:
+$4,067
State:
+$18,919
(% of AGI for various income ranges: 53.6% for AGIs below $25k, 98.9% for AGIs $50k-75k, 680.0% for AGIs $100k-200k)
Profit/loss from business: +$16,333 (reported on 9.8% of returns)
Here:
+$16,333
State:
+$13,744
(% of AGI for various income ranges: 153.6% for AGIs below $25k, 15.6% for AGIs $50k-75k, 1594.0% for AGIs $100k-200k)
Taxable individual retirement arrangement distribution: $14,625 (reported on 13.1% of returns)
45867:
$14,625
Ohio:
$18,876
(% of AGI for various income ranges: 318.6% for AGIs $25k-50k, 1448.0% for AGIs $75k-100k)
Earned income credit: $2,317 (reported on 9.8% of returns)
Here:
$2,317
State:
$2,304
(% of AGI for various income ranges: 67.3% for AGIs below $25k, 46.4% for AGIs $25k-50k)
Percentage of individuals using paid preparers for their 2020 taxes: 96.7%
Here:
97%
State:
94%
(% for various income ranges: 93.8% for AGIs below $25k, 100.0% for AGIs $25k-50k, 90.9% for AGIs $50k-75k, 100.0% for AGIs $75k-100k, 100.0% for AGIs $100k-200k)
Averages for the 2012 tax year for zip code 45867, filed in 2013:
Average Adjusted Gross Income (AGI) in 2012: $48,119 (Individual Income Tax Returns)
Here:
$48,119
State:
$54,926
Salary/wage: $39,444 (reported on 87.3% of returns)
Here:
$39,444
State:
$45,869
(% of AGI for various income ranges: 73.4% for AGIs below $25k, 76.6% for AGIs $25k-50k, 70.2% for AGIs $50k-75k, 75.6% for AGIs $75k-100k, 66.6% for AGIs $100k-200k)
Taxable interest for individuals: $467 (reported on 28.6% of returns)
This zip code:
$467
Ohio:
$1,297
(% of AGI for various income ranges: 0.7% for AGIs below $25k, 0.3% for AGIs $25k-50k, 0.3% for AGIs $50k-75k, 0.3% for AGIs $75k-100k, 0.1% for AGIs $100k-200k)
Ordinary dividends: $1,042 (reported on 19.0% of returns)
Here:
$1,042
State:
$5,821
(% of AGI for various income ranges: 0.4% for AGIs $25k-50k, 0.5% for AGIs $50k-75k, 0.3% for AGIs $75k-100k, 0.5% for AGIs $100k-200k)
Net capital gain/loss in AGI: +$250 (reported on 12.7% of returns)
Here:
+$250
State:
+$11,232
(% of AGI for various income ranges: 0.4% for AGIs $25k-50k, 0.2% for AGIs $75k-100k)
Profit/loss from business: +$5,871 (reported on 11.1% of returns)
Here:
+$5,871
State:
+$12,773
(% of AGI for various income ranges: 4.9% for AGIs below $25k, 3.6% for AGIs $50k-75k, 0.6% for AGIs $75k-100k)
Taxable individual retirement arrangement distribution: $15,300 (reported on 11.1% of returns)
45867:
$15,300
Ohio:
$14,511
(% of AGI for various income ranges: 4.4% for AGIs $25k-50k, 5.9% for AGIs $50k-75k, 7.7% for AGIs $75k-100k)
Total itemized deductions: $16,753 (19% of AGI, reported on 23.8% of returns)
Here:
$16,753
State:
$21,278
Here:
18.6% of AGI
State:
18.8% of AGI
(% of AGI for various income ranges: 6.7% for AGIs $25k-50k, 8.2% for AGIs $50k-75k, 10.9% for AGIs $75k-100k, 10.3% for AGIs $100k-200k)
Charity contributions: $4,250 (reported on 15.9% of returns)
Here:
$4,250
State:
$3,943
(% of AGI for various income ranges: 2.0% for AGIs $50k-75k, 1.8% for AGIs $75k-100k, 2.0% for AGIs $100k-200k)
Taxes paid: $6,287 (reported on 23.8% of returns)
45867:
$6,287
State:
$9,568
(% of AGI for various income ranges: 1.0% for AGIs $25k-50k, 2.8% for AGIs $50k-75k, 3.5% for AGIs $75k-100k, 5.4% for AGIs $100k-200k)
Earned income credit: $2,250 (reported on 15.9% of returns)
Here:
$2,250
State:
$2,285
(% of AGI for various income ranges: 6.2% for AGIs below $25k, 1.0% for AGIs $25k-50k)
Percentage of individuals using paid preparers for their 2012 taxes: 58.7%
Here:
59%
State:
51%
(% for various income ranges: 39.1% for AGIs below $25k, 64.7% for AGIs $25k-50k, 72.7% for AGIs $50k-75k, 66.7% for AGIs $75k-100k, 83.3% for AGIs $100k-200k)
Averages for the 2004 tax year for zip code 45867, filed in 2005:
Average Adjusted Gross Income (AGI) in 2004: $46,303 (Individual Income Tax Returns)
Here:
$46,303
State:
$44,480
Salary/wage: $37,660 (reported on 85.9% of returns)
Here:
$37,660
State:
$39,198
(% of AGI for various income ranges: 101.8% for AGIs below $10k, 65.1% for AGIs $10k-25k, 82.8% for AGIs $25k-50k, 86.9% for AGIs $50k-75k, 80.8% for AGIs $75k-100k, 35.6% for AGIs over 100k)
Taxable interest for individuals: $789 (reported on 44.9% of returns)
This zip code:
$789
Ohio:
$1,532
(% of AGI for various income ranges: 1.4% for AGIs below $10k, 2.8% for AGIs $10k-25k, 0.8% for AGIs $25k-50k, 0.7% for AGIs $50k-75k, 0.3% for AGIs $75k-100k, 0.4% for AGIs over 100k)
Taxable dividends: $957 (reported on 22.4% of returns)
Here:
$957
State:
$3,496
(% of AGI for various income ranges: 3.4% for AGIs below $10k, 0.6% for AGIs $10k-25k, 0.3% for AGIs $25k-50k, 0.2% for AGIs $50k-75k, 0.5% for AGIs $75k-100k, 0.6% for AGIs over 100k)
Net capital gain/loss: +$239 (reported on 14.7% of returns)
Here:
+$239
State:
+$8,582
(% of AGI for various income ranges: 0.1% for AGIs $10k-25k, -0.1% for AGIs $25k-50k, -0.2% for AGIs $50k-75k, 0.8% for AGIs $75k-100k, -0.1% for AGIs over 100k)
Profit/loss from business: +$6,391 (reported on 11.1% of returns)
Here:
+$6,391
State:
+$10,813
(% of AGI for various income ranges: 4.4% for AGIs $10k-25k, -0.3% for AGIs $25k-50k, 0.8% for AGIs $50k-75k, 5.9% for AGIs $75k-100k)
Total itemized deductions: $15,471 (17% of AGI, reported on 30.0% of returns)
Here:
$15,471
State:
$17,503
Here:
17.4% of AGI
State:
20.8% of AGI
(% of AGI for various income ranges: 21.0% for AGIs below $10k, 7.6% for AGIs $25k-50k, 10.9% for AGIs $50k-75k, 13.8% for AGIs $75k-100k, 11.3% for AGIs over 100k)
Charity contributions deductions: $3,388 (3% of AGI, reported on 23.6% of returns)
Here:
$3,388
State:
$3,087
Here:
3.4% of AGI
State:
3.4% of AGI
(% of AGI for various income ranges: 1.2% for AGIs $25k-50k, 1.8% for AGIs $50k-75k, 2.3% for AGIs $75k-100k, 2.4% for AGIs over 100k)
Total tax: $5,686 (reported on 78.0% of returns)
45867:
$5,686
State:
$6,781
(% of AGI for various income ranges: 1.6% for AGIs below $10k, 4.4% for AGIs $10k-25k, 7.2% for AGIs $25k-50k, 9.0% for AGIs $50k-75k, 10.4% for AGIs $75k-100k, 13.7% for AGIs over 100k)
Earned income credit: $1,750 (reported on 10.3% of returns)
Here:
$1,750
State:
$1,696
Percentage of individuals using paid preparers for their 2004 taxes: 63.0%
Here:
63%
State:
55%
(% for various income ranges: 56.5% for AGIs below $10k, 61.8% for AGIs $10k-25k, 69.0% for AGIs $25k-50k, 55.2% for AGIs $50k-75k, 70.0% for AGIs $75k-100k, 67.9% for AGIs over 100k)
Likely homosexual households (counted as self-reported same-sex unmarried-partner households)
Lesbian couples: 0.4% of all households
Gay men: 0.0% of all households
Household received Food Stamps/SNAP in the past 12 months: 26 Household did not receive Food Stamps/SNAP in the past 12 months: 447
Women who had a birth in the past 12 months: 7 (8 now married, 0 unmarried) Women who did not have a birth in the past 12 months: 165 (95 now married, 70 unmarried)
Housing units in zip code 45867 with a mortgage: 180 (35 second mortgage, 25 both second mortgage and home equity loan) Median monthly owner costs for units with a mortgage: $1,162 Median monthly owner costs for units without a mortgage: $516
Residents with income below the poverty level in 2022:
This zip code:
5.1%
Whole state:
13.4%
Residents with income below 50% of the poverty level in 2022:
This zip code:
1.1%
Whole state:
7.0%
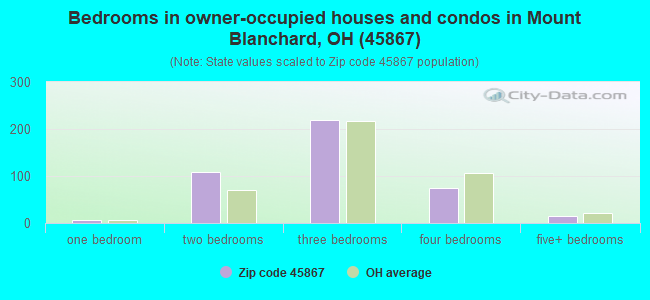
Median number of rooms in houses and condos:
Here:
6.6
State:
6.7
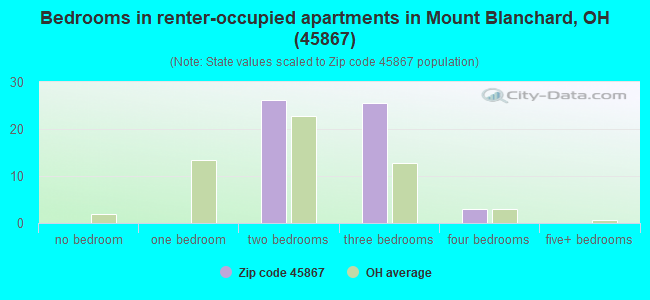
Median number of rooms in apartments:
Here:
5.6
State:
4.4
Notable locations in this zip code not listed on our city pages
Churches in zip code 45867 include: Saint Pauls Church (A), Mount Blanchard United Methodist Church (B), Mount Blanchard Nazarene Church (C). Display/hide their locations on the map
Cemeteries: Adams Cemetery (1), Siddall Cemetery (2), Five Points Cemetery (3), Mount Blanchard Cemetery (4), Krout Cemetery (5), Zion Bloom Cemetery (6), Riverview Cemetery (7). Display/hide their locations on the map
Size of family households: 157 2-persons, 32 3-persons, 47 4-persons, 7 5-persons, 5 6-persons, 4 7-or-more-persons
Size of nonfamily households: 167 1-person, 47 2-persons, 6 4-persons
136 married couples with children.
35 single-parent households (9 men, 26 women).
98.1% of residents of 45867 zip code speak English at home.
2.0% of residents speak Spanish at home (84% very well, 16% not well).
0.2% of residents speak other Indo-European language at home (100% very well).
Foreign born population: 3 (0.3%) (33.7% of them are naturalized citizens)
This zip code:
0.3%
Whole state:
5.0%
33%Germany
33%Guatemala
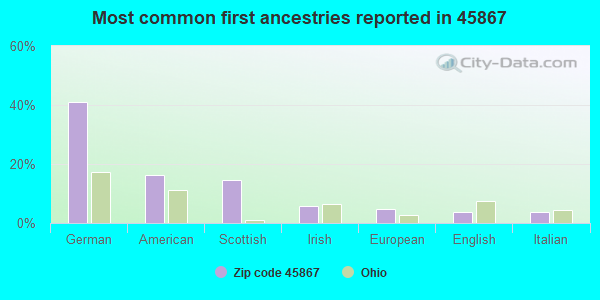
41%German
16%American
15%Scottish
6%Irish
5%European
4%English
4%Italian
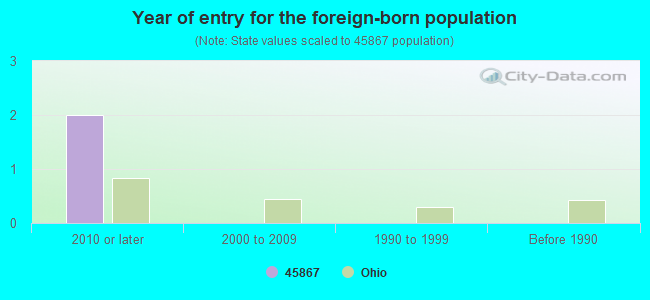
Year of entry for the foreign-born population
22010 or later
02000 to 2009
01990 to 1999
0Before 1990
Housing units lacking complete plumbing facilities: 0.9% Housing units lacking complete kitchen facilities: 1.0%
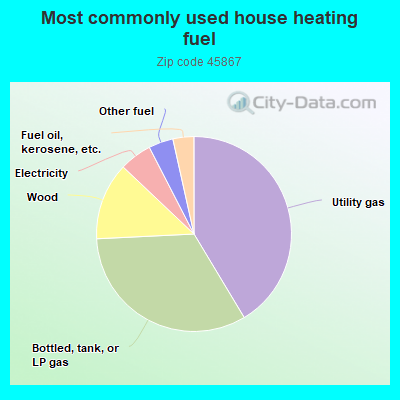
41.6%Utility gas
33.0%Bottled, tank, or LP gas
12.9%Wood
5.4%Electricity
4.1%Other fuel
3.5%Fuel oil, kerosene, etc.
Population in 1990: 957. Population change in the 1990s: +301 (+31.5%).
Place of birth for U.S.-born residents:
This state: 927
Northeast: 31
Midwest: 9
South: 17
West: 9
67% of the 45867 zip code residents lived in the same house 5 years ago. Out of people who lived in different houses, 69% lived in this county. Out of people who lived in different counties, 50% lived in Ohio.
97% of the 45867 zip code residents lived in the same house 1 year ago. Out of people who lived in different houses, 74% moved from this county. Out of people who lived in different houses, 35% moved from different county within same state. Out of people who lived in different houses, 4% moved from different state.
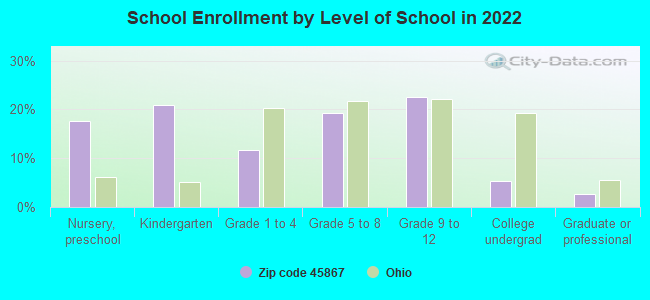
Private vs. public school enrollment:
Students in private schools in grades 1 to 8 (elementary and middle school): 7
Here:
12.8%
Ohio:
16.0%
Students in private schools in grades 9 to 12 (high school):
Here:
0.0%
Ohio:
13.1%
Students in private undergraduate colleges: 1
Here:
17.7%
Ohio:
22.3%
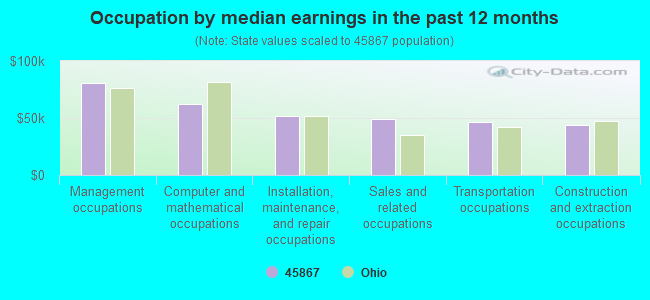
Occupation by median earnings in the past 12 months ($)
80,557Management occupations
62,073Computer and mathematical occupations
51,954Installation, maintenance, and repair occupations
48,977Sales and related occupations
46,588Transportation occupations
43,779Construction and extraction occupations
Top industries in this zip code by the number of employees in 2005:
Other Services (except Public Administration): Labor Unions and Similar Labor Organizations (20-49 employees: 1 establishment)
Construction: Site Preparation Contractors (5-9: 1)
Construction: Plumbing, Heating, and Air-Conditioning Contractors (5-9: 1)
Construction: All Other Specialty Trade Contractors (5-9: 1)
Other Services (except Public Administration): Religious Organizations (1-4: 2)
Accommodation and Food Services: Snack and Nonalcoholic Beverage Bars (1-4: 1)
Fatal accident statistics in 2010:
Fatal accident count: 1
Vehicles involved in fatal accidents: 1
Fatal accidents caused by drunken drivers: 0
Fatalities: 1
Persons involved in fatal accidents: 1
Pedestrians involved in fatal accidents: 1
2002 - 2018 National Fire Incident Reporting System (NFIRS) incidents
According to the data from the years 2002 - 2018 the average number of fire incidents per year is 14. The highest number of fire incidents - 30 took place in 2015, and the least - 5 in 2018. The data has a decreasing trend.
When looking into fire subcategories, the most incidents belonged to: Structure Fires (47.9%), and Outside Fires (38.9%).
Fire incident types reported to NFIRS in Zip Code 45867


 Nearest zip codes: 43359, 45890, 45814, 45843, 43330, 45897.


 According to the data from the years 2002 - 2018 the average number of fire incidents per year is 14. The highest number of fire incidents - 30 took place in 2015, and the least - 5 in 2018. The data has a decreasing trend.
 When looking into fire subcategories, the most incidents belonged to: Structure Fires (47.9%), and Outside Fires (38.9%).