Estimated zip code population in 2022: 13,559 Zip code population in 2010: 14,412 Zip code population in 2000: 14,132
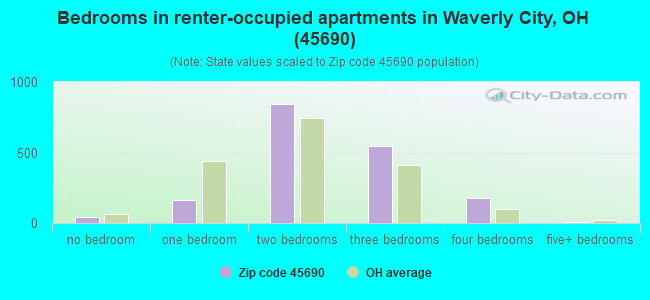
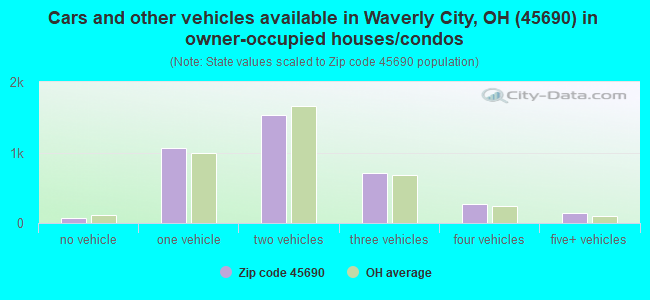
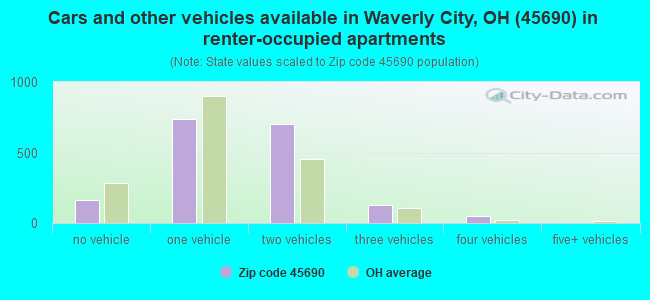
Houses and condos: 6,324 Renter-occupied apartments: 1,795
% of renters here:
32%
State:
33%
March 2022 cost of living index in zip code 45690: 83.7 (less than average, U.S. average is 100)
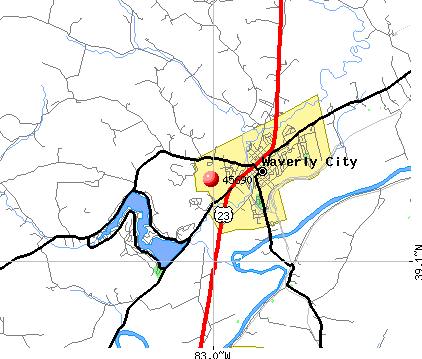
Land area: 143.9 sq. mi. Water area: 1.8 sq. mi.
Population density: 94 people per square mile
(very low).
OSM Map
General Map
Google Map
MSN Map
OSM Map
General Map
Google Map
MSN Map
OSM Map
General Map
Google Map
MSN Map
OSM Map
General Map
Google Map
MSN Map
Please wait while loading the map...
Real estate property taxes paid for housing units in 2022:
This zip code:
0.8% ($1,299)
Ohio:
1.3% ($2,639)
Median real estate property taxes paid for housing units with mortgages in 2022: $1,651 (0.9%) Median real estate property taxes paid for housing units with no mortgage in 2022: $993 (0.8%)
Business Search- 14 Million verified businesses
Males: 6,759
(49.9%)
Females: 6,799
(50.1%)
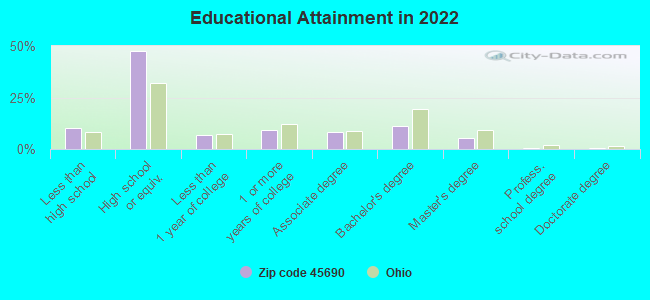
For population 25 years and over in 45690:
High school or higher: 88.6%
Bachelor's degree or higher: 17.4%
Graduate or professional degree: 6.4%
Unemployed: 3.3%
Mean travel time to work (commute): 27.7 minutes
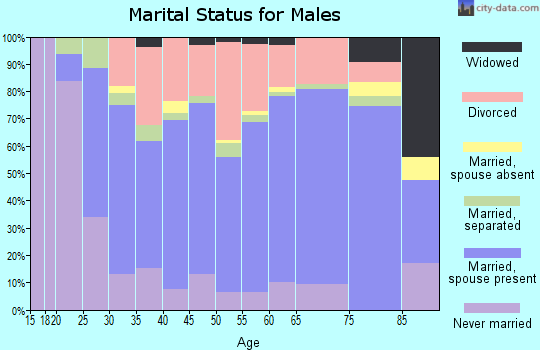
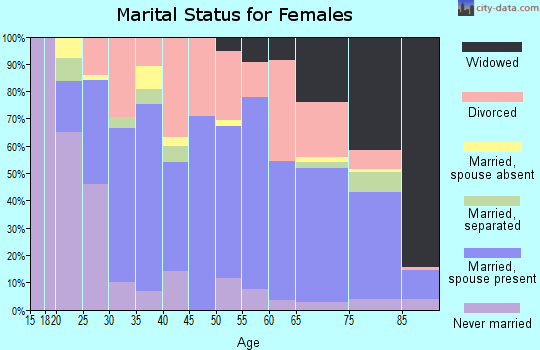
For population 15 years and over in 45690:
Never married: 25.0%
Now married: 52.9%
Separated: 4.0%
Widowed: 4.8%
Divorced: 13.3%
Zip code 45690 compared to state average:
Black race population percentage significantly below state average.
Hispanic race population percentage significantly below state average.
Foreign-born population percentage significantly below state average.
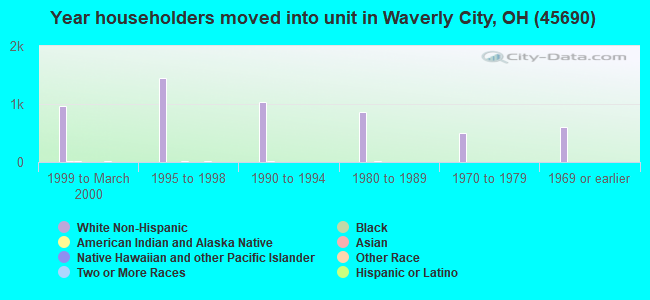
Length of stay since moving in above state average.
Percentage of population with a bachelor's degree or higher below state average.
Estimated median house/condo value in 2022: $156,666
45690:
$156,666
Ohio:
$204,100
According to our research of Ohio and other state lists, there were 19 registered sex offenders living in 45690 zip code as of July 18, 2024. The ratio of all residents to sex offenders in zip code 45690 is 811 to 1. The ratio of registered sex offenders to all residents in this zip code is lower than the state average.
Median resident age:
This zip code:
42.8 years
Ohio median age:
39.9 years
Average household size:
This zip code:
2.4 people
Ohio:
2.4 people
Averages for the 2020 tax year for zip code 45690, filed in 2021:
Average Adjusted Gross Income (AGI) in 2020: $50,648 (Individual Income Tax Returns)
Here:
$50,648
State:
$67,288
Salary/wage: $43,659 (reported on 81.1% of returns)
Here:
$43,659
State:
$55,628
(% of AGI for various income ranges: 1067.1% for AGIs below $25k, 3422.3% for AGIs $25k-50k, 6423.0% for AGIs $50k-75k, 9420.0% for AGIs $75k-100k, 14060.5% for AGIs $100k-200k)
Taxable interest for individuals: $1,161 (reported on 24.3% of returns)
This zip code:
$1,161
Ohio:
$1,518
(% of AGI for various income ranges: 10.9% for AGIs below $25k, 16.6% for AGIs $25k-50k, 36.2% for AGIs $50k-75k, 59.0% for AGIs $75k-100k, 131.0% for AGIs $100k-200k)
Ordinary dividends: $5,316 (reported on 10.5% of returns)
Here:
$5,316
State:
$7,167
(% of AGI for various income ranges: 10.3% for AGIs below $25k, 19.4% for AGIs $25k-50k, 57.8% for AGIs $50k-75k, 79.5% for AGIs $75k-100k, 236.2% for AGIs $100k-200k)
Net capital gain/loss in AGI: +$10,271 (reported on 9.7% of returns)
Here:
+$10,271
State:
+$18,919
(% of AGI for various income ranges: 2.1% for AGIs below $25k, 19.5% for AGIs $25k-50k, 80.0% for AGIs $50k-75k, 172.8% for AGIs $75k-100k, 436.7% for AGIs $100k-200k)
Profit/loss from business: +$11,836 (reported on 11.8% of returns)
Here:
+$11,836
State:
+$13,744
(% of AGI for various income ranges: 81.0% for AGIs below $25k, 101.4% for AGIs $25k-50k, 122.8% for AGIs $50k-75k, 136.8% for AGIs $75k-100k, 475.2% for AGIs $100k-200k)
Taxable individual retirement arrangement distribution: $16,110 (reported on 8.5% of returns)
45690:
$16,110
Ohio:
$18,876
(% of AGI for various income ranges: 54.4% for AGIs below $25k, 82.9% for AGIs $25k-50k, 204.5% for AGIs $50k-75k, 273.2% for AGIs $75k-100k, 924.8% for AGIs $100k-200k)
Total itemized deductions: $28,986 (reported on 2.3% of returns)
Here:
$28,986
State:
$33,869
(% of AGI for various income ranges: 59.3% for AGIs $25k-50k, 171.2% for AGIs $75k-100k, 390.2% for AGIs $100k-200k)
Charity contributions: $9,700 (reported on 1.8% of returns)
Here:
$9,700
State:
$14,577
(% of AGI for various income ranges: 6.7% for AGIs below $25k, 39.8% for AGIs $75k-100k, 190.2% for AGIs $100k-200k)
Taxes paid: $5,693 (reported on 2.3% of returns)
45690:
$5,693
State:
$7,681
(% of AGI for various income ranges: 10.8% for AGIs $25k-50k, 37.8% for AGIs $75k-100k, 72.4% for AGIs $100k-200k)
Earned income credit: $2,363 (reported on 19.8% of returns)
Here:
$2,363
State:
$2,304
(% of AGI for various income ranges: 109.0% for AGIs below $25k, 81.4% for AGIs $25k-50k)
Percentage of individuals using paid preparers for their 2020 taxes: 94.3%
Here:
94%
State:
94%
(% for various income ranges: 93.8% for AGIs below $25k, 96.4% for AGIs $25k-50k, 94.0% for AGIs $50k-75k, 93.1% for AGIs $75k-100k, 92.3% for AGIs $100k-200k, 88.9% for AGIs over 200k)
Averages for the 2012 tax year for zip code 45690, filed in 2013:
Average Adjusted Gross Income (AGI) in 2012: $43,560 (Individual Income Tax Returns)
Here:
$43,560
State:
$54,926
Salary/wage: $38,240 (reported on 80.9% of returns)
Here:
$38,240
State:
$45,869
(% of AGI for various income ranges: 69.2% for AGIs below $25k, 73.7% for AGIs $25k-50k, 76.1% for AGIs $50k-75k, 75.8% for AGIs $75k-100k, 71.2% for AGIs $100k-200k, 37.5% for AGIs over 200k)
Taxable interest for individuals: $1,113 (reported on 28.5% of returns)
This zip code:
$1,113
Ohio:
$1,297
(% of AGI for various income ranges: 1.2% for AGIs below $25k, 0.5% for AGIs $25k-50k, 0.6% for AGIs $50k-75k, 0.5% for AGIs $75k-100k, 0.8% for AGIs $100k-200k, 1.2% for AGIs over 200k)
Ordinary dividends: $5,919 (reported on 12.7% of returns)
Here:
$5,919
State:
$5,821
(% of AGI for various income ranges: 1.0% for AGIs below $25k, 0.6% for AGIs $25k-50k, 0.7% for AGIs $50k-75k, 1.2% for AGIs $75k-100k, 1.5% for AGIs $100k-200k, 11.7% for AGIs over 200k)
Net capital gain/loss in AGI: +$4,218 (reported on 9.5% of returns)
Here:
+$4,218
State:
+$11,232
(% of AGI for various income ranges: 0.3% for AGIs $25k-50k, 0.3% for AGIs $50k-75k, 0.8% for AGIs $75k-100k, 1.6% for AGIs $100k-200k, 5.1% for AGIs over 200k)
Profit/loss from business: +$9,451 (reported on 12.5% of returns)
Here:
+$9,451
State:
+$12,773
(% of AGI for various income ranges: 6.0% for AGIs below $25k, 1.9% for AGIs $25k-50k, 1.5% for AGIs $50k-75k, 1.2% for AGIs $75k-100k, 4.7% for AGIs $100k-200k)
Taxable individual retirement arrangement distribution: $11,295 (reported on 10.1% of returns)
45690:
$11,295
Ohio:
$14,511
(% of AGI for various income ranges: 2.8% for AGIs below $25k, 2.6% for AGIs $25k-50k, 1.9% for AGIs $50k-75k, 2.8% for AGIs $75k-100k, 3.9% for AGIs $100k-200k)
Total itemized deductions: $18,605 (22% of AGI, reported on 19.1% of returns)
Here:
$18,605
State:
$21,278
Here:
22.0% of AGI
State:
18.8% of AGI
(% of AGI for various income ranges: 6.0% for AGIs below $25k, 6.1% for AGIs $25k-50k, 8.5% for AGIs $50k-75k, 8.8% for AGIs $75k-100k, 9.8% for AGIs $100k-200k, 10.4% for AGIs over 200k)
Charity contributions: $4,407 (reported on 13.0% of returns)
Here:
$4,407
State:
$3,943
(% of AGI for various income ranges: 0.5% for AGIs below $25k, 0.8% for AGIs $25k-50k, 1.3% for AGIs $50k-75k, 1.5% for AGIs $75k-100k, 1.8% for AGIs $100k-200k, 2.4% for AGIs over 200k)
Taxes paid: $5,139 (reported on 18.9% of returns)
45690:
$5,139
State:
$9,568
(% of AGI for various income ranges: 0.7% for AGIs below $25k, 1.0% for AGIs $25k-50k, 2.0% for AGIs $50k-75k, 2.3% for AGIs $75k-100k, 3.6% for AGIs $100k-200k, 4.9% for AGIs over 200k)
Earned income credit: $2,293 (reported on 21.9% of returns)
Here:
$2,293
State:
$2,285
(% of AGI for various income ranges: 7.4% for AGIs below $25k, 1.2% for AGIs $25k-50k)
Percentage of individuals using paid preparers for their 2012 taxes: 52.1%
Here:
52%
State:
51%
(% for various income ranges: 46.7% for AGIs below $25k, 52.7% for AGIs $25k-50k, 58.0% for AGIs $50k-75k, 56.2% for AGIs $75k-100k, 60.5% for AGIs $100k-200k, 80.0% for AGIs over 200k)
Averages for the 2004 tax year for zip code 45690, filed in 2005:
Average Adjusted Gross Income (AGI) in 2004: $34,052 (Individual Income Tax Returns)
Here:
$34,052
State:
$44,480
Salary/wage: $31,337 (reported on 81.9% of returns)
Here:
$31,337
State:
$39,198
(% of AGI for various income ranges: 164.1% for AGIs below $10k, 70.0% for AGIs $10k-25k, 80.0% for AGIs $25k-50k, 79.6% for AGIs $50k-75k, 75.4% for AGIs $75k-100k, 56.1% for AGIs over 100k)
Taxable interest for individuals: $1,580 (reported on 39.0% of returns)
This zip code:
$1,580
Ohio:
$1,532
(% of AGI for various income ranges: 8.1% for AGIs below $10k, 2.6% for AGIs $10k-25k, 1.2% for AGIs $25k-50k, 1.4% for AGIs $50k-75k, 1.9% for AGIs $75k-100k, 2.4% for AGIs over 100k)
Taxable dividends: $3,777 (reported on 15.2% of returns)
Here:
$3,777
State:
$3,496
(% of AGI for various income ranges: 4.0% for AGIs below $10k, 1.0% for AGIs $10k-25k, 0.7% for AGIs $25k-50k, 0.9% for AGIs $50k-75k, 1.7% for AGIs $75k-100k, 5.4% for AGIs over 100k)
Net capital gain/loss: +$6,085 (reported on 12.1% of returns)
Here:
+$6,085
State:
+$8,582
(% of AGI for various income ranges: -2.0% for AGIs below $10k, 0.3% for AGIs $10k-25k, 0.5% for AGIs $25k-50k, 1.0% for AGIs $50k-75k, 1.4% for AGIs $75k-100k, 10.0% for AGIs over 100k)
Profit/loss from business: +$7,120 (reported on 13.7% of returns)
Here:
+$7,120
State:
+$10,813
(% of AGI for various income ranges: -4.5% for AGIs below $10k, 4.6% for AGIs $10k-25k, 1.3% for AGIs $25k-50k, 1.5% for AGIs $50k-75k, 2.2% for AGIs $75k-100k, 7.9% for AGIs over 100k)
IRA payment deduction: $2,657 (reported on 1.1% of returns)
45690:
$2,657
Ohio:
$2,794
Self-employed pension: $10,692 (reported on 0.2% of returns)
Here:
$10,692
Ohio:
$13,981
Total itemized deductions: $15,297 (24% of AGI, reported on 20.8% of returns)
Here:
$15,297
State:
$17,503
Here:
23.9% of AGI
State:
20.8% of AGI
(% of AGI for various income ranges: 14.1% for AGIs below $10k, 5.9% for AGIs $10k-25k, 7.7% for AGIs $25k-50k, 10.6% for AGIs $50k-75k, 11.3% for AGIs $75k-100k, 11.8% for AGIs over 100k)
Charity contributions deductions: $2,980 (4% of AGI, reported on 14.9% of returns)
Here:
$2,980
State:
$3,087
Here:
4.2% of AGI
State:
3.4% of AGI
(% of AGI for various income ranges: 0.5% for AGIs below $10k, 0.6% for AGIs $10k-25k, 0.9% for AGIs $25k-50k, 1.5% for AGIs $50k-75k, 1.8% for AGIs $75k-100k, 1.9% for AGIs over 100k)
Total tax: $4,209 (reported on 71.5% of returns)
45690:
$4,209
State:
$6,781
(% of AGI for various income ranges: 4.5% for AGIs below $10k, 3.7% for AGIs $10k-25k, 6.6% for AGIs $25k-50k, 8.8% for AGIs $50k-75k, 11.0% for AGIs $75k-100k, 16.5% for AGIs over 100k)
Earned income credit: $1,758 (reported on 19.9% of returns)
Here:
$1,758
State:
$1,696
Percentage of individuals using paid preparers for their 2004 taxes: 59.0%
Here:
59%
State:
55%
(% for various income ranges: 46.7% for AGIs below $10k, 59.8% for AGIs $10k-25k, 63.4% for AGIs $25k-50k, 63.6% for AGIs $50k-75k, 60.6% for AGIs $75k-100k, 66.8% for AGIs over 100k)
Household received Food Stamps/SNAP in the past 12 months: 1,172 Household did not receive Food Stamps/SNAP in the past 12 months: 4,433
Women who had a birth in the past 12 months: 291 (192 now married, 99 unmarried) Women who did not have a birth in the past 12 months: 2,640 (1,271 now married, 1,367 unmarried)
Housing units in zip code 45690 with a mortgage: 1,958 (158 second mortgage, 69 both second mortgage and home equity loan) Median monthly owner costs for units with a mortgage: $1,201 Median monthly owner costs for units without a mortgage: $446
Residents with income below the poverty level in 2022:
This zip code:
16.2%
Whole state:
13.4%
Residents with income below 50% of the poverty level in 2022:
This zip code:
7.6%
Whole state:
7.0%
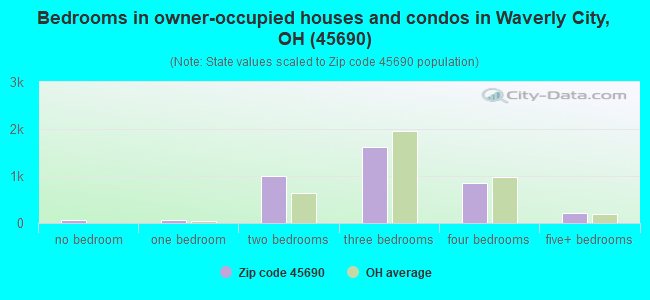
Median number of rooms in houses and condos:
Here:
6.5
State:
6.7
Median number of rooms in apartments:
Here:
4.7
State:
4.4
Notable locations in this zip code not listed on our city pages
Notable locations in zip code 45690: Atomic Speedway (A), Skyline Golf Course (B), Pike Sanitation Landfill (C), Pike County Emergency Medical Services (D), Jackson Township Fire Department (E), Waverly Fire Department (F), Benton Township Volunteer Fire Department (G), Franklin Township Fire and Rescue Services (H), Pebble Township Volunteer Fire Department (I), Pike County Jail (J), Pike County Childrens Home (K), Pike County Courthouse (L). Display/hide their locations on the map
Churches in zip code 45690 include: Beaver Chapel (A), Bond Chapel (B), Cline Chapel (C), Eden Church (D), Enterprise Church (E), Hamman Church (F), Saint Marys Roman Catholic Church (G), First Presbyterian Church (H), First Evangelical Church (I). Display/hide their locations on the map
Cemeteries: Barger Cemetery (1), Barnett Cemetery (2), Blands Cemetery (3), Shock Cemetery (4), Brust Cemetery (5), Brust Number 2 Cemetery (6), Barnes Number 2 Cemetery (7). Display/hide their locations on the map
Lakes and reservoirs: Stewart Lake (A), Lake White (B), Caldwell Lake (C), Mead Foremens Club Pond (D), Pine Lake (E). Display/hide their locations on the map
Streams, rivers, and creeks: Moore Run (A), Meadow Run (B), Long Branch (C), Fivemile Creek (D), Wilson Run (E), Crooked Creek (F), Carrs Run (G), Camp Run (H), Pee Pee Creek (I). Display/hide their locations on the map
Parks in zip code 45690 include: Waverly Canal Historic District (1), Lake White State Park (2), Scioto Trail State Park (3). Display/hide their locations on the map
1,925 married couples with children.
710 single-parent households (257 men, 453 women).
98.2% of residents of 45690 zip code speak English at home.
0.4% of residents speak Spanish at home (54% well, 46% not well).
1.2% of residents speak other Indo-European language at home (100% very well).
0.2% of residents speak Asian or Pacific Island language at home (32% well, 68% not well).
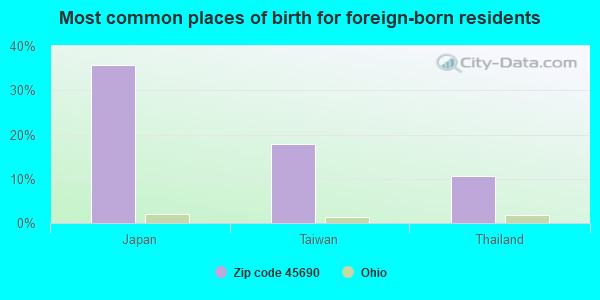
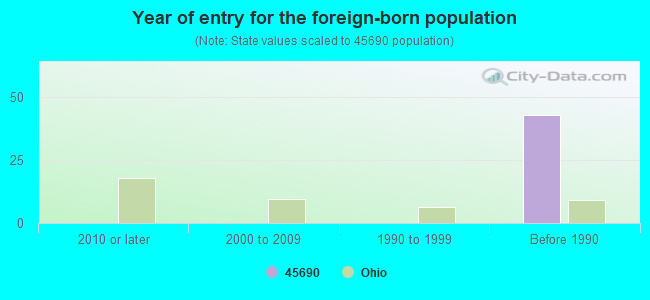
Foreign born population: 28 (0.2%) (89.5% of them are naturalized citizens)
This zip code:
0.2%
Whole state:
5.0%
36%Japan
18%Taiwan
11%Thailand
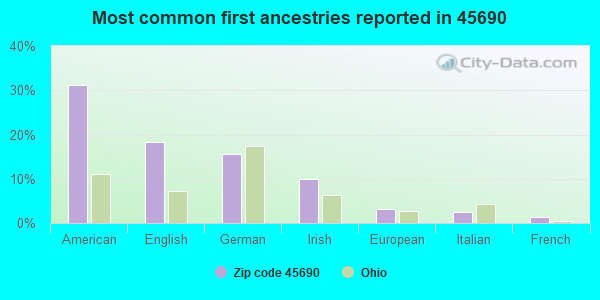
31%American
18%English
16%German
10%Irish
3%European
2%Italian
1%French
Year of entry for the foreign-born population
02010 or later
02000 to 2009
01990 to 1999
43Before 1990
Facilities with environmental interests located in this zip code:
BP AMOCO OIL CORP BULK PLANT WAVERLY (313 NORTH ST. in WAVERLY, OH)
(Integrated Compliance Information System) - ICIS-05-1996-0567, FORMAL ENFORCEMENT ACTION STATE MASTER (Ohio general info) - PCS-OH0120855, National Pollutant Discharge Elimination System Permit, RCRA-OHD000727586, HAZARDOUS WASTE PROGRAM, AIR MAJOR, EPCRA National Pollutant Discharge Elimination System NON-MAJOR (Tracking pollutant discharge elimination systems) - permit Conditionally Exempt Small Quantity Generators, less than 100 kg/month of hazardous waste (Resource Conservation and Recovery Act (tracking hazardous waste)) - notification Business SIC classification: PETROLEUM AND PETROLEUM PRODUCTS WHOLESALERS, EXCEPT BULK STATIONS AND TERMINALS Organizations: BP OIL COMPANY (CONTACT/OWNER)
, BP EXPLORATION & OIL INC (CONTACT/OWNER)
, BP OIL COMPANY (CONTACT/OWNER)
Alternative names: BP OIL CO, BP OIL CO BULK PLT
BP OIL CO (506 E EMMITT in WAVERLY, OH)
STATE MASTER (Ohio general info) - RCRA-OHD987016920, HAZARDOUS WASTE PROGRAM Large Quantity Generators, more that 1000 kg of hazardous waste/month (Resource Conservation and Recovery Act (tracking hazardous waste)) - notification Organizations: BP OIL COMPANY (CONTACT/OWNER)
Housing units lacking complete plumbing facilities: 4.9% Housing units lacking complete kitchen facilities: 3.8%
48.9%Electricity
27.4%Utility gas
15.2%Bottled, tank, or LP gas
3.7%Other fuel
2.3%Wood
2.0%Fuel oil, kerosene, etc.
0.5%No fuel used
Population in 1990: 14,422.
Place of birth for U.S.-born residents:
This state: 11,699
Northeast: 352
Midwest: 234
South: 989
West: 211
59% of the 45690 zip code residents lived in the same house 5 years ago. Out of people who lived in different houses, 61% lived in this county. Out of people who lived in different counties, 50% lived in Ohio.
92% of the 45690 zip code residents lived in the same house 1 year ago. Out of people who lived in different houses, 55% moved from this county. Out of people who lived in different houses, 41% moved from different county within same state. Out of people who lived in different houses, 6% moved from different state.
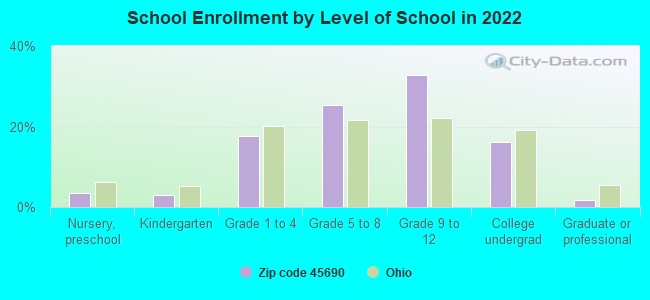
Private vs. public school enrollment:
Students in private schools in grades 1 to 8 (elementary and middle school): 94
Here:
6.7%
Ohio:
16.0%
Students in private schools in grades 9 to 12 (high school): 148
Here:
13.6%
Ohio:
13.1%
Students in private undergraduate colleges: 108
Here:
20.4%
Ohio:
22.3%
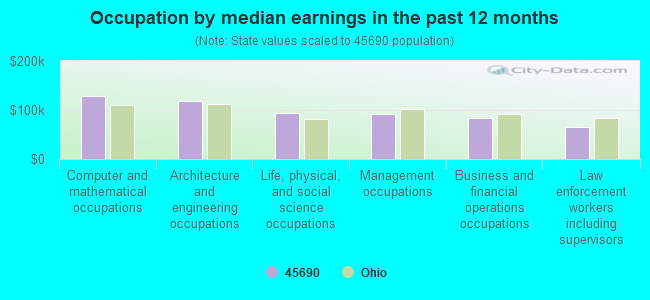
Occupation by median earnings in the past 12 months ($)
128,615Computer and mathematical occupations
119,153Architecture and engineering occupations
93,859Life, physical, and social science occupations
92,818Management occupations
83,560Business and financial operations occupations
64,931Law enforcement workers including supervisors
Top industries in this zip code by the number of employees in 2005:
Health Care and Social Assistance: General Medical and Surgical Hospitals (250-499 employees: 1 establishment)
Health Care and Social Assistance: Services for the Elderly and Persons with Disabilities (100-249: 1, 20-49: 1)
People in group quarters in 2010:
110 people in nursing facilities/skilled-nursing facilities
13 people in emergency and transitional shelters (with sleeping facilities) for people experiencing homelessness
13 people in group homes intended for adults
People in group quarters in 2000:
69 people in nursing homes
23 people in homes for the mentally retarded
16 people in other noninstitutional group quarters
2 people in local jails and other confinement facilities (including police lockups)
2 people in homes for the mentally ill
Fatal accident statistics in 2014:
Fatal accident count: 7
Vehicles involved in fatal accidents: 11
Fatal accidents caused by drunken drivers: 1
Fatalities: 10
Persons involved in fatal accidents: 20
Pedestrians involved in fatal accidents: 0
Fatal accident statistics in 2013:
Fatal accident count: 3
Vehicles involved in fatal accidents: 5
Fatal accidents caused by drunken drivers: 0
Fatalities: 4
Persons involved in fatal accidents: 7
Pedestrians involved in fatal accidents: 0
2002 - 2018 National Fire Incident Reporting System (NFIRS) incidents
According to the data from the years 2002 - 2018 the average number of fire incidents per year is 96. The highest number of fires - 121 took place in 2009, and the least - 68 in 2006. The data has a dropping trend.
When looking into fire subcategories, the most reports belonged to: Structure Fires (47.9%), and Outside Fires (38.0%).
Fire incident types reported to NFIRS in Zip Code 45690


 Nearest zip codes: 45642, 45661, 45601, 45613, 45617, 45673.
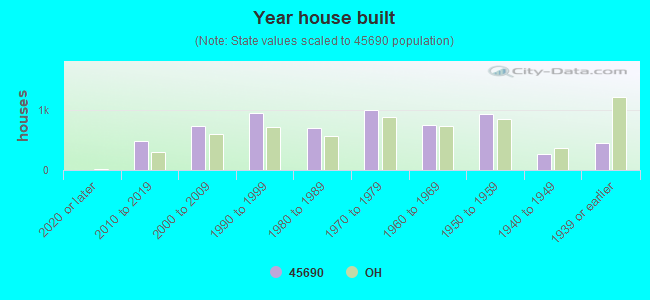


 According to the data from the years 2002 - 2018 the average number of fire incidents per year is 96. The highest number of fires - 121 took place in 2009, and the least - 68 in 2006. The data has a dropping trend.
 When looking into fire subcategories, the most reports belonged to: Structure Fires (47.9%), and Outside Fires (38.0%).