Estimated zip code population in 2022: 5,572 Zip code population in 2010: 4,761 Zip code population in 2000: 3,679
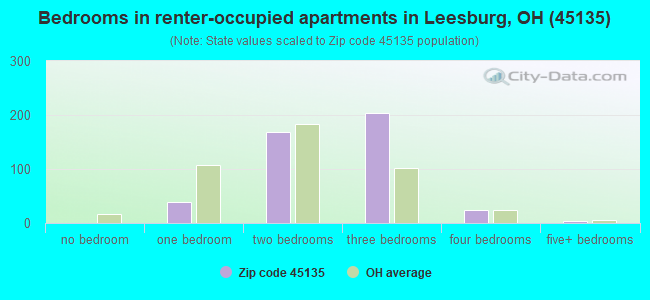
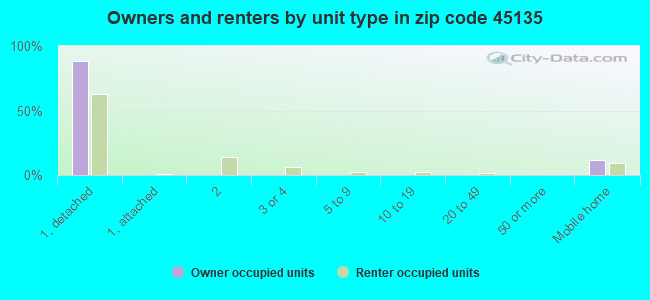
Houses and condos: 2,102 Renter-occupied apartments: 444
% of renters here:
22%
State:
33%
March 2022 cost of living index in zip code 45135: 82.7 (low, U.S. average is 100)
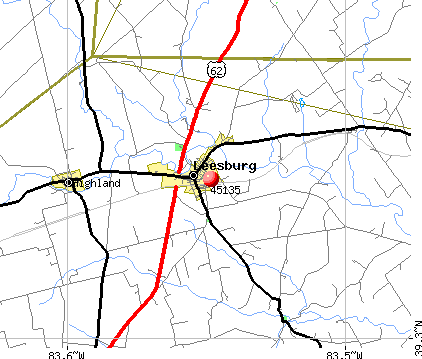
Land area: 70.5 sq. mi. Water area: 0.0 sq. mi.
Population density: 79 people per square mile
(very low).
OSM Map
General Map
Google Map
MSN Map
OSM Map
General Map
Google Map
MSN Map
OSM Map
General Map
Google Map
MSN Map
OSM Map
General Map
Google Map
MSN Map
Please wait while loading the map...
Real estate property taxes paid for housing units in 2022:
This zip code:
0.9% ($1,670)
Ohio:
1.3% ($2,639)
Median real estate property taxes paid for housing units with mortgages in 2022: $1,539 (0.8%) Median real estate property taxes paid for housing units with no mortgage in 2022: $2,286 (1.2%)
Business Search- 14 Million verified businesses
Males: 2,682
(48.1%)
Females: 2,889
(51.9%)
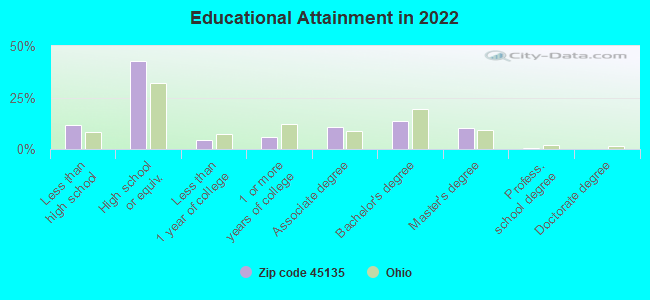
For population 25 years and over in 45135:
High school or higher: 87.6%
Bachelor's degree or higher: 24.7%
Graduate or professional degree: 11.0%
Unemployed: 0.6%
Mean travel time to work (commute): 27.3 minutes
For population 15 years and over in 45135:
Never married: 24.7%
Now married: 59.5%
Separated: 0.7%
Widowed: 5.6%
Divorced: 9.4%
Zip code 45135 compared to state average:
Unemployed percentage significantly below state average.
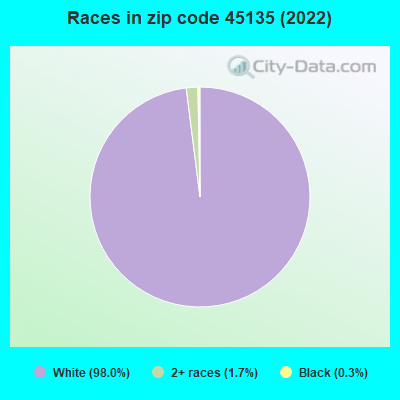
Black race population percentage significantly below state average.
Hispanic race population percentage significantly below state average.
Median age below state average.
Foreign-born population percentage significantly below state average.
Length of stay since moving in below state average.
Averages for the 2020 tax year for zip code 45135, filed in 2021:
Average Adjusted Gross Income (AGI) in 2020: $55,112 (Individual Income Tax Returns)
Here:
$55,112
State:
$67,288
Salary/wage: $48,080 (reported on 84.9% of returns)
Here:
$48,080
State:
$55,628
(% of AGI for various income ranges: 1273.0% for AGIs below $25k, 3928.3% for AGIs $25k-50k, 6727.0% for AGIs $50k-75k, 10817.1% for AGIs $75k-100k, 15600.0% for AGIs $100k-200k)
Taxable interest for individuals: $671 (reported on 23.3% of returns)
This zip code:
$671
Ohio:
$1,518
(% of AGI for various income ranges: 15.5% for AGIs below $25k, 6.0% for AGIs $25k-50k, 29.3% for AGIs $50k-75k, 50.0% for AGIs $75k-100k, 38.2% for AGIs $100k-200k)
Ordinary dividends: $3,114 (reported on 10.0% of returns)
Here:
$3,114
State:
$7,167
(% of AGI for various income ranges: 3.8% for AGIs below $25k, 13.0% for AGIs $25k-50k, 33.0% for AGIs $50k-75k, 87.1% for AGIs $75k-100k, 232.4% for AGIs $100k-200k)
Net capital gain/loss in AGI: +$7,586 (reported on 10.0% of returns)
Here:
+$7,586
State:
+$18,919
(% of AGI for various income ranges: 8.3% for AGIs below $25k, 11.7% for AGIs $25k-50k, 63.7% for AGIs $50k-75k, 237.1% for AGIs $75k-100k, 470.6% for AGIs $100k-200k)
Profit/loss from business: +$14,931 (reported on 16.0% of returns)
Here:
+$14,931
State:
+$13,744
(% of AGI for various income ranges: 157.7% for AGIs below $25k, 203.2% for AGIs $25k-50k, 443.3% for AGIs $50k-75k, 240.7% for AGIs $75k-100k, 1174.1% for AGIs $100k-200k)
Taxable individual retirement arrangement distribution: $9,223 (reported on 5.9% of returns)
45135:
$9,223
Ohio:
$18,876
(% of AGI for various income ranges: 35.3% for AGIs below $25k, 57.2% for AGIs $25k-50k, 170.0% for AGIs $50k-75k, 179.4% for AGIs $100k-200k)
Total itemized deductions: $25,550 (reported on 2.7% of returns)
Here:
$25,550
State:
$33,869
(% of AGI for various income ranges: 137.9% for AGIs $25k-50k, 520.6% for AGIs $100k-200k)
Charity contributions: $10,000 (reported on 1.4% of returns)
Here:
$10,000
State:
$14,577
(% of AGI for various income ranges: 176.5% for AGIs $100k-200k)
Taxes paid: $5,167 (reported on 2.7% of returns)
45135:
$5,167
State:
$7,681
(% of AGI for various income ranges: 17.0% for AGIs $25k-50k, 135.3% for AGIs $100k-200k)
Earned income credit: $2,218 (reported on 15.5% of returns)
Here:
$2,218
State:
$2,304
(% of AGI for various income ranges: 106.2% for AGIs below $25k, 54.3% for AGIs $25k-50k)
Percentage of individuals using paid preparers for their 2020 taxes: 96.8%
Here:
97%
State:
94%
(% for various income ranges: 95.5% for AGIs below $25k, 96.7% for AGIs $25k-50k, 97.4% for AGIs $50k-75k, 100.0% for AGIs $75k-100k, 96.4% for AGIs $100k-200k, 100.0% for AGIs over 200k)
Averages for the 2012 tax year for zip code 45135, filed in 2013:
Average Adjusted Gross Income (AGI) in 2012: $45,066 (Individual Income Tax Returns)
Here:
$45,066
State:
$54,926
Salary/wage: $38,396 (reported on 83.0% of returns)
Here:
$38,396
State:
$45,869
(% of AGI for various income ranges: 69.2% for AGIs below $25k, 81.8% for AGIs $25k-50k, 76.5% for AGIs $50k-75k, 78.4% for AGIs $75k-100k, 70.0% for AGIs $100k-200k, 30.1% for AGIs over 200k)
Taxable interest for individuals: $773 (reported on 24.5% of returns)
This zip code:
$773
Ohio:
$1,297
(% of AGI for various income ranges: 0.8% for AGIs below $25k, 0.4% for AGIs $25k-50k, 0.2% for AGIs $50k-75k, 0.4% for AGIs $75k-100k, 0.6% for AGIs $100k-200k, 0.5% for AGIs over 200k)
Ordinary dividends: $2,300 (reported on 12.5% of returns)
Here:
$2,300
State:
$5,821
(% of AGI for various income ranges: 0.4% for AGIs below $25k, 0.3% for AGIs $25k-50k, 0.7% for AGIs $50k-75k, 0.8% for AGIs $75k-100k, 1.5% for AGIs $100k-200k)
Net capital gain/loss in AGI: +$9,270 (reported on 10.0% of returns)
Here:
+$9,270
State:
+$11,232
(% of AGI for various income ranges: 0.7% for AGIs $25k-50k, 0.8% for AGIs $50k-75k, 1.2% for AGIs $75k-100k, 8.4% for AGIs $100k-200k)
Profit/loss from business: +$11,544 (reported on 17.0% of returns)
Here:
+$11,544
State:
+$12,773
(% of AGI for various income ranges: 11.2% for AGIs below $25k, 4.3% for AGIs $25k-50k, 3.8% for AGIs $50k-75k, 3.3% for AGIs $75k-100k, 4.7% for AGIs $100k-200k)
Taxable individual retirement arrangement distribution: $10,558 (reported on 6.0% of returns)
45135:
$10,558
Ohio:
$14,511
(% of AGI for various income ranges: 2.6% for AGIs below $25k, 1.4% for AGIs $25k-50k, 1.2% for AGIs $50k-75k, 4.3% for AGIs $75k-100k)
Total itemized deductions: $18,395 (20% of AGI, reported on 20.0% of returns)
Here:
$18,395
State:
$21,278
Here:
20.3% of AGI
State:
18.8% of AGI
(% of AGI for various income ranges: 6.5% for AGIs below $25k, 5.5% for AGIs $25k-50k, 6.6% for AGIs $50k-75k, 8.2% for AGIs $75k-100k, 12.5% for AGIs $100k-200k, 11.1% for AGIs over 200k)
Charity contributions: $4,677 (reported on 13.0% of returns)
Here:
$4,677
State:
$3,943
(% of AGI for various income ranges: 0.8% for AGIs $25k-50k, 0.8% for AGIs $50k-75k, 1.1% for AGIs $75k-100k, 4.4% for AGIs $100k-200k)
Taxes paid: $5,740 (reported on 20.0% of returns)
45135:
$5,740
State:
$9,568
(% of AGI for various income ranges: 1.0% for AGIs below $25k, 1.4% for AGIs $25k-50k, 1.9% for AGIs $50k-75k, 2.5% for AGIs $75k-100k, 4.5% for AGIs $100k-200k, 4.5% for AGIs over 200k)
Earned income credit: $2,264 (reported on 22.0% of returns)
Here:
$2,264
State:
$2,285
(% of AGI for various income ranges: 7.8% for AGIs below $25k, 1.2% for AGIs $25k-50k)
Percentage of individuals using paid preparers for their 2012 taxes: 66.5%
Here:
66%
State:
51%
(% for various income ranges: 59.2% for AGIs below $25k, 71.4% for AGIs $25k-50k, 67.7% for AGIs $50k-75k, 69.2% for AGIs $75k-100k, 71.4% for AGIs $100k-200k, 100.0% for AGIs over 200k)
Averages for the 2004 tax year for zip code 45135, filed in 2005:
Average Adjusted Gross Income (AGI) in 2004: $35,001 (Individual Income Tax Returns)
Here:
$35,001
State:
$44,480
Salary/wage: $33,393 (reported on 88.7% of returns)
Here:
$33,393
State:
$39,198
(% of AGI for various income ranges: 134.0% for AGIs below $10k, 81.0% for AGIs $10k-25k, 86.9% for AGIs $25k-50k, 83.7% for AGIs $50k-75k, 87.9% for AGIs $75k-100k, 70.8% for AGIs over 100k)
Taxable interest for individuals: $1,040 (reported on 34.4% of returns)
This zip code:
$1,040
Ohio:
$1,532
(% of AGI for various income ranges: 6.7% for AGIs below $10k, 1.9% for AGIs $10k-25k, 0.7% for AGIs $25k-50k, 0.8% for AGIs $50k-75k, 0.7% for AGIs $75k-100k, 1.1% for AGIs over 100k)
Taxable dividends: $1,661 (reported on 14.8% of returns)
Here:
$1,661
State:
$3,496
(% of AGI for various income ranges: 1.7% for AGIs below $10k, 0.6% for AGIs $10k-25k, 0.5% for AGIs $25k-50k, 0.5% for AGIs $50k-75k, 0.8% for AGIs $75k-100k, 2.0% for AGIs over 100k)
Net capital gain/loss: +$2,296 (reported on 10.8% of returns)
Here:
+$2,296
State:
+$8,582
(% of AGI for various income ranges: 3.4% for AGIs below $10k, -0.2% for AGIs $10k-25k, 0.3% for AGIs $25k-50k, 1.4% for AGIs $50k-75k, 0.5% for AGIs $75k-100k, 1.5% for AGIs over 100k)
Profit/loss from business: +$7,260 (reported on 15.1% of returns)
Here:
+$7,260
State:
+$10,813
(% of AGI for various income ranges: -6.8% for AGIs below $10k, 4.1% for AGIs $10k-25k, 2.9% for AGIs $25k-50k, 3.6% for AGIs $50k-75k, 5.5% for AGIs $75k-100k)
IRA payment deduction: $2,667 (reported on 1.2% of returns)
45135:
$2,667
Ohio:
$2,794
Total itemized deductions: $13,568 (22% of AGI, reported on 23.3% of returns)
Here:
$13,568
State:
$17,503
Here:
22.1% of AGI
State:
20.8% of AGI
(% of AGI for various income ranges: 5.0% for AGIs $10k-25k, 7.0% for AGIs $25k-50k, 10.0% for AGIs $50k-75k, 12.6% for AGIs $75k-100k, 15.4% for AGIs over 100k)
Charity contributions deductions: $2,457 (4% of AGI, reported on 15.1% of returns)
Here:
$2,457
State:
$3,087
Here:
3.7% of AGI
State:
3.4% of AGI
(% of AGI for various income ranges: 0.5% for AGIs $10k-25k, 0.6% for AGIs $25k-50k, 1.4% for AGIs $50k-75k, 1.0% for AGIs $75k-100k, 2.6% for AGIs over 100k)
Total tax: $3,783 (reported on 77.0% of returns)
45135:
$3,783
State:
$6,781
(% of AGI for various income ranges: 3.4% for AGIs below $10k, 4.4% for AGIs $10k-25k, 6.7% for AGIs $25k-50k, 8.4% for AGIs $50k-75k, 10.4% for AGIs $75k-100k, 17.0% for AGIs over 100k)
Earned income credit: $1,757 (reported on 15.0% of returns)
Here:
$1,757
State:
$1,696
Percentage of individuals using paid preparers for their 2004 taxes: 66.2%
Here:
66%
State:
55%
(% for various income ranges: 53.6% for AGIs below $10k, 65.0% for AGIs $10k-25k, 73.2% for AGIs $25k-50k, 67.8% for AGIs $50k-75k, 62.6% for AGIs $75k-100k, 68.1% for AGIs over 100k)
Household received Food Stamps/SNAP in the past 12 months: 122 Household did not receive Food Stamps/SNAP in the past 12 months: 1,892
Women who had a birth in the past 12 months: 20 (14 now married, 6 unmarried) Women who did not have a birth in the past 12 months: 1,379 (833 now married, 544 unmarried)
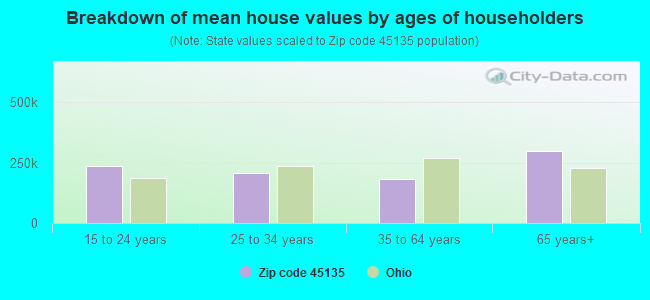
Housing units in zip code 45135 with a mortgage: 1,094 (94 second mortgage, 3 home equity loan, 83 both second mortgage and home equity loan) Median monthly owner costs for units with a mortgage: $1,110 Median monthly owner costs for units without a mortgage: $508
Residents with income below the poverty level in 2022:
This zip code:
5.1%
Whole state:
13.4%
Residents with income below 50% of the poverty level in 2022:
This zip code:
1.8%
Whole state:
7.0%
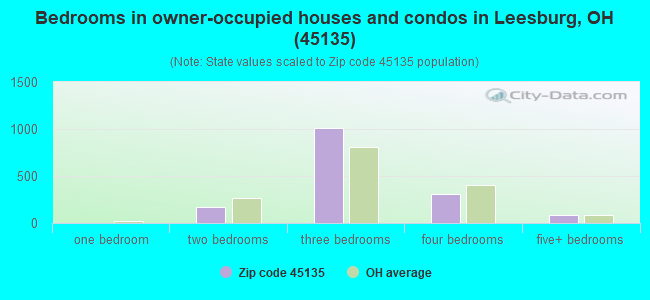
Median number of rooms in houses and condos:
Here:
6.5
State:
6.7
Median number of rooms in apartments:
Here:
5.3
State:
4.4
Notable locations in this zip code not listed on our city pages
Churches in zip code 45135 include: Walnut Hill Church (A), Fairfield Quaker Meeting House (B), Hardin Creek Church (C). Display/hide their locations on the map
Cemeteries: Anders Cemetery (1), Antioch Cemetery (2), Methodist Cemetery (3), Highland Cemetery (4), Hardin Creek Cemetery (5), Cowman Cemetery (6), Crispin Cemetery (7). Display/hide their locations on the map
Size of family households: 460 2-persons, 302 3-persons, 384 4-persons, 63 5-persons, 128 6-persons, 56 7-or-more-persons
Size of nonfamily households: 502 1-person, 106 2-persons
1,648 married couples with children.
190 single-parent households (116 men, 74 women).
98.8% of residents of 45135 zip code speak English at home.
0.1% of residents speak Spanish at home (100% very well).
0.2% of residents speak other Indo-European language at home (100% well).
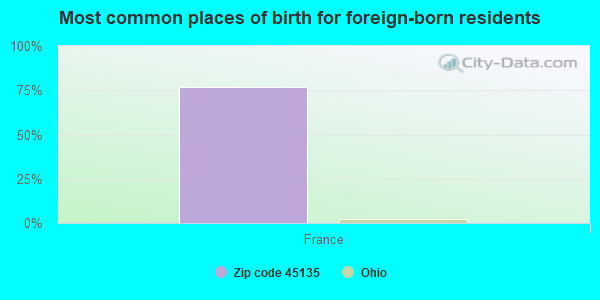
Foreign born population: 13 (0.2%) (100.0% of them are naturalized citizens)
This zip code:
0.2%
Whole state:
5.0%
77%France
45%German
21%English
18%American
4%Irish
3%European
2%Scottish
2%Swiss
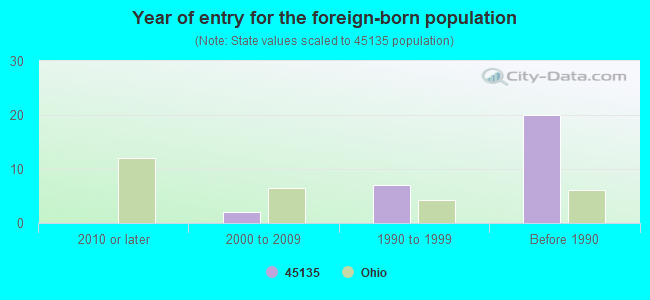
Year of entry for the foreign-born population
02010 or later
22000 to 2009
71990 to 1999
20Before 1990
Facilities with environmental interests located in this zip code:
CANDLE-LITE INC (250 EASTERN AVE. in LEESBURG, OH)
AIR MINOR (AIRS/AFS) STATE MASTER (Ohio general info) - PCS-OH0085456, National Pollutant Discharge Elimination System Permit, AIR MAJOR, EPCRA, TRIS-45135CNDLL250EA, TRI REPORTER Small Quantity Generators, between 100 kg and 1000 kg of hazardous waste/month (Resource Conservation and Recovery Act (tracking hazardous waste)) - notification TRI REPORTER (Tracking of toxic chemicals releasing facilities) Business SIC classification: MANUFACTURING INDUSTRIES Organizations: LANCASTER COLONY CO (CONTACT/OWNER)
Alternative names: LANCASTER COLONY CORP. CANDLE-LITE DIV.
BRYANT BROTHERS GRAIN LLC (10668 RT 28 in LEESBURG, OH)
AIR MINOR (AIRS/AFS) STATE MASTER (Ohio general info) - AIR MAJOR Business SIC classification: GRAIN AND FIELD BEANS Alternative names: INTERNATIONAL MULTIFOODS CORPORATION EAST MONR, INTERNATIONAL MULTIFOODS CORP-EAST MONROE *
Housing units lacking complete plumbing facilities: 3.5% Housing units lacking complete kitchen facilities: 4.1%
40.3%Electricity
28.1%Utility gas
15.3%Bottled, tank, or LP gas
7.3%Wood
4.4%Fuel oil, kerosene, etc.
3.9%Other fuel
0.9%No fuel used
Population in 1990: 3,684.
Place of birth for U.S.-born residents:
This state: 4,561
Northeast: 459
Midwest: 161
South: 315
West: 36
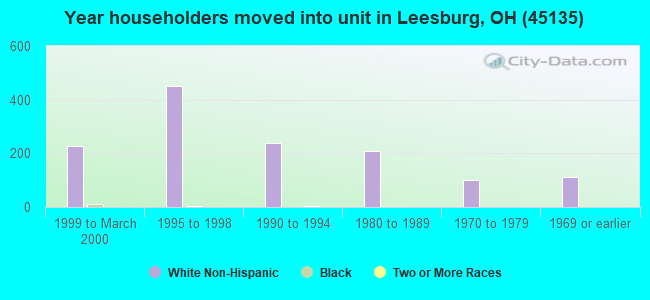
56% of the 45135 zip code residents lived in the same house 5 years ago. Out of people who lived in different houses, 56% lived in this county. Out of people who lived in different counties, 50% lived in Ohio.
97% of the 45135 zip code residents lived in the same house 1 year ago. Out of people who lived in different houses, 30% moved from this county. Out of people who lived in different houses, 81% moved from different county within same state. Out of people who lived in different houses, 12% moved from abroad.
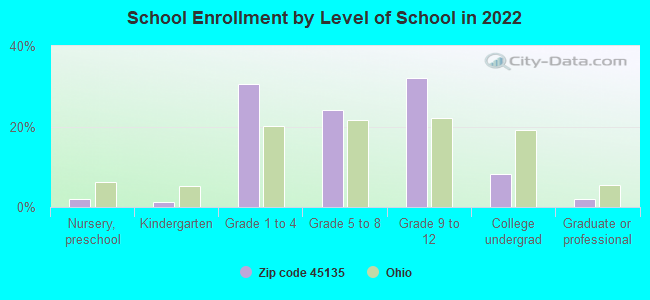
Private vs. public school enrollment:
Students in private schools in grades 1 to 8 (elementary and middle school): 162
Here:
18.5%
Ohio:
16.0%
Students in private schools in grades 9 to 12 (high school): 121
Here:
23.4%
Ohio:
13.1%
Students in private undergraduate colleges: 31
Here:
23.9%
Ohio:
22.3%
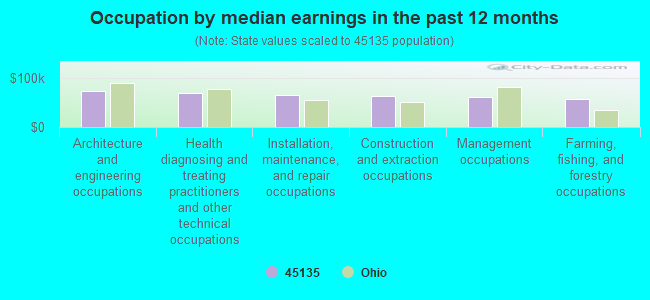
Occupation by median earnings in the past 12 months ($)
72,935Architecture and engineering occupations
68,215Health diagnosing and treating practitioners and other technical occupations
65,611Installation, maintenance, and repair occupations
63,067Construction and extraction occupations
61,583Management occupations
56,671Farming, fishing, and forestry occupations
Companies with federal contracts located in this zip code:
THE MASON COMPANY, INC (260 DEPOT ST in LEESBURG, OH; small business)
$36,923 with Army for Training Aids. Taking place in MO. Signed on 2005-09-14. Completion date: 2005-11-08.
Top industries in this zip code by the number of employees in 2005:
Construction: Poured Concrete Foundation and Structure Contractors (50-99 employees: 1 establishment)
Construction: All Other Specialty Trade Contractors (20-49: 1, 1-4: 2)
Administrative and Support and Waste Management and Remediation Services: Professional Employer Organizations (20-49: 1)
Finance and Insurance: Savings Institutions (10-19: 1)
Other Services (except Public Administration): Religious Organizations (5-9: 1, 1-4: 2)
Fatal accident statistics in 2014:
Fatal accident count: 1
Vehicles involved in fatal accidents: 2
Fatal accidents caused by drunken drivers: 0
Fatalities: 2
Persons involved in fatal accidents: 4
Pedestrians involved in fatal accidents: 0
Fatal accident statistics in 2013:
Fatal accident count: 1
Vehicles involved in fatal accidents: 1
Fatal accidents caused by drunken drivers: 0
Fatalities: 1
Persons involved in fatal accidents: 3
Pedestrians involved in fatal accidents: 0
2002 - 2018 National Fire Incident Reporting System (NFIRS) incidents
Based on the data from the years 2002 - 2018 the average number of fires per year is 23. The highest number of fire incidents - 34 took place in 2010, and the least - 12 in 2017. The data has a growing trend.
When looking into fire subcategories, the most reports belonged to: Structure Fires (51.7%), and Outside Fires (32.3%).
Fire incident types reported to NFIRS in Zip Code 45135


 Nearest zip codes: 45132, 45159, 45123, 45133, 45169, 45166.


 Based on the data from the years 2002 - 2018 the average number of fires per year is 23. The highest number of fire incidents - 34 took place in 2010, and the least - 12 in 2017. The data has a growing trend.
 When looking into fire subcategories, the most reports belonged to: Structure Fires (51.7%), and Outside Fires (32.3%).