Estimated zip code population in 2022: 9,725 Zip code population in 2010: 9,236 Zip code population in 2000: 8,207
Houses and condos: 3,808 Renter-occupied apartments: 1,125
% of renters here:
31%
State:
33%
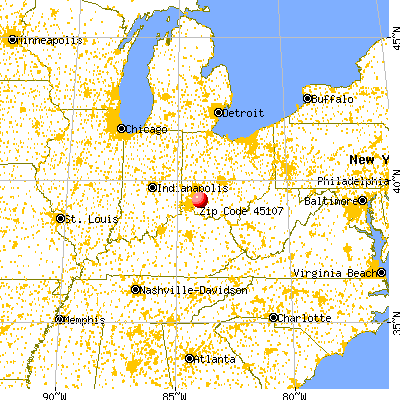
March 2022 cost of living index in zip code 45107: 83.6 (less than average, U.S. average is 100)
Land area: 75.5 sq. mi. Water area: 0.4 sq. mi.
Population density: 129 people per square mile
(very low).
OSM Map
General Map
Google Map
MSN Map
OSM Map
General Map
Google Map
MSN Map
OSM Map
General Map
Google Map
MSN Map
OSM Map
General Map
Google Map
MSN Map
Please wait while loading the map...
Real estate property taxes paid for housing units in 2022:
This zip code:
0.9% ($1,750)
Ohio:
1.3% ($2,639)
Median real estate property taxes paid for housing units with mortgages in 2022: $1,770 (0.9%) Median real estate property taxes paid for housing units with no mortgage in 2022: $1,720 (1.1%)
Business Search- 14 Million verified businesses
Males: 5,118
(52.6%)
Females: 4,608
(47.4%)
For population 25 years and over in 45107:
High school or higher: 87.8%
Bachelor's degree or higher: 14.5%
Graduate or professional degree: 4.7%
Unemployed: 4.4%
Mean travel time to work (commute): 33.5 minutes
For population 15 years and over in 45107:
Never married: 29.0%
Now married: 56.4%
Separated: 0.6%
Widowed: 5.0%
Divorced: 9.0%
Zip code 45107 compared to state average:
Black race population percentage significantly below state average.
Hispanic race population percentage significantly below state average.
Foreign-born population percentage significantly below state average.
Length of stay since moving in above state average.
Number of college students below state average.
Percentage of population with a bachelor's degree or higher significantly below state average.
Estimated median house/condo value in 2022: $189,068
45107:
$189,068
Ohio:
$204,100
According to our research of Ohio and other state lists, there were 15 registered sex offenders living in 45107 zip code as of June 03, 2024. The ratio of all residents to sex offenders in zip code 45107 is 640 to 1. The ratio of registered sex offenders to all residents in this zip code is near the state average.
Median resident age:
This zip code:
37.9 years
Ohio median age:
39.9 years
Average household size:
This zip code:
2.6 people
Ohio:
2.4 people
Averages for the 2020 tax year for zip code 45107, filed in 2021:
Average Adjusted Gross Income (AGI) in 2020: $56,298 (Individual Income Tax Returns)
Here:
$56,298
State:
$67,288
Salary/wage: $49,051 (reported on 84.5% of returns)
Here:
$49,051
State:
$55,628
(% of AGI for various income ranges: 1166.2% for AGIs below $25k, 3604.2% for AGIs $25k-50k, 6552.4% for AGIs $50k-75k, 9762.6% for AGIs $75k-100k, 16580.3% for AGIs $100k-200k, 50213.3% for AGIs over 200k)
Taxable interest for individuals: $703 (reported on 20.9% of returns)
This zip code:
$703
Ohio:
$1,518
(% of AGI for various income ranges: 4.1% for AGIs below $25k, 9.1% for AGIs $25k-50k, 25.3% for AGIs $50k-75k, 30.3% for AGIs $75k-100k, 55.0% for AGIs $100k-200k, 356.7% for AGIs over 200k)
Ordinary dividends: $3,436 (reported on 11.5% of returns)
Here:
$3,436
State:
$7,167
(% of AGI for various income ranges: 9.1% for AGIs below $25k, 14.8% for AGIs $25k-50k, 35.1% for AGIs $50k-75k, 74.3% for AGIs $75k-100k, 277.5% for AGIs $100k-200k, 726.7% for AGIs over 200k)
Net capital gain/loss in AGI: +$11,798 (reported on 10.0% of returns)
Here:
+$11,798
State:
+$18,919
(% of AGI for various income ranges: 6.8% for AGIs below $25k, 16.0% for AGIs $25k-50k, 107.1% for AGIs $50k-75k, 175.4% for AGIs $75k-100k, 388.4% for AGIs $100k-200k, 9006.7% for AGIs over 200k)
Profit/loss from business: +$13,802 (reported on 12.6% of returns)
Here:
+$13,802
State:
+$13,744
(% of AGI for various income ranges: 115.6% for AGIs below $25k, 163.0% for AGIs $25k-50k, 292.9% for AGIs $50k-75k, 310.9% for AGIs $75k-100k, 418.8% for AGIs $100k-200k, 3186.7% for AGIs over 200k)
Taxable individual retirement arrangement distribution: $16,245 (reported on 6.8% of returns)
45107:
$16,245
Ohio:
$18,876
(% of AGI for various income ranges: 43.5% for AGIs below $25k, 68.7% for AGIs $25k-50k, 105.6% for AGIs $50k-75k, 303.1% for AGIs $75k-100k, 683.4% for AGIs $100k-200k)
Total itemized deductions: $30,375 (reported on 2.6% of returns)
Here:
$30,375
State:
$33,869
(% of AGI for various income ranges: 32.3% for AGIs below $25k, 181.2% for AGIs $50k-75k, 429.4% for AGIs $100k-200k, 2876.7% for AGIs over 200k)
Charity contributions: $8,111 (reported on 2.0% of returns)
Here:
$8,111
State:
$14,577
(% of AGI for various income ranges: 22.2% for AGIs $50k-75k, 110.3% for AGIs $100k-200k, 820.0% for AGIs over 200k)
Taxes paid: $6,500 (reported on 2.6% of returns)
45107:
$6,500
State:
$7,681
(% of AGI for various income ranges: 5.5% for AGIs below $25k, 33.9% for AGIs $50k-75k, 93.1% for AGIs $100k-200k, 746.7% for AGIs over 200k)
Earned income credit: $2,364 (reported on 15.7% of returns)
Here:
$2,364
State:
$2,304
(% of AGI for various income ranges: 92.3% for AGIs below $25k, 71.2% for AGIs $25k-50k)
Percentage of individuals using paid preparers for their 2020 taxes: 94.8%
Here:
95%
State:
94%
(% for various income ranges: 94.2% for AGIs below $25k, 95.3% for AGIs $25k-50k, 96.2% for AGIs $50k-75k, 96.1% for AGIs $75k-100k, 92.5% for AGIs $100k-200k, 88.9% for AGIs over 200k)
Averages for the 2012 tax year for zip code 45107, filed in 2013:
Average Adjusted Gross Income (AGI) in 2012: $44,203 (Individual Income Tax Returns)
Here:
$44,203
State:
$54,926
Salary/wage: $38,873 (reported on 85.6% of returns)
Here:
$38,873
State:
$45,869
(% of AGI for various income ranges: 72.2% for AGIs below $25k, 79.6% for AGIs $25k-50k, 79.9% for AGIs $50k-75k, 79.8% for AGIs $75k-100k, 74.2% for AGIs $100k-200k, 35.6% for AGIs over 200k)
Taxable interest for individuals: $709 (reported on 24.2% of returns)
This zip code:
$709
Ohio:
$1,297
(% of AGI for various income ranges: 0.8% for AGIs below $25k, 0.5% for AGIs $25k-50k, 0.4% for AGIs $50k-75k, 0.1% for AGIs $75k-100k, 0.4% for AGIs $100k-200k, 0.2% for AGIs over 200k)
Ordinary dividends: $2,731 (reported on 12.3% of returns)
Here:
$2,731
State:
$5,821
(% of AGI for various income ranges: 0.5% for AGIs below $25k, 0.5% for AGIs $25k-50k, 0.5% for AGIs $50k-75k, 0.7% for AGIs $75k-100k, 1.8% for AGIs $100k-200k)
Net capital gain/loss in AGI: +$3,592 (reported on 8.4% of returns)
Here:
+$3,592
State:
+$11,232
(% of AGI for various income ranges: 0.2% for AGIs $25k-50k, 1.0% for AGIs $75k-100k, 2.6% for AGIs $100k-200k)
Profit/loss from business: +$10,579 (reported on 13.0% of returns)
Here:
+$10,579
State:
+$12,773
(% of AGI for various income ranges: 8.4% for AGIs below $25k, 3.4% for AGIs $25k-50k, 2.0% for AGIs $50k-75k, 1.7% for AGIs $75k-100k, 3.3% for AGIs $100k-200k)
Taxable individual retirement arrangement distribution: $12,748 (reported on 9.1% of returns)
45107:
$12,748
Ohio:
$14,511
(% of AGI for various income ranges: 2.8% for AGIs below $25k, 2.0% for AGIs $25k-50k, 2.4% for AGIs $50k-75k, 2.8% for AGIs $75k-100k, 4.2% for AGIs $100k-200k)
Total itemized deductions: $16,752 (23% of AGI, reported on 24.2% of returns)
Here:
$16,752
State:
$21,278
Here:
22.7% of AGI
State:
18.8% of AGI
(% of AGI for various income ranges: 6.4% for AGIs below $25k, 7.2% for AGIs $25k-50k, 8.3% for AGIs $50k-75k, 10.9% for AGIs $75k-100k, 11.9% for AGIs $100k-200k, 11.8% for AGIs over 200k)
Charity contributions: $2,954 (reported on 15.5% of returns)
Here:
$2,954
State:
$3,943
(% of AGI for various income ranges: 0.5% for AGIs below $25k, 0.7% for AGIs $25k-50k, 0.7% for AGIs $50k-75k, 1.2% for AGIs $75k-100k, 1.6% for AGIs $100k-200k, 2.2% for AGIs over 200k)
Taxes paid: $5,654 (reported on 24.2% of returns)
45107:
$5,654
State:
$9,568
(% of AGI for various income ranges: 1.4% for AGIs below $25k, 1.8% for AGIs $25k-50k, 2.7% for AGIs $50k-75k, 3.8% for AGIs $75k-100k, 4.9% for AGIs $100k-200k, 5.0% for AGIs over 200k)
Earned income credit: $2,247 (reported on 19.4% of returns)
Here:
$2,247
State:
$2,285
(% of AGI for various income ranges: 6.9% for AGIs below $25k, 1.1% for AGIs $25k-50k)
Percentage of individuals using paid preparers for their 2012 taxes: 54.8%
Here:
55%
State:
51%
(% for various income ranges: 48.8% for AGIs below $25k, 59.8% for AGIs $25k-50k, 56.2% for AGIs $50k-75k, 59.5% for AGIs $75k-100k, 56.7% for AGIs $100k-200k, 66.7% for AGIs over 200k)
Averages for the 2004 tax year for zip code 45107, filed in 2005:
Average Adjusted Gross Income (AGI) in 2004: $38,280 (Individual Income Tax Returns)
Here:
$38,280
State:
$44,480
Salary/wage: $35,348 (reported on 88.2% of returns)
Here:
$35,348
State:
$39,198
(% of AGI for various income ranges: 126.1% for AGIs below $10k, 77.3% for AGIs $10k-25k, 84.7% for AGIs $25k-50k, 85.1% for AGIs $50k-75k, 84.5% for AGIs $75k-100k, 65.9% for AGIs over 100k)
Taxable interest for individuals: $1,014 (reported on 36.2% of returns)
This zip code:
$1,014
Ohio:
$1,532
(% of AGI for various income ranges: 5.0% for AGIs below $10k, 1.6% for AGIs $10k-25k, 0.9% for AGIs $25k-50k, 0.7% for AGIs $50k-75k, 0.7% for AGIs $75k-100k, 1.0% for AGIs over 100k)
Taxable dividends: $1,859 (reported on 14.4% of returns)
Here:
$1,859
State:
$3,496
(% of AGI for various income ranges: 1.6% for AGIs below $10k, 0.6% for AGIs $10k-25k, 0.5% for AGIs $25k-50k, 0.8% for AGIs $50k-75k, 0.7% for AGIs $75k-100k, 1.0% for AGIs over 100k)
Net capital gain/loss: +$7,977 (reported on 11.0% of returns)
Here:
+$7,977
State:
+$8,582
(% of AGI for various income ranges: -0.5% for AGIs below $10k, 0.2% for AGIs $10k-25k, 0.7% for AGIs $25k-50k, 1.2% for AGIs $50k-75k, 1.1% for AGIs $75k-100k, 9.8% for AGIs over 100k)
Profit/loss from business: +$8,927 (reported on 13.8% of returns)
Here:
+$8,927
State:
+$10,813
(% of AGI for various income ranges: 3.2% for AGIs below $10k, 4.6% for AGIs $10k-25k, 2.1% for AGIs $25k-50k, 2.9% for AGIs $50k-75k, 4.3% for AGIs $75k-100k, 3.7% for AGIs over 100k)
IRA payment deduction: $2,464 (reported on 1.3% of returns)
45107:
$2,464
Ohio:
$2,794
Self-employed pension: $4,091 (reported on 0.3% of returns)
Here:
$4,091
Ohio:
$13,981
Total itemized deductions: $14,069 (22% of AGI, reported on 32.5% of returns)
Here:
$14,069
State:
$17,503
Here:
22.3% of AGI
State:
20.8% of AGI
(% of AGI for various income ranges: 8.6% for AGIs below $10k, 8.2% for AGIs $10k-25k, 9.8% for AGIs $25k-50k, 13.9% for AGIs $50k-75k, 14.4% for AGIs $75k-100k, 13.1% for AGIs over 100k)
Charity contributions deductions: $2,207 (3% of AGI, reported on 23.0% of returns)
Here:
$2,207
State:
$3,087
Here:
3.3% of AGI
State:
3.4% of AGI
(% of AGI for various income ranges: 0.2% for AGIs below $10k, 0.7% for AGIs $10k-25k, 1.0% for AGIs $25k-50k, 1.4% for AGIs $50k-75k, 1.8% for AGIs $75k-100k, 1.8% for AGIs over 100k)
Total tax: $4,512 (reported on 77.3% of returns)
45107:
$4,512
State:
$6,781
(% of AGI for various income ranges: 4.0% for AGIs below $10k, 4.3% for AGIs $10k-25k, 6.8% for AGIs $25k-50k, 8.4% for AGIs $50k-75k, 10.6% for AGIs $75k-100k, 16.5% for AGIs over 100k)
Earned income credit: $1,675 (reported on 14.3% of returns)
Here:
$1,675
State:
$1,696
Percentage of individuals using paid preparers for their 2004 taxes: 61.1%
Here:
61%
State:
55%
(% for various income ranges: 48.4% for AGIs below $10k, 64.8% for AGIs $10k-25k, 65.3% for AGIs $25k-50k, 63.5% for AGIs $50k-75k, 58.9% for AGIs $75k-100k, 57.4% for AGIs over 100k)
Household received Food Stamps/SNAP in the past 12 months: 524 Household did not receive Food Stamps/SNAP in the past 12 months: 3,143
Women who had a birth in the past 12 months: 163 (103 now married, 60 unmarried) Women who did not have a birth in the past 12 months: 2,081 (1,021 now married, 1,059 unmarried)
Housing units in zip code 45107 with a mortgage: 1,431 (157 second mortgage, 135 both second mortgage and home equity loan) Houses without a mortgage: 69
Median monthly owner costs for units with a mortgage: $1,228 Median monthly owner costs for units without a mortgage: $515
Residents with income below the poverty level in 2022:
This zip code:
15.2%
Whole state:
13.4%
Residents with income below 50% of the poverty level in 2022:
This zip code:
9.2%
Whole state:
7.0%
Median number of rooms in houses and condos:
Here:
6.2
State:
6.7
Median number of rooms in apartments:
Here:
4.4
State:
4.4
Notable locations in this zip code not listed on our city pages
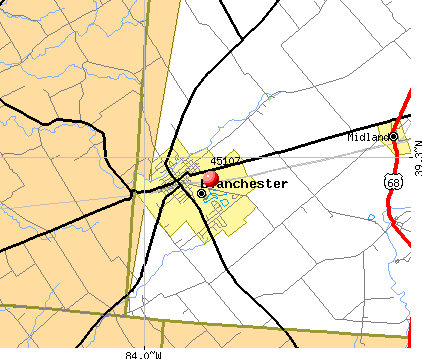
Notable locations in zip code 45107: Blanchester Community Service Association (A), Blanchester - Marion Township Volunteer Fire Department (B), Harlan Township Fire and Rescue Station 82 (C), Blanchester Public Library (D), Marion Township House (E), Blanchester Municipal Building (F). Display/hide their locations on the map
Churches in zip code 45107 include: First Universalist Church (A), Second Creek Church (B), Blanchester Church of Christ (C), Blanchester Church of the Nazarene (D), First Baptist Church (E), First Church of God (F), Grace United Methodist Church (G), Moores Fork Baptist Church (H), Woodville Baptist Church (I). Display/hide their locations on the map
Cemeteries: Independent Order of Odd Fellows Cemetery (1), Templin Cemetery (2), Dunham Cemetery (3), Engle Cemetery (4), Garrison Cemetery (5), West Mary Cemetery (6), Moore-Johns Cemetery (7). Display/hide their locations on the map
Reservoirs: Blanchester Reservoir Number Three (A), Blanchester Upground Reservoir N (B), Winandi Reservoir (C), Houston Upground Reservoir (D), Blanchester Reservoir Number Four (E). Display/hide their locations on the map
Streams, rivers, and creeks: Whitakers Run (A), Hunter Creek (B), West Fork East Fork Little Miami River (C), Right Fork Second Creek (D). Display/hide their locations on the map
In group quarters: 109 (-1 institutionalized population)
Size of family households: 1,270 2-persons, 719 3-persons, 480 4-persons, 191 5-persons, 55 6-persons, 58 7-or-more-persons
Size of nonfamily households: 722 1-person, 149 2-persons
1,246 married couples with children.
531 single-parent households (127 men, 404 women).
98.2% of residents of 45107 zip code speak English at home.
1.4% of residents speak Spanish at home (56% very well, 32% well, 8% not well, 4% not at all).
Foreign born population: 52 (0.5%) (67.1% of them are naturalized citizens)
This zip code:
0.5%
Whole state:
5.0%
92%Honduras
13%France
26%German
16%English
12%American
7%Irish
3%Scottish
2%European
1%Scotch-Irish
Year of entry for the foreign-born population
122010 or later
212000 to 2009
201990 to 1999
11Before 1990
Facilities with environmental interests located in this zip code:
BP AMOCO OIL CORP BULK PLANT BLANCHESTER (210 S. WRIGHT ST in BLANCHESTER, OH)
(Integrated Compliance Information System) - ICIS-05-1996-0567, FORMAL ENFORCEMENT ACTION STATE MASTER (Ohio general info) - PCS-OH0122874, National Pollutant Discharge Elimination System Permit, RCRA-OHD000723247, HAZARDOUS WASTE PROGRAM, AIR MAJOR, EPCRA National Pollutant Discharge Elimination System NON-MAJOR (Tracking pollutant discharge elimination systems) - permit Conditionally Exempt Small Quantity Generators, less than 100 kg/month of hazardous waste (Resource Conservation and Recovery Act (tracking hazardous waste)) - notification Business SIC classification: PETROLEUM BULK STATIONS AND TERMINALS; PETROLEUM AND PETROLEUM PRODUCTS WHOLESALERS, EXCEPT BULK STATIONS AND TERMINALS Organizations: BP OIL COMPANY (CONTACT/OWNER)
, BP EXPLORATION & OIL INC (CONTACT/OWNER)
, BP OIL COMPANY (CONTACT/OWNER)
Alternative names: BP OIL CO, BP OIL COMPANY BLANCHESTER BULK PLANT, BP OIL CO BULK PLT
BLANCHESTER FOUNDRY CO INC (214 CHERRY STREET in BLANCHESTER, OH)
AIR MAJOR (AIRS/AFS) CRITERIA AND HAZARDOUS AIR POLLUTANT INVENTORY (Inventory of air pollution sources) STATE MASTER (Ohio general info) - AIR MAJOR, EPCRA, TRIS-45107THBLN214EC, TRI REPORTER, RCRA-OHD004234639, HAZARDOUS WASTE PROGRAM (Resource Conservation and Recovery Act (tracking hazardous waste)) TRI REPORTER (Tracking of toxic chemicals releasing facilities) Business SIC classification: GRAY AND DUCTILE IRON FOUNDRIES
BLANCHESTER WWTP (600 WEST MAIN ST in BLANCHESTER, OH)
STATE MASTER (Ohio general info) - PCS-OH0021733, National Pollutant Discharge Elimination System Permit National Pollutant Discharge Elimination System NON-MAJOR (Tracking pollutant discharge elimination systems) - permit National Pollutant Discharge Elimination System NON-MAJOR (Tracking pollutant discharge elimination systems) - permit Business SIC classification: SEWERAGE SYSTEMS Organizations: VILLAGE OF BLANCHESTER (CONTACT/OWNER)
, BLANCHESTER VILLAGE OF (CONTACT/OWNER)
Alternative names: BLANCHESTER STP, BLANCHESTER, VILLAGE OF, CITY OF BLANCHESTER, VILLAGE OF BLANCHESTER
AMERICAN SHOWA INC BLANCHESTER PLANT (3343 ST. RTE. 28 in BLANCHESTER, OH)
CRITERIA AND HAZARDOUS AIR POLLUTANT INVENTORY (Inventory of air pollution sources) STATE MASTER (Ohio general info) - RCRA-OHD084746932, HAZARDOUS WASTE PROGRAM, AIR MAJOR, EPCRA, TRIS-45107MRCNS3343S, TRI REPORTER HAZARDOUS WASTE BIENNIAL REPORTER (Resource Conservation and Recovery Act (tracking hazardous waste)) Small Quantity Generators, between 100 kg and 1000 kg of hazardous waste/month (Resource Conservation and Recovery Act (tracking hazardous waste)) TRI REPORTER (Tracking of toxic chemicals releasing facilities) Business SIC classification: MOTOR VEHICLE PARTS AND ACCESSORIES Alternative names: AMERICAN SHOWA BLANCHESTER PLANT
ALLEN CO (712 E MAIN ST in BLANCHESTER, OH)
STATE MASTER (Ohio general info) - AIR MAJOR Small Quantity Generators, between 100 kg and 1000 kg of hazardous waste/month (Resource Conservation and Recovery Act (tracking hazardous waste)) - notification TRI REPORTER (Tracking of toxic chemicals releasing facilities) Business SIC classification: GLASS PRODUCTS, MADE OF PURCHASED GLASS; COATING, ENGRAVING, AND ALLIED SERVICES Organizations: ALLEN WILLIAM (CONTACT/OWNER)
Alternative names: ALLEN CO.
BLAN AUTO BODY INC (114 S WRITGHT ST in BLANCHESTER, OH)
STATE MASTER (Ohio general info) - RCRA-OHR000002774, HAZARDOUS WASTE PROGRAM Conditionally Exempt Small Quantity Generators, less than 100 kg/month of hazardous waste (Resource Conservation and Recovery Act (tracking hazardous waste)) - notification Organizations: KOI (CONTACT/OWNER)
BLANCHESTER HIGH SCHOOL (4000 STATE ROUTE 28 in BLANCHESTER, OH)
(Geographic Names Information System) (National Center for Education Statistics) - STATE ID-002840 Organizations: BLANCHESTER LOCAL SD (SCHOOL DISTRICT)
BLANCHESTER JUNIOR HIGH SCHOO (4004 STATE ROUTE 28 in BLANCHESTER, OH)
(National Center for Education Statistics) - STATE ID-002832 Organizations: BLANCHESTER LOCAL SD (SCHOOL DISTRICT)
BILL MARTINS CHEVY OLDS (204 S BROADWAY in BLANCHESTER, OH)
(Resource Conservation and Recovery Act (tracking hazardous waste)) Organizations: RUSSELL E BROWN (CONTACT/OWNER)
CERTIFIED GAS STATION #447 (10984 ST RT 28 & 123 in BLANCHESTER, OH)
AIR MINOR (AIRS/AFS) Business SIC classification: GASOLINE SERVICE STATIONS
BLANCHESTER LOCAL SD (410 E JOHN ST in BLANCHESTER, OH)
COMPLIANCE ACTIVITY (Tracking inspections of insecticide, fungicide, and rodenticide, and toxic substances)
Housing units lacking complete plumbing facilities: 1.5% Housing units lacking complete kitchen facilities: 1.4%
53.9%Electricity
16.6%Utility gas
12.7%Bottled, tank, or LP gas
6.8%Other fuel
4.6%Wood
4.5%Fuel oil, kerosene, etc.
0.9%No fuel used
Population in 1990: 6,158. Population change in the 1990s: +2,049 (+33.3%).
Place of birth for U.S.-born residents:
This state: 8,033
Northeast: 41
Midwest: 286
South: 1,075
West: 189
60% of the 45107 zip code residents lived in the same house 5 years ago. Out of people who lived in different houses, 58% lived in this county. Out of people who lived in different counties, 50% lived in Ohio.
92% of the 45107 zip code residents lived in the same house 1 year ago. Out of people who lived in different houses, 16% moved from this county. Out of people who lived in different houses, 84% moved from different county within same state. Out of people who lived in different houses, 7% moved from different state.
Private vs. public school enrollment:
Students in private schools in grades 1 to 8 (elementary and middle school): 66
Here:
6.9%
Ohio:
16.0%
Students in private schools in grades 9 to 12 (high school): 68
Here:
12.5%
Ohio:
13.1%
Students in private undergraduate colleges: 27
Here:
15.3%
Ohio:
22.3%
Occupation by median earnings in the past 12 months ($)
107,453Architecture and engineering occupations
86,981Computer and mathematical occupations
71,538Health diagnosing and treating practitioners and other technical occupations
69,260Management occupations
62,761Installation, maintenance, and repair occupations
58,458Business and financial operations occupations
Top industries in this zip code by the number of employees in 2005:
Health Care and Social Assistance: Nursing Care Facilities (50-99 employees: 2 establishments)
Finance and Insurance: Commercial Banking (20-49: 1, 5-9: 1)
Other Services (except Public Administration): Commercial and Industrial Machinery and Equipment (except Automotive and Electronic) Repair and Maintenance (20-49: 1, 1-4: 2)
People in group quarters in 2010:
102 people in nursing facilities/skilled-nursing facilities
People in group quarters in 2000:
127 people in nursing homes
Fatal accident statistics in 2014:
Fatal accident count: 2
Vehicles involved in fatal accidents: 3
Fatal accidents caused by drunken drivers: 0
Fatalities: 2
Persons involved in fatal accidents: 5
Pedestrians involved in fatal accidents: 1
Fatal accident statistics in 2012:
Fatal accident count: 2
Vehicles involved in fatal accidents: 4
Fatal accidents caused by drunken drivers: 1
Fatalities: 2
Persons involved in fatal accidents: 5
Pedestrians involved in fatal accidents: 1
Home Mortgage Disclosure Act Aggregated Statistics For Year 2009 (Based on 6 partial tracts)
A) FHA, FSA/RHS & VA Home Purchase Loans
B) Conventional Home Purchase Loans
C) Refinancings
D) Home Improvement Loans
F) Non-occupant Loans on < 5 Family Dwellings (A B C & D)
G) Loans On Manufactured Home Dwelling (A B C & D)
Number
Average Value
Number
Average Value
Number
Average Value
Number
Average Value
Number
Average Value
Number
Average Value
LOANS ORIGINATED
20
$112,036
21
$134,776
158
$153,707
5
$26,334
8
$149,261
9
$61,221
APPLICATIONS APPROVED, NOT ACCEPTED
2
$81,955
2
$166,015
13
$146,639
1
$35,500
1
$23,340
2
$82,870
APPLICATIONS DENIED
7
$122,043
6
$105,785
68
$153,943
5
$64,406
3
$155,027
9
$83,257
APPLICATIONS WITHDRAWN
3
$137,470
4
$80,895
35
$151,966
1
$46,690
3
$92,293
1
$126,660
FILES CLOSED FOR INCOMPLETENESS
0
$0
0
$0
7
$152,073
0
$0
0
$0
1
$80,870
Aggregated Statistics For Year 2008 (Based on 6 partial tracts)
A) FHA, FSA/RHS & VA Home Purchase Loans
B) Conventional Home Purchase Loans
C) Refinancings
D) Home Improvement Loans
F) Non-occupant Loans on < 5 Family Dwellings (A B C & D)
G) Loans On Manufactured Home Dwelling (A B C & D)
Number
Average Value
Number
Average Value
Number
Average Value
Number
Average Value
Number
Average Value
Number
Average Value
LOANS ORIGINATED
20
$119,632
29
$125,675
90
$160,644
10
$61,361
11
$130,635
12
$90,795
APPLICATIONS APPROVED, NOT ACCEPTED
2
$88,085
3
$105,917
11
$145,103
3
$32,100
1
$144,070
1
$57,500
APPLICATIONS DENIED
5
$97,200
10
$126,958
72
$138,280
10
$67,519
2
$55,840
12
$75,126
APPLICATIONS WITHDRAWN
3
$105,893
6
$106,408
29
$158,120
2
$98,260
1
$138,870
3
$105,470
FILES CLOSED FOR INCOMPLETENESS
0
$0
1
$110,540
7
$162,060
0
$0
0
$0
0
$0
Aggregated Statistics For Year 2007 (Based on 6 partial tracts)
A) FHA, FSA/RHS & VA Home Purchase Loans
B) Conventional Home Purchase Loans
C) Refinancings
D) Home Improvement Loans
F) Non-occupant Loans on < 5 Family Dwellings (A B C & D)
G) Loans On Manufactured Home Dwelling (A B C & D)
Number
Average Value
Number
Average Value
Number
Average Value
Number
Average Value
Number
Average Value
Number
Average Value
LOANS ORIGINATED
17
$116,465
54
$136,329
115
$135,651
17
$51,311
10
$123,209
18
$81,532
APPLICATIONS APPROVED, NOT ACCEPTED
1
$75,510
9
$128,993
27
$113,202
5
$53,722
1
$55,810
5
$77,750
APPLICATIONS DENIED
6
$100,673
16
$95,414
104
$128,970
16
$60,788
3
$124,180
17
$80,487
APPLICATIONS WITHDRAWN
2
$128,080
9
$148,074
42
$128,049
3
$73,077
2
$149,220
3
$87,987
FILES CLOSED FOR INCOMPLETENESS
0
$0
2
$84,305
16
$156,079
0
$0
0
$0
1
$69,380
Aggregated Statistics For Year 2006 (Based on 6 partial tracts)
A) FHA, FSA/RHS & VA Home Purchase Loans
B) Conventional Home Purchase Loans
C) Refinancings
D) Home Improvement Loans
F) Non-occupant Loans on < 5 Family Dwellings (A B C & D)
G) Loans On Manufactured Home Dwelling (A B C & D)
Number
Average Value
Number
Average Value
Number
Average Value
Number
Average Value
Number
Average Value
Number
Average Value
LOANS ORIGINATED
13
$122,834
77
$123,400
135
$124,102
13
$56,628
11
$122,966
18
$83,510
APPLICATIONS APPROVED, NOT ACCEPTED
2
$95,635
15
$101,406
30
$100,940
4
$23,720
2
$61,775
6
$66,313
APPLICATIONS DENIED
2
$108,355
17
$99,345
110
$114,413
21
$47,241
5
$137,622
19
$76,542
APPLICATIONS WITHDRAWN
1
$82,870
10
$130,403
44
$111,205
4
$61,248
2
$61,335
4
$100,100
FILES CLOSED FOR INCOMPLETENESS
0
$0
3
$142,820
19
$146,562
1
$61,170
0
$0
1
$115,170
Aggregated Statistics For Year 2005 (Based on 6 partial tracts)
A) FHA, FSA/RHS & VA Home Purchase Loans
B) Conventional Home Purchase Loans
C) Refinancings
D) Home Improvement Loans
F) Non-occupant Loans on < 5 Family Dwellings (A B C & D)
G) Loans On Manufactured Home Dwelling (A B C & D)
Number
Average Value
Number
Average Value
Number
Average Value
Number
Average Value
Number
Average Value
Number
Average Value
LOANS ORIGINATED
13
$108,035
103
$124,122
158
$131,233
22
$76,741
16
$109,555
22
$84,266
APPLICATIONS APPROVED, NOT ACCEPTED
2
$90,245
14
$93,823
33
$120,480
3
$26,053
1
$182,200
6
$83,977
APPLICATIONS DENIED
4
$108,590
34
$106,714
138
$134,578
21
$53,413
5
$79,238
22
$77,471
APPLICATIONS WITHDRAWN
1
$129,320
13
$122,620
64
$139,701
10
$189,646
3
$163,543
6
$77,715
FILES CLOSED FOR INCOMPLETENESS
1
$120,940
4
$100,365
15
$143,129
1
$60,260
1
$121,790
0
$0
Aggregated Statistics For Year 2004 (Based on 6 partial tracts)
A) FHA, FSA/RHS & VA Home Purchase Loans
B) Conventional Home Purchase Loans
C) Refinancings
D) Home Improvement Loans
F) Non-occupant Loans on < 5 Family Dwellings (A B C & D)
G) Loans On Manufactured Home Dwelling (A B C & D)
Number
Average Value
Number
Average Value
Number
Average Value
Number
Average Value
Number
Average Value
Number
Average Value
LOANS ORIGINATED
16
$118,708
91
$128,588
191
$127,696
16
$38,833
13
$112,882
20
$85,757
APPLICATIONS APPROVED, NOT ACCEPTED
1
$110,770
11
$122,977
37
$119,976
3
$37,730
2
$77,175
4
$97,510
APPLICATIONS DENIED
5
$129,150
24
$98,196
125
$113,189
20
$36,658
2
$45,735
22
$87,568
APPLICATIONS WITHDRAWN
3
$94,487
11
$140,186
75
$126,477
3
$67,900
3
$124,860
6
$110,995
FILES CLOSED FOR INCOMPLETENESS
1
$97,580
3
$82,397
15
$138,117
1
$32,930
0
$0
0
$0
Aggregated Statistics For Year 2003 (Based on 6 partial tracts)
A) FHA, FSA/RHS & VA Home Purchase Loans
B) Conventional Home Purchase Loans
C) Refinancings
D) Home Improvement Loans
F) Non-occupant Loans on < 5 Family Dwellings (A B C & D)
Number
Average Value
Number
Average Value
Number
Average Value
Number
Average Value
Number
Average Value
LOANS ORIGINATED
18
$124,741
73
$128,734
388
$121,256
12
$58,735
13
$122,728
APPLICATIONS APPROVED, NOT ACCEPTED
1
$51,650
8
$99,100
61
$109,817
5
$28,728
0
$0
APPLICATIONS DENIED
4
$95,555
24
$80,384
124
$112,987
13
$19,835
3
$69,090
APPLICATIONS WITHDRAWN
2
$134,350
6
$112,728
62
$118,004
3
$37,410
1
$99,990
FILES CLOSED FOR INCOMPLETENESS
1
$75,270
2
$75,350
24
$120,841
1
$79,680
0
$0
Aggregated Statistics For Year 2002 (Based on 4 partial tracts)
A) FHA, FSA/RHS & VA Home Purchase Loans
B) Conventional Home Purchase Loans
C) Refinancings
D) Home Improvement Loans
F) Non-occupant Loans on < 5 Family Dwellings (A B C & D)
Number
Average Value
Number
Average Value
Number
Average Value
Number
Average Value
Number
Average Value
LOANS ORIGINATED
13
$101,118
46
$119,435
233
$114,263
13
$23,546
14
$92,011
APPLICATIONS APPROVED, NOT ACCEPTED
1
$59,910
7
$91,700
53
$104,538
3
$39,650
2
$64,220
APPLICATIONS DENIED
4
$83,662
19
$88,131
105
$105,606
11
$21,423
2
$84,800
APPLICATIONS WITHDRAWN
1
$98,330
7
$162,227
50
$110,428
1
$32,870
1
$68,360
FILES CLOSED FOR INCOMPLETENESS
0
$0
0
$0
16
$116,735
1
$34,610
0
$0
Aggregated Statistics For Year 2001 (Based on 4 partial tracts)
A) FHA, FSA/RHS & VA Home Purchase Loans
B) Conventional Home Purchase Loans
C) Refinancings
D) Home Improvement Loans
E) Loans on Dwellings For 5+ Families
F) Non-occupant Loans on < 5 Family Dwellings (A B C & D)
Number
Average Value
Number
Average Value
Number
Average Value
Number
Average Value
Number
Average Value
Number
Average Value
LOANS ORIGINATED
20
$107,442
48
$118,699
182
$108,659
15
$29,179
0
$0
11
$95,489
APPLICATIONS APPROVED, NOT ACCEPTED
1
$91,230
11
$78,404
40
$91,187
4
$25,258
0
$0
0
$0
APPLICATIONS DENIED
2
$101,305
17
$83,055
92
$90,558
19
$22,359
1
$202,960
2
$106,715
APPLICATIONS WITHDRAWN
3
$92,080
5
$159,016
52
$91,206
3
$40,307
0
$0
1
$56,410
FILES CLOSED FOR INCOMPLETENESS
1
$71,460
1
$167,390
9
$116,992
0
$0
0
$0
0
$0
Aggregated Statistics For Year 2000 (Based on 4 partial tracts)
A) FHA, FSA/RHS & VA Home Purchase Loans
B) Conventional Home Purchase Loans
C) Refinancings
D) Home Improvement Loans
F) Non-occupant Loans on < 5 Family Dwellings (A B C & D)
Number
Average Value
Number
Average Value
Number
Average Value
Number
Average Value
Number
Average Value
LOANS ORIGINATED
9
$97,260
48
$97,982
73
$80,020
20
$21,938
8
$65,541
APPLICATIONS APPROVED, NOT ACCEPTED
2
$73,810
14
$72,186
32
$76,799
6
$20,442
2
$55,245
APPLICATIONS DENIED
5
$81,302
35
$67,367
57
$80,674
18
$19,109
2
$62,370
APPLICATIONS WITHDRAWN
3
$68,023
4
$111,538
28
$70,990
2
$47,075
0
$0
FILES CLOSED FOR INCOMPLETENESS
0
$0
0
$0
9
$76,827
0
$0
0
$0
Aggregated Statistics For Year 1999 (Based on 2 partial tracts)
A) FHA, FSA/RHS & VA Home Purchase Loans
B) Conventional Home Purchase Loans
C) Refinancings
D) Home Improvement Loans
F) Non-occupant Loans on < 5 Family Dwellings (A B C & D)
2002 - 2018 National Fire Incident Reporting System (NFIRS) incidents
Based on the data from the years 2002 - 2018 the average number of fires per year is 45. The highest number of fire incidents - 74 took place in 2010, and the least - 19 in 2006. The data has a declining trend.
When looking into fire subcategories, the most reports belonged to: Structure Fires (49.0%), and Outside Fires (38.7%).
Fire incident types reported to NFIRS in Zip Code 45107


 Nearest zip codes: 45148, 45113, 45162, 45118, 45145, 45152.


 Based on the data from the years 2002 - 2018 the average number of fires per year is 45. The highest number of fire incidents - 74 took place in 2010, and the least - 19 in 2006. The data has a declining trend.
 When looking into fire subcategories, the most reports belonged to: Structure Fires (49.0%), and Outside Fires (38.7%).