Estimated zip code population in 2022: 1,457 Zip code population in 2010: 1,397 Zip code population in 2000: 1,402
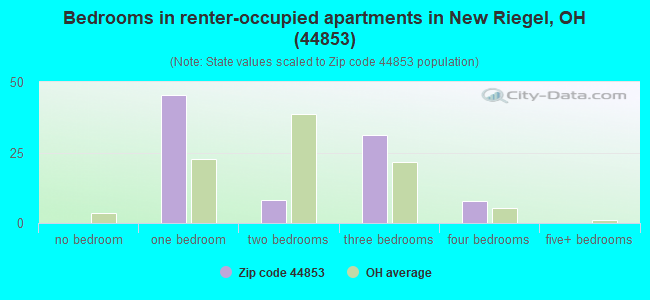
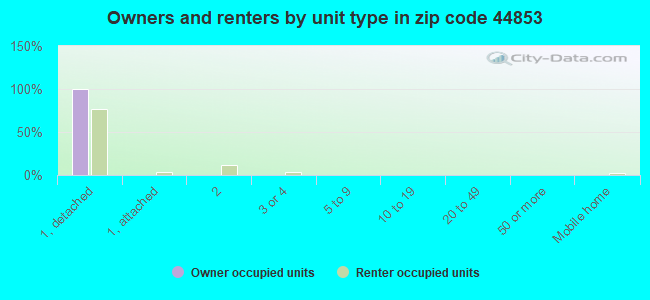
Houses and condos: 552 Renter-occupied apartments: 92
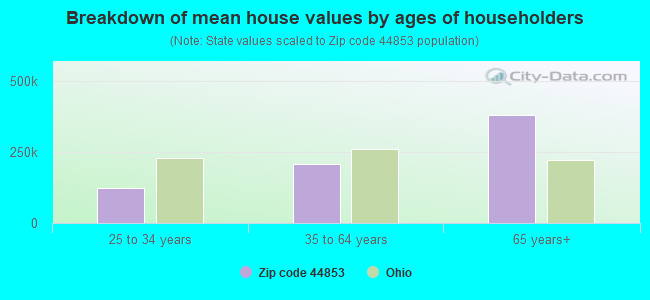
% of renters here:
17%
State:
33%
March 2022 cost of living index in zip code 44853: 81.7 (low, U.S. average is 100)
Land area: 27.3 sq. mi. Water area: 0.0 sq. mi.
Population density: 53 people per square mile
(very low).
OSM Map
General Map
Google Map
MSN Map
OSM Map
General Map
Google Map
MSN Map
OSM Map
General Map
Google Map
MSN Map
OSM Map
General Map
Google Map
MSN Map
Please wait while loading the map...
Real estate property taxes paid for housing units in 2022:
This zip code:
0.7% ($1,421)
Ohio:
1.3% ($2,639)
Median real estate property taxes paid for housing units with mortgages in 2022: $1,431 (0.8%) Median real estate property taxes paid for housing units with no mortgage in 2022: $1,420 (0.7%)
Business Search- 14 Million verified businesses
Males: 769
(52.8%)
Females: 688
(47.2%)
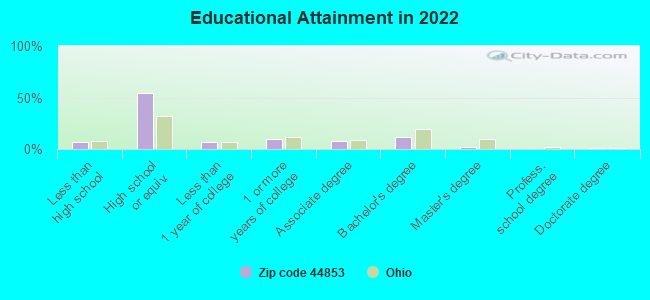
For population 25 years and over in 44853:
High school or higher: 91.8%
Bachelor's degree or higher: 14.3%
Graduate or professional degree: 3.1%
Unemployed: 0.3%
Mean travel time to work (commute): 20.4 minutes
For population 15 years and over in 44853:
Never married: 19.0%
Now married: 68.2%
Separated: 1.9%
Widowed: 3.4%
Divorced: 7.5%
Zip code 44853 compared to state average:
Unemployed percentage significantly below state average.
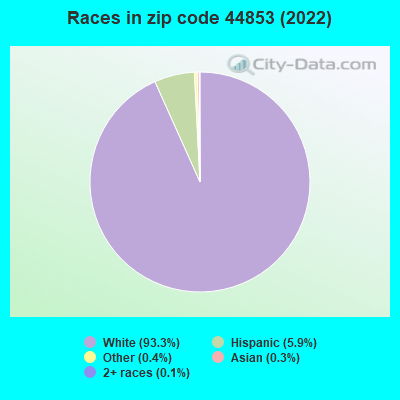
Black race population percentage significantly below state average.
Median age above state average.
Foreign-born population percentage significantly below state average.
Renting percentage below state average.
Length of stay since moving in significantly above state average.
Number of college students significantly below state average.
Percentage of population with a bachelor's degree or higher below state average.
Averages for the 2020 tax year for zip code 44853, filed in 2021:
Average Adjusted Gross Income (AGI) in 2020: $57,207 (Individual Income Tax Returns)
Here:
$57,207
State:
$67,288
Salary/wage: $51,170 (reported on 81.1% of returns)
Here:
$51,170
State:
$55,628
(% of AGI for various income ranges: 1136.7% for AGIs below $25k, 3706.4% for AGIs $25k-50k, 7672.5% for AGIs $50k-75k, 11218.0% for AGIs $75k-100k, 17717.1% for AGIs $100k-200k)
Taxable interest for individuals: $810 (reported on 41.9% of returns)
This zip code:
$810
Ohio:
$1,518
(% of AGI for various income ranges: 49.2% for AGIs below $25k, 38.6% for AGIs $25k-50k, 66.2% for AGIs $50k-75k, 68.0% for AGIs $75k-100k, 72.9% for AGIs $100k-200k)
Ordinary dividends: $2,154 (reported on 32.4% of returns)
Here:
$2,154
State:
$7,167
(% of AGI for various income ranges: 25.0% for AGIs below $25k, 35.0% for AGIs $25k-50k, 88.8% for AGIs $50k-75k, 138.0% for AGIs $75k-100k, 425.7% for AGIs $100k-200k)
Net capital gain/loss in AGI: +$4,295 (reported on 27.0% of returns)
Here:
+$4,295
State:
+$18,919
(% of AGI for various income ranges: 12.5% for AGIs below $25k, 75.7% for AGIs $25k-50k, 98.8% for AGIs $50k-75k, 434.0% for AGIs $75k-100k, 631.4% for AGIs $100k-200k)
Profit/loss from business: +$13,514 (reported on 9.5% of returns)
Here:
+$13,514
State:
+$13,744
(% of AGI for various income ranges: 150.0% for AGIs below $25k, 153.8% for AGIs $50k-75k, 918.6% for AGIs $100k-200k)
Taxable individual retirement arrangement distribution: $14,990 (reported on 13.5% of returns)
44853:
$14,990
Ohio:
$18,876
(% of AGI for various income ranges: 106.7% for AGIs below $25k, 164.3% for AGIs $25k-50k, 625.0% for AGIs $50k-75k, 915.7% for AGIs $100k-200k)
Earned income credit: $2,700 (reported on 8.1% of returns)
Here:
$2,700
State:
$2,304
(% of AGI for various income ranges: 63.3% for AGIs below $25k, 61.4% for AGIs $25k-50k)
Percentage of individuals using paid preparers for their 2020 taxes: 94.6%
Here:
95%
State:
94%
(% for various income ranges: 90.5% for AGIs below $25k, 94.7% for AGIs $25k-50k, 92.3% for AGIs $50k-75k, 100.0% for AGIs $75k-100k, 100.0% for AGIs $100k-200k)
Averages for the 2012 tax year for zip code 44853, filed in 2013:
Average Adjusted Gross Income (AGI) in 2012: $46,753 (Individual Income Tax Returns)
Here:
$46,753
State:
$54,926
Salary/wage: $40,223 (reported on 81.3% of returns)
Here:
$40,223
State:
$45,869
(% of AGI for various income ranges: 71.4% for AGIs below $25k, 74.7% for AGIs $25k-50k, 82.0% for AGIs $50k-75k, 74.2% for AGIs $75k-100k, 56.3% for AGIs $100k-200k)
Taxable interest for individuals: $803 (reported on 44.0% of returns)
This zip code:
$803
Ohio:
$1,297
(% of AGI for various income ranges: 1.6% for AGIs below $25k, 1.5% for AGIs $25k-50k, 0.4% for AGIs $50k-75k, 0.4% for AGIs $75k-100k, 0.3% for AGIs $100k-200k)
Ordinary dividends: $1,700 (reported on 25.3% of returns)
Here:
$1,700
State:
$5,821
(% of AGI for various income ranges: 1.0% for AGIs below $25k, 0.5% for AGIs $25k-50k, 0.6% for AGIs $50k-75k, 0.5% for AGIs $75k-100k, 1.6% for AGIs $100k-200k)
Net capital gain/loss in AGI: +$8,542 (reported on 16.0% of returns)
Here:
+$8,542
State:
+$11,232
(% of AGI for various income ranges: 2.7% for AGIs $50k-75k, 7.9% for AGIs $100k-200k)
Profit/loss from business: +$4,725 (reported on 10.7% of returns)
Here:
+$4,725
State:
+$12,773
(% of AGI for various income ranges: 3.9% for AGIs below $25k, 1.0% for AGIs $25k-50k, 2.5% for AGIs $50k-75k)
Taxable individual retirement arrangement distribution: $6,880 (reported on 13.3% of returns)
44853:
$6,880
Ohio:
$14,511
(% of AGI for various income ranges: 5.6% for AGIs below $25k, 3.4% for AGIs $25k-50k, 3.1% for AGIs $50k-75k)
Total itemized deductions: $17,245 (17% of AGI, reported on 14.7% of returns)
Here:
$17,245
State:
$21,278
Here:
16.7% of AGI
State:
18.8% of AGI
(% of AGI for various income ranges: 6.3% for AGIs $25k-50k, 8.7% for AGIs $50k-75k, 7.2% for AGIs $100k-200k)
Charity contributions: $1,386 (reported on 9.3% of returns)
Here:
$1,386
State:
$3,943
(% of AGI for various income ranges: 0.3% for AGIs $25k-50k, 0.3% for AGIs $50k-75k, 0.5% for AGIs $100k-200k)
Taxes paid: $6,718 (reported on 14.7% of returns)
44853:
$6,718
State:
$9,568
(% of AGI for various income ranges: 1.7% for AGIs $25k-50k, 2.7% for AGIs $50k-75k, 3.8% for AGIs $100k-200k)
Earned income credit: $2,300 (reported on 9.3% of returns)
Here:
$2,300
State:
$2,285
(% of AGI for various income ranges: 3.3% for AGIs below $25k, 0.6% for AGIs $25k-50k)
Percentage of individuals using paid preparers for their 2012 taxes: 70.7%
Here:
71%
State:
51%
(% for various income ranges: 63.0% for AGIs below $25k, 75.0% for AGIs $25k-50k, 72.7% for AGIs $50k-75k, 83.3% for AGIs $75k-100k, 71.4% for AGIs $100k-200k)
Averages for the 2004 tax year for zip code 44853, filed in 2005:
Average Adjusted Gross Income (AGI) in 2004: $36,016 (Individual Income Tax Returns)
Here:
$36,016
State:
$44,480
Salary/wage: $33,707 (reported on 86.6% of returns)
Here:
$33,707
State:
$39,198
(% of AGI for various income ranges: 103.8% for AGIs below $10k, 72.0% for AGIs $10k-25k, 84.9% for AGIs $25k-50k, 88.4% for AGIs $50k-75k, 93.0% for AGIs $75k-100k, 53.8% for AGIs over 100k)
Taxable interest for individuals: $1,009 (reported on 60.0% of returns)
This zip code:
$1,009
Ohio:
$1,532
(% of AGI for various income ranges: 8.4% for AGIs below $10k, 4.6% for AGIs $10k-25k, 1.7% for AGIs $25k-50k, 0.8% for AGIs $50k-75k, 0.3% for AGIs $75k-100k, 0.9% for AGIs over 100k)
Taxable dividends: $1,157 (reported on 28.7% of returns)
Here:
$1,157
State:
$3,496
(% of AGI for various income ranges: 0.7% for AGIs below $10k, 1.4% for AGIs $10k-25k, 0.6% for AGIs $25k-50k, 0.3% for AGIs $50k-75k, 0.3% for AGIs $75k-100k, 2.9% for AGIs over 100k)
Net capital gain/loss: +$630 (reported on 16.9% of returns)
Here:
+$630
State:
+$8,582
(% of AGI for various income ranges: -1.6% for AGIs below $10k, -0.1% for AGIs $10k-25k, -0.2% for AGIs $25k-50k, 0.0% for AGIs $50k-75k, -0.3% for AGIs $75k-100k, 2.9% for AGIs over 100k)
Profit/loss from business: +$1,364 (reported on 7.3% of returns)
Here:
+$1,364
State:
+$10,813
Profit/loss from farming: +$2,162 (reported on 9.8% of returns)
Here:
+$2,162
State:
-$3,706
(% of AGI for various income ranges: -16.2% for AGIs below $10k, 2.8% for AGIs $10k-25k, 2.5% for AGIs $25k-50k, -0.7% for AGIs $50k-75k)
IRA payment deduction: $3,379 (reported on 3.9% of returns)
44853:
$3,379
Ohio:
$2,794
Total itemized deductions: $12,761 (18% of AGI, reported on 17.8% of returns)
Here:
$12,761
State:
$17,503
Here:
17.9% of AGI
State:
20.8% of AGI
(% of AGI for various income ranges: 4.0% for AGIs $10k-25k, 6.1% for AGIs $25k-50k, 5.4% for AGIs $50k-75k, 8.2% for AGIs $75k-100k, 9.3% for AGIs over 100k)
Charity contributions deductions: $1,922 (2% of AGI, reported on 13.6% of returns)
Here:
$1,922
State:
$3,087
Here:
2.5% of AGI
State:
3.4% of AGI
(% of AGI for various income ranges: 0.8% for AGIs $25k-50k, 0.5% for AGIs $50k-75k, 0.6% for AGIs $75k-100k, 1.7% for AGIs over 100k)
Total tax: $3,894 (reported on 76.3% of returns)
44853:
$3,894
State:
$6,781
(% of AGI for various income ranges: 2.5% for AGIs below $10k, 4.5% for AGIs $10k-25k, 7.1% for AGIs $25k-50k, 8.6% for AGIs $50k-75k, 9.1% for AGIs $75k-100k, 13.2% for AGIs over 100k)
Earned income credit: $1,667 (reported on 7.6% of returns)
Here:
$1,667
State:
$1,696
Percentage of individuals using paid preparers for their 2004 taxes: 70.5%
Here:
70%
State:
55%
(% for various income ranges: 63.6% for AGIs below $10k, 68.3% for AGIs $10k-25k, 75.8% for AGIs $25k-50k, 67.6% for AGIs $50k-75k, 74.4% for AGIs $75k-100k, 81.0% for AGIs over 100k)
Household received Food Stamps/SNAP in the past 12 months: 13 Household did not receive Food Stamps/SNAP in the past 12 months: 528
Women who had a birth in the past 12 months: 7 (8 now married, 0 unmarried) Women who did not have a birth in the past 12 months: 248 (172 now married, 75 unmarried)
Housing units in zip code 44853 with a mortgage: 182 (12 second mortgage, 4 home equity loan, 7 both second mortgage and home equity loan) Houses without a mortgage: 8
Median monthly owner costs for units with a mortgage: $1,139 Median monthly owner costs for units without a mortgage: $474
Residents with income below the poverty level in 2022:
This zip code:
4.8%
Whole state:
13.4%
Residents with income below 50% of the poverty level in 2022:
This zip code:
2.8%
Whole state:
7.0%
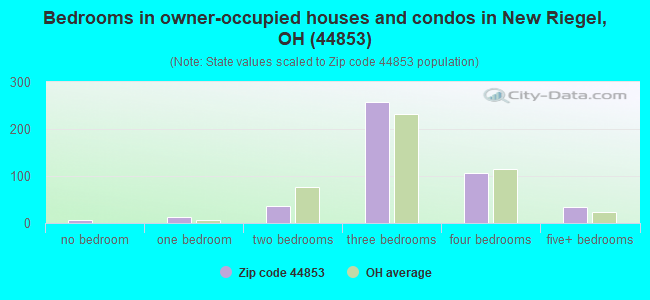
Median number of rooms in houses and condos:
Here:
6.6
State:
6.7
Median number of rooms in apartments:
Here:
4.3
State:
4.4
Notable locations in this zip code not listed on our city pages
In group quarters: 2 (-1 institutionalized population)
Size of family households: 208 2-persons, 67 3-persons, 65 4-persons, 70 5-persons, 3 6-persons, 7 7-or-more-persons
Size of nonfamily households: 87 1-person, 30 2-persons
271 married couples with children.
76 single-parent households (47 men, 29 women).
98.3% of residents of 44853 zip code speak English at home.
0.6% of residents speak Spanish at home (75% very well, 25% not well).
0.7% of residents speak other Indo-European language at home (100% very well).
Foreign born population: 1 (0.1%) (100.0% of them are naturalized citizens)
This zip code:
0.1%
Whole state:
5.0%
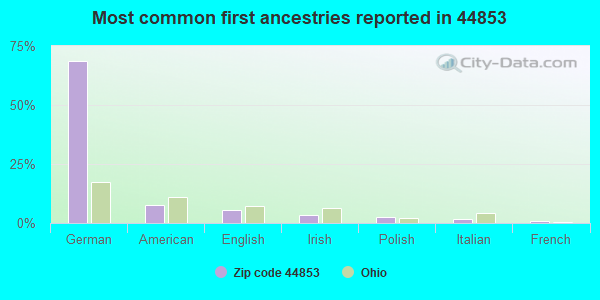
69%German
8%American
6%English
3%Irish
3%Polish
2%Italian
1%French
Housing units lacking complete plumbing facilities: 1.6% Housing units lacking complete kitchen facilities: 6.9%
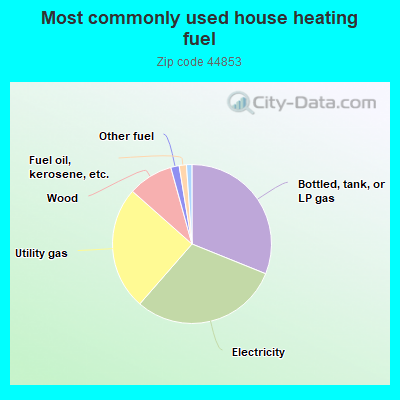
31.2%Bottled, tank, or LP gas
30.4%Electricity
25.2%Utility gas
9.2%Wood
1.7%Other fuel
1.5%Fuel oil, kerosene, etc.
1.1%No fuel used
Population in 1990: 1,483.
Place of birth for U.S.-born residents:
This state: 1,349
Northeast: 7
Midwest: 50
South: 33
West: 14
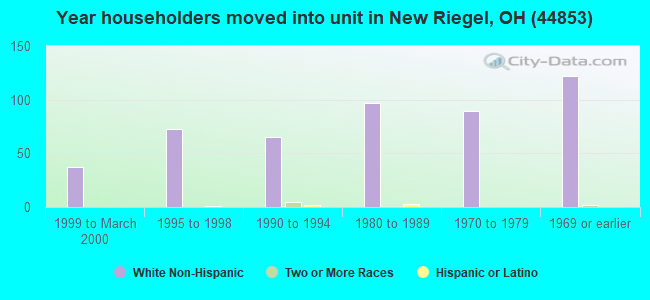
81% of the 44853 zip code residents lived in the same house 5 years ago. Out of people who lived in different houses, 76% lived in this county. Out of people who lived in different counties, 50% lived in Ohio.
90% of the 44853 zip code residents lived in the same house 1 year ago. Out of people who lived in different houses, 82% moved from this county. Out of people who lived in different houses, 11% moved from different county within same state. Out of people who lived in different houses, 1% moved from different state.
Private vs. public school enrollment:
Students in private schools in grades 1 to 8 (elementary and middle school): 5
Here:
2.6%
Ohio:
16.0%
Students in private schools in grades 9 to 12 (high school):
Here:
0.0%
Ohio:
13.1%
Students in private undergraduate colleges: 14
Here:
88.8%
Ohio:
22.3%
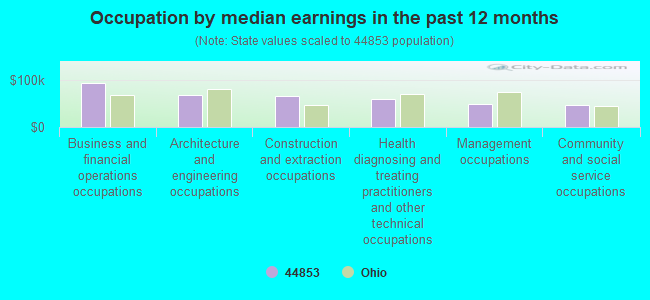
Occupation by median earnings in the past 12 months ($)
94,471Business and financial operations occupations
68,844Architecture and engineering occupations
67,005Construction and extraction occupations
61,003Health diagnosing and treating practitioners and other technical occupations
50,220Management occupations
47,909Community and social service occupations
Top industries in this zip code by the number of employees in 2005:
Other Services (except Public Administration): Religious Organizations (20-49 employees: 1 establishment, 1-4 employees: 1 establishment)
Accommodation and Food Services: Hotels (except Casino Hotels) and Motels (20-49: 1)
Accommodation and Food Services: Full-Service Restaurants (20-49: 1)
Construction: Commercial and Institutional Building Construction (20-49: 1)
Accommodation and Food Services: Limited-Service Restaurants (20-49: 1)
Construction: Electrical Contractors (10-19: 1)
Other Services (except Public Administration): Civic and Social Organizations (5-9: 1, 1-4: 1)
People in group quarters in 2000:
7 people in other workers' dormitories
2 people in religious group quarters
Fatal accident statistics in 2013:
Fatal accident count: 1
Vehicles involved in fatal accidents: 2
Fatal accidents caused by drunken drivers: 0
Fatalities: 1
Persons involved in fatal accidents: 3
Pedestrians involved in fatal accidents: 0
Fatal accident statistics in 2011:
Fatal accident count: 1
Vehicles involved in fatal accidents: 1
Fatal accidents caused by drunken drivers: 0
Fatalities: 1
Persons involved in fatal accidents: 1
Pedestrians involved in fatal accidents: 0
2003 - 2018 National Fire Incident Reporting System (NFIRS) incidents
According to the data from the years 2003 - 2018 the average number of fires per year is 9. The highest number of fire incidents - 15 took place in 2015, and the least - 2 in 2014. The data has a dropping trend.
When looking into fire subcategories, the most incidents belonged to: Structure Fires (47.4%), and Outside Fires (43.8%).
Fire incident types reported to NFIRS in Zip Code 44853


+$2,162
-$3,706
(% of AGI for various income ranges: -16.2% for AGIs below $10k, 2.8% for AGIs $10k-25k, 2.5% for AGIs $25k-50k, -0.7% for AGIs $50k-75k)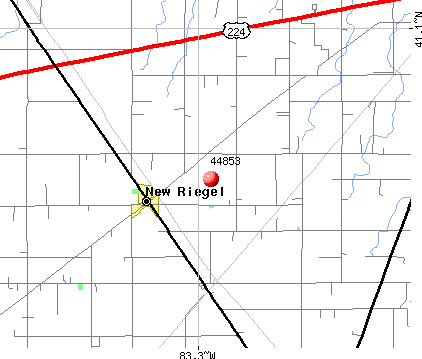 Nearest zip codes: 44844, 44809, 44802, 43316, 44883, 44830.
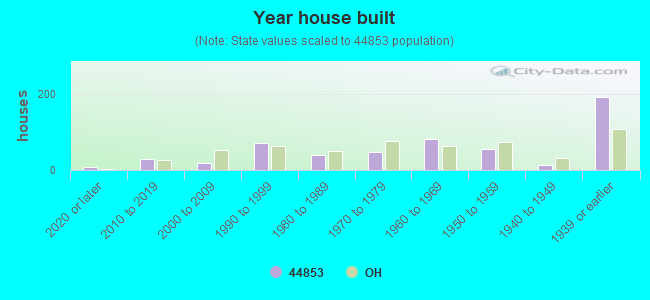


 According to the data from the years 2003 - 2018 the average number of fires per year is 9. The highest number of fire incidents - 15 took place in 2015, and the least - 2 in 2014. The data has a dropping trend.
 When looking into fire subcategories, the most incidents belonged to: Structure Fires (47.4%), and Outside Fires (43.8%).