Estimated zip code population in 2022: 2,411 Zip code population in 2010: 1,996 Zip code population in 2000: 1,968
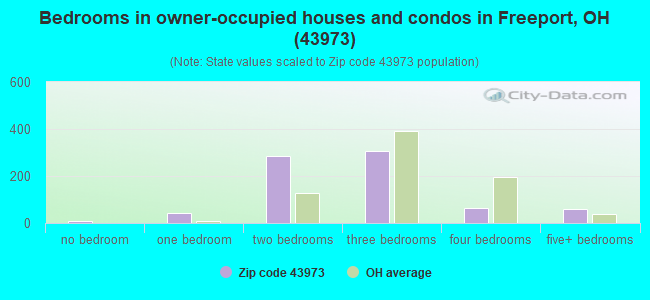
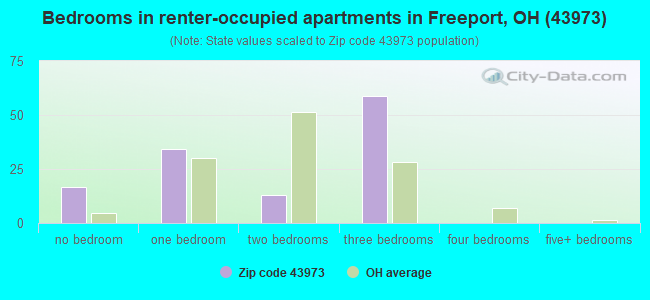
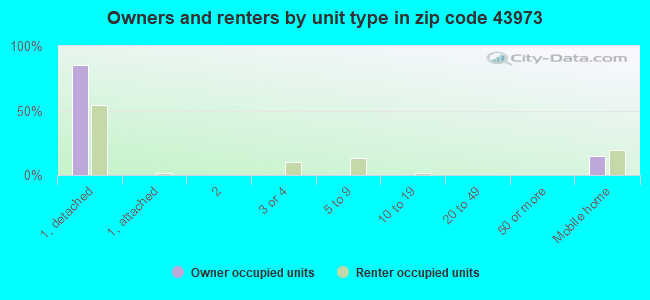
Houses and condos: 1,348 Renter-occupied apartments: 123
% of renters here:
14%
State:
33%
March 2022 cost of living index in zip code 43973: 83.0 (low, U.S. average is 100)
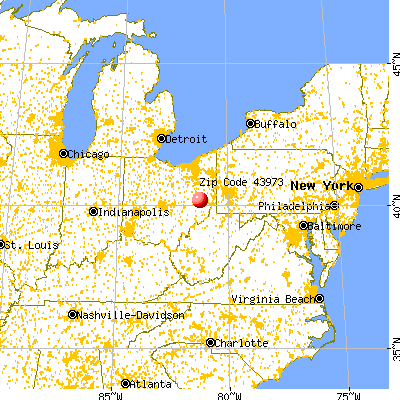
Land area: 90.2 sq. mi. Water area: 1.3 sq. mi.
Population density: 27 people per square mile
(very low).
OSM Map
General Map
Google Map
MSN Map
OSM Map
General Map
Google Map
MSN Map
OSM Map
General Map
Google Map
MSN Map
OSM Map
General Map
Google Map
MSN Map
Please wait while loading the map...
Real estate property taxes paid for housing units in 2022:
This zip code:
0.7% ($1,351)
Ohio:
1.3% ($2,639)
Median real estate property taxes paid for housing units with mortgages in 2022: $1,361 (0.7%) Median real estate property taxes paid for housing units with no mortgage in 2022: $1,338 (0.8%)
Business Search- 14 Million verified businesses
Males: 1,244
(51.6%)
Females: 1,167
(48.4%)
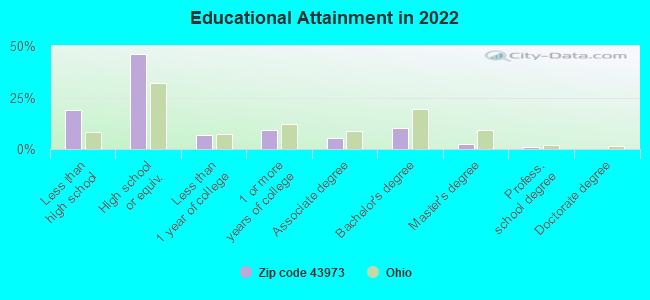
For population 25 years and over in 43973:
High school or higher: 78.8%
Bachelor's degree or higher: 13.3%
Graduate or professional degree: 3.3%
Unemployed: 2.8%
Mean travel time to work (commute): 34.6 minutes
For population 15 years and over in 43973:
Never married: 22.5%
Now married: 56.7%
Separated: 0.1%
Widowed: 4.8%
Divorced: 15.9%
Zip code 43973 compared to state average:
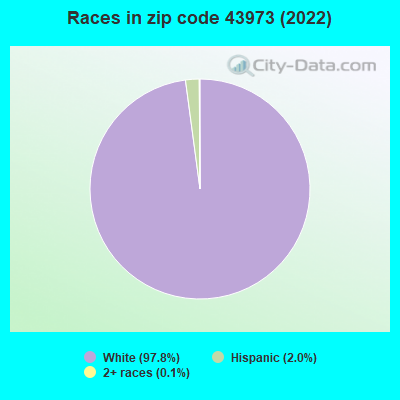
Black race population percentage significantly below state average.
Hispanic race population percentage below state average.
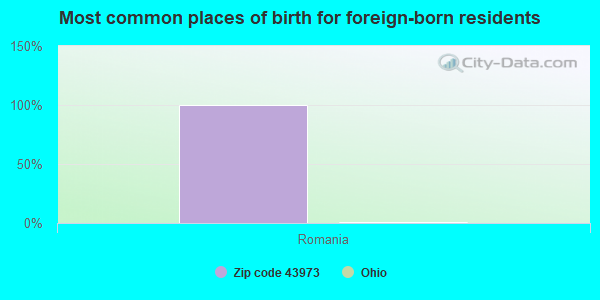
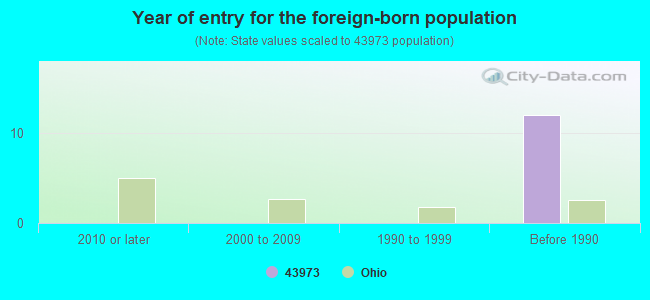
Foreign-born population percentage significantly below state average.
Renting percentage significantly below state average.
Length of stay since moving in below state average.
Percentage of population with a bachelor's degree or higher significantly below state average.
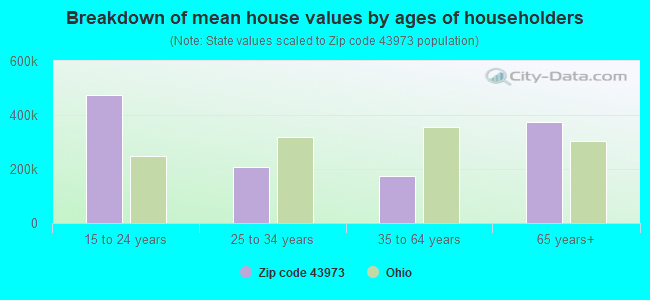
Estimated median house/condo value in 2022: $193,745
43973:
$193,745
Ohio:
$204,100
According to our research of Ohio and other state lists, there were 3 registered sex offenders living in 43973 zip code as of July 03, 2024. The ratio of all residents to sex offenders in zip code 43973 is 771 to 1. The ratio of registered sex offenders to all residents in this zip code is lower than the state average.
Median resident age:
This zip code:
38.3 years
Ohio median age:
39.9 years
Average household size:
This zip code:
2.7 people
Ohio:
2.4 people
Averages for the 2020 tax year for zip code 43973, filed in 2021:
Average Adjusted Gross Income (AGI) in 2020: $55,488 (Individual Income Tax Returns)
Here:
$55,488
State:
$67,288
Salary/wage: $44,025 (reported on 73.1% of returns)
Here:
$44,025
State:
$55,628
(% of AGI for various income ranges: 1187.6% for AGIs below $25k, 3430.7% for AGIs $25k-50k, 6078.0% for AGIs $50k-75k, 10440.0% for AGIs $75k-100k, 16036.0% for AGIs $100k-200k)
Taxable interest for individuals: $710 (reported on 26.9% of returns)
This zip code:
$710
Ohio:
$1,518
(% of AGI for various income ranges: 7.6% for AGIs below $25k, 16.4% for AGIs $25k-50k, 17.0% for AGIs $50k-75k, 82.5% for AGIs $75k-100k, 126.0% for AGIs $100k-200k)
Ordinary dividends: $1,700 (reported on 14.1% of returns)
Here:
$1,700
State:
$7,167
(% of AGI for various income ranges: 35.9% for AGIs below $25k, 25.0% for AGIs $50k-75k, 202.0% for AGIs $100k-200k)
Net capital gain/loss in AGI: +$3,433 (reported on 11.5% of returns)
Here:
+$3,433
State:
+$18,919
(% of AGI for various income ranges: 70.6% for AGIs below $25k, 89.0% for AGIs $50k-75k, 200.0% for AGIs $100k-200k)
Profit/loss from business: +$16,275 (reported on 15.4% of returns)
Here:
+$16,275
State:
+$13,744
(% of AGI for various income ranges: 185.9% for AGIs below $25k, 353.6% for AGIs $25k-50k, 449.0% for AGIs $50k-75k, 1732.5% for AGIs $75k-100k)
Taxable individual retirement arrangement distribution: $8,417 (reported on 7.7% of returns)
43973:
$8,417
Ohio:
$18,876
(% of AGI for various income ranges: 153.6% for AGIs $25k-50k, 725.0% for AGIs $75k-100k)
Earned income credit: $2,327 (reported on 14.1% of returns)
Here:
$2,327
State:
$2,304
(% of AGI for various income ranges: 104.1% for AGIs below $25k, 56.4% for AGIs $25k-50k)
Percentage of individuals using paid preparers for their 2020 taxes: 96.2%
Here:
96%
State:
94%
(% for various income ranges: 96.3% for AGIs below $25k, 95.0% for AGIs $25k-50k, 92.9% for AGIs $50k-75k, 100.0% for AGIs $75k-100k, 100.0% for AGIs $100k-200k)
Averages for the 2012 tax year for zip code 43973, filed in 2013:
Average Adjusted Gross Income (AGI) in 2012: $59,608 (Individual Income Tax Returns)
Here:
$59,608
State:
$54,926
Salary/wage: $37,349 (reported on 77.0% of returns)
Here:
$37,349
State:
$45,869
(% of AGI for various income ranges: 64.2% for AGIs below $25k, 70.0% for AGIs $25k-50k, 75.8% for AGIs $50k-75k, 76.2% for AGIs $75k-100k, 61.5% for AGIs $100k-200k)
Taxable interest for individuals: $775 (reported on 32.4% of returns)
This zip code:
$775
Ohio:
$1,297
(% of AGI for various income ranges: 2.0% for AGIs below $25k, 0.3% for AGIs $25k-50k, 0.1% for AGIs $50k-75k, 0.6% for AGIs over 200k)
Ordinary dividends: $1,233 (reported on 12.2% of returns)
Here:
$1,233
State:
$5,821
(% of AGI for various income ranges: 1.1% for AGIs below $25k, 0.1% for AGIs $25k-50k, 0.4% for AGIs $50k-75k, 0.4% for AGIs $100k-200k)
Net capital gain/loss in AGI: +$2,640 (reported on 6.8% of returns)
Here:
+$2,640
State:
+$11,232
(% of AGI for various income ranges: 0.6% for AGIs $25k-50k, 1.1% for AGIs $100k-200k)
Profit/loss from business: +$13,300 (reported on 14.9% of returns)
Here:
+$13,300
State:
+$12,773
(% of AGI for various income ranges: 8.0% for AGIs below $25k, 6.1% for AGIs $25k-50k, 5.1% for AGIs $50k-75k, 7.1% for AGIs $75k-100k)
Taxable individual retirement arrangement distribution: $5,600 (reported on 9.5% of returns)
43973:
$5,600
Ohio:
$14,511
(% of AGI for various income ranges: 4.9% for AGIs below $25k, 2.9% for AGIs $50k-75k)
Total itemized deductions: $25,200 (15% of AGI, reported on 12.2% of returns)
Here:
$25,200
State:
$21,278
Here:
14.5% of AGI
State:
18.8% of AGI
(% of AGI for various income ranges: 3.8% for AGIs $25k-50k, 7.4% for AGIs $50k-75k, 19.6% for AGIs $100k-200k)
Charity contributions: $4,520 (reported on 6.8% of returns)
Here:
$4,520
State:
$3,943
(% of AGI for various income ranges: 0.9% for AGIs $25k-50k, 2.2% for AGIs $100k-200k)
Taxes paid: $11,233 (reported on 12.2% of returns)
43973:
$11,233
State:
$9,568
(% of AGI for various income ranges: 1.7% for AGIs $25k-50k, 2.1% for AGIs $50k-75k, 9.9% for AGIs $100k-200k)
Earned income credit: $2,025 (reported on 16.2% of returns)
Here:
$2,025
State:
$2,285
(% of AGI for various income ranges: 4.8% for AGIs below $25k, 0.9% for AGIs $25k-50k)
Percentage of individuals using paid preparers for their 2012 taxes: 60.8%
Here:
61%
State:
51%
(% for various income ranges: 48.1% for AGIs below $25k, 66.7% for AGIs $25k-50k, 66.7% for AGIs $50k-75k, 60.0% for AGIs $75k-100k, 66.7% for AGIs $100k-200k, 100.0% for AGIs over 200k)
Averages for the 2004 tax year for zip code 43973, filed in 2005:
Average Adjusted Gross Income (AGI) in 2004: $28,505 (Individual Income Tax Returns)
Here:
$28,505
State:
$44,480
Salary/wage: $27,983 (reported on 80.9% of returns)
Here:
$27,983
State:
$39,198
(% of AGI for various income ranges: 79.6% for AGIs below $10k, 67.3% for AGIs $10k-25k, 78.9% for AGIs $25k-50k, 88.0% for AGIs $50k-75k, 81.1% for AGIs $75k-100k)
Taxable interest for individuals: $824 (reported on 37.8% of returns)
This zip code:
$824
Ohio:
$1,532
(% of AGI for various income ranges: 2.2% for AGIs below $10k, 1.9% for AGIs $10k-25k, 1.3% for AGIs $25k-50k, 0.6% for AGIs $50k-75k, 0.1% for AGIs $75k-100k)
Taxable dividends: $980 (reported on 12.5% of returns)
Here:
$980
State:
$3,496
(% of AGI for various income ranges: 1.6% for AGIs below $10k, 0.5% for AGIs $10k-25k, 0.4% for AGIs $25k-50k, 0.6% for AGIs $50k-75k, 0.1% for AGIs $75k-100k)
Net capital gain/loss: +$1,808 (reported on 9.3% of returns)
Here:
+$1,808
State:
+$8,582
(% of AGI for various income ranges: 0.9% for AGIs below $10k, 0.1% for AGIs $10k-25k, 0.7% for AGIs $25k-50k, 1.1% for AGIs $50k-75k)
Profit/loss from business: +$7,234 (reported on 15.8% of returns)
Here:
+$7,234
State:
+$10,813
(% of AGI for various income ranges: 11.7% for AGIs below $10k, 8.6% for AGIs $10k-25k, 5.2% for AGIs $25k-50k, 0.4% for AGIs $50k-75k)
Total itemized deductions: $13,258 (25% of AGI, reported on 11.4% of returns)
Here:
$13,258
State:
$17,503
Here:
25.2% of AGI
State:
20.8% of AGI
(% of AGI for various income ranges: 2.8% for AGIs $10k-25k, 5.7% for AGIs $25k-50k, 5.2% for AGIs $50k-75k, 8.2% for AGIs $75k-100k)
Charity contributions deductions: $2,250 (4% of AGI, reported on 6.6% of returns)
Here:
$2,250
State:
$3,087
Here:
4.2% of AGI
State:
3.4% of AGI
Total tax: $2,915 (reported on 71.8% of returns)
43973:
$2,915
State:
$6,781
(% of AGI for various income ranges: 2.3% for AGIs below $10k, 4.6% for AGIs $10k-25k, 6.2% for AGIs $25k-50k, 8.8% for AGIs $50k-75k, 12.0% for AGIs $75k-100k)
Earned income credit: $1,612 (reported on 17.7% of returns)
Here:
$1,612
State:
$1,696
Percentage of individuals using paid preparers for their 2004 taxes: 62.4%
Here:
62%
State:
55%
(% for various income ranges: 52.0% for AGIs below $10k, 58.9% for AGIs $10k-25k, 70.6% for AGIs $25k-50k, 64.0% for AGIs $50k-75k, 75.0% for AGIs $75k-100k)
Household received Food Stamps/SNAP in the past 12 months: 128 Household did not receive Food Stamps/SNAP in the past 12 months: 750
Women who had a birth in the past 12 months: 127 (92 now married, 35 unmarried) Women who did not have a birth in the past 12 months: 258 (118 now married, 139 unmarried)
Housing units in zip code 43973 with a mortgage: 282 (78 second mortgage, 43 both second mortgage and home equity loan) Houses without a mortgage: 46
Median monthly owner costs for units with a mortgage: $1,358 Median monthly owner costs for units without a mortgage: $409
Residents with income below the poverty level in 2022:
This zip code:
17.6%
Whole state:
13.4%
Residents with income below 50% of the poverty level in 2022:
This zip code:
10.7%
Whole state:
7.0%
Median number of rooms in houses and condos:
Here:
5.9
State:
6.7
Median number of rooms in apartments:
Here:
4.2
State:
4.4
Notable locations in this zip code not listed on our city pages
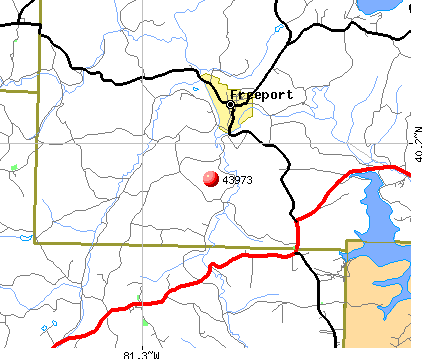
Notable locations in zip code 43973: Freeport Volunteer Fire and Emergency Medical Services (A), Antrim Community Volunteer Fire Department (B). Display/hide their locations on the map
Churches in zip code 43973 include: Chestnut Hill United Brethren Church (A), Pleasant Hill Church (B), Antrim Mennonite Church (C). Display/hide their locations on the map
Cemeteries: Scotch Covenanter Cemetery (1), Bond Cemetery (2), Sunset View Cemetery (3), Engle Cemetery (4), George Cemetery (5), Greenmont Cemetery (6), Kerr-Boyd Cemetery (7). Display/hide their locations on the map
Streams, rivers, and creeks: Millers Fork (A), McFadden Run (B), Huff Run (C), Elk Run (D), Skull Fork (E), Craborchard Creek (F), Bearman Run (G), Atkinson Creek (H), Boggs Fork (I). Display/hide their locations on the map
Size of family households: 235 2-persons, 160 3-persons, 93 4-persons, 16 5-persons, 64 6-persons, 59 7-or-more-persons
Size of nonfamily households: 189 1-person, 54 2-persons
514 married couples with children.
74 single-parent households (19 men, 55 women).
93.4% of residents of 43973 zip code speak English at home.
6.4% of residents speak other Indo-European language at home (67% very well, 33% well).
Foreign born population: 13 (0.6%) (100.0% of them are naturalized citizens)
This zip code:
0.6%
Whole state:
5.0%
100%Romania
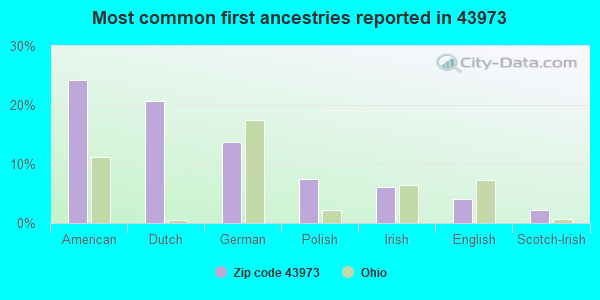
24%American
21%Dutch
14%German
7%Polish
6%Irish
4%English
2%Scotch-Irish
Year of entry for the foreign-born population
02010 or later
02000 to 2009
01990 to 1999
12Before 1990
Housing units lacking complete plumbing facilities: 13.1% Housing units lacking complete kitchen facilities: 6.7%
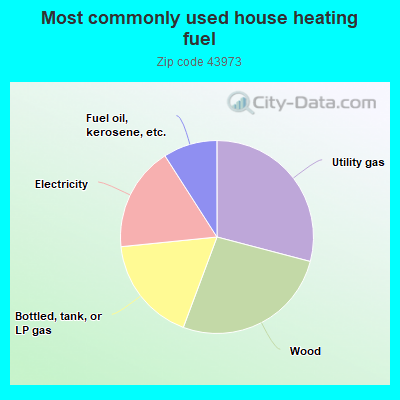
29.2%Utility gas
26.7%Wood
17.8%Bottled, tank, or LP gas
17.6%Electricity
9.1%Fuel oil, kerosene, etc.
Population in 1990: 1,905. Population change in the 1990s: +63 (+3.3%).
Place of birth for U.S.-born residents:
This state: 1,843
Northeast: 278
Midwest: 31
South: 195
West: 47
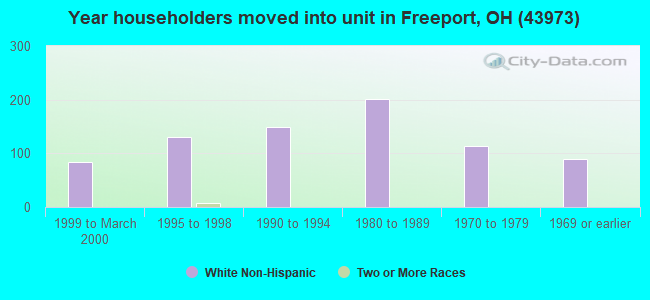
74% of the 43973 zip code residents lived in the same house 5 years ago. Out of people who lived in different houses, 38% lived in this county. Out of people who lived in different counties, 50% lived in Ohio.
95% of the 43973 zip code residents lived in the same house 1 year ago. Out of people who lived in different houses, 21% moved from this county. Out of people who lived in different houses, 60% moved from different county within same state. Out of people who lived in different houses, 29% moved from different state.
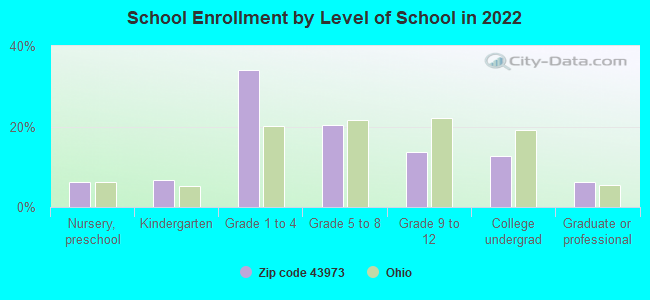
Private vs. public school enrollment:
Students in private schools in grades 1 to 8 (elementary and middle school): 100
Here:
35.7%
Ohio:
16.0%
Students in private schools in grades 9 to 12 (high school): 22
Here:
32.1%
Ohio:
13.1%
Students in private undergraduate colleges: 11
Here:
18.4%
Ohio:
22.3%
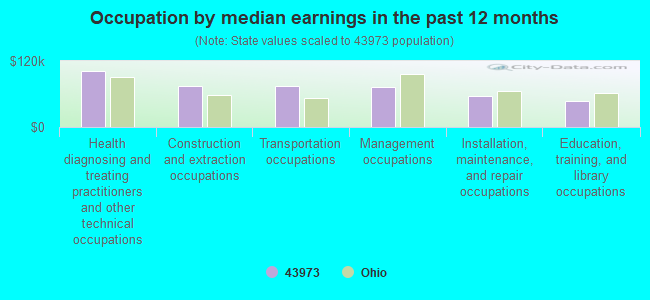
Occupation by median earnings in the past 12 months ($)
100,983Health diagnosing and treating practitioners and other technical occupations
74,462Construction and extraction occupations
73,660Transportation occupations
72,390Management occupations
56,404Installation, maintenance, and repair occupations
47,935Education, training, and library occupations
Top industries in this zip code by the number of employees in 2005:
Health Care and Social Assistance: Child Day Care Services (10-19 employees: 1 establishment)
Health Care and Social Assistance: All Other Outpatient Care Centers (10-19: 1)
Arts, Entertainment, and Recreation: Marinas (5-9: 1, 1-4: 1)
Construction: New Single-Family Housing Construction (except Operative Builders) (1-4: 4)
Accommodation and Food Services: Full-Service Restaurants (5-9: 1)
Arts, Entertainment, and Recreation: Fitness and Recreational Sports Centers (5-9: 1)
Fatal accident statistics in 2014:
Fatal accident count: 1
Vehicles involved in fatal accidents: 1
Fatal accidents caused by drunken drivers: 1
Fatalities: 1
Persons involved in fatal accidents: 1
Pedestrians involved in fatal accidents: 0
2002 - 2018 National Fire Incident Reporting System (NFIRS) incidents
According to the data from the years 2002 - 2018 the average number of fire incidents per year is 21. The highest number of reported fires - 32 took place in 2015, and the least - 5 in 2016. The data has a declining trend.
When looking into fire subcategories, the most incidents belonged to: Structure Fires (56.1%), and Outside Fires (30.8%).
Fire incident types reported to NFIRS in Zip Code 43973


 Nearest zip codes: 44699, 43983, 43736, 44693, 43985, 44683.


 According to the data from the years 2002 - 2018 the average number of fire incidents per year is 21. The highest number of reported fires - 32 took place in 2015, and the least - 5 in 2016. The data has a declining trend.
 When looking into fire subcategories, the most incidents belonged to: Structure Fires (56.1%), and Outside Fires (30.8%).