Estimated zip code population in 2022: 1,489 Zip code population in 2010: 1,083 Zip code population in 2000: 1,079
Houses and condos: 664 Renter-occupied apartments: 110
% of renters here:
20%
State:
33%
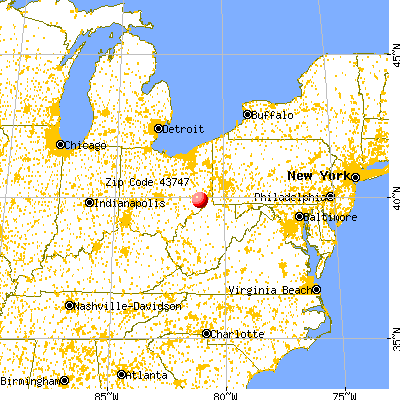
March 2022 cost of living index in zip code 43747: 83.1 (low, U.S. average is 100)
Land area: 31.6 sq. mi. Water area: 0.1 sq. mi.
Population density: 47 people per square mile
(very low).
OSM Map
General Map
Google Map
MSN Map
OSM Map
General Map
Google Map
MSN Map
OSM Map
General Map
Google Map
MSN Map
OSM Map
General Map
Google Map
MSN Map
Please wait while loading the map...
Real estate property taxes paid for housing units in 2022:
This zip code:
0.7% ($1,061)
Ohio:
1.3% ($2,639)
Median real estate property taxes paid for housing units with mortgages in 2022: $1,695 (0.7%) Median real estate property taxes paid for housing units with no mortgage in 2022: $978 (0.7%)
Business Search- 14 Million verified businesses
Males: 692
(46.5%)
Females: 797
(53.5%)
For population 25 years and over in 43747:
High school or higher: 80.1%
Bachelor's degree or higher: 18.3%
Graduate or professional degree: 10.9%
Unemployed: 9.2%
Mean travel time to work (commute): 34.8 minutes
For population 15 years and over in 43747:
Never married: 25.2%
Now married: 59.9%
Separated: 1.5%
Widowed: 9.5%
Divorced: 3.9%
Zip code 43747 compared to state average:
Unemployed percentage above state average.
Black race population percentage significantly below state average.
Hispanic race population percentage significantly below state average.
Foreign-born population percentage significantly below state average.
Renting percentage below state average.
Length of stay since moving in significantly above state average.
Percentage of population with a bachelor's degree or higher below state average.
Estimated median house/condo value in 2022: $151,878
43747:
$151,878
Ohio:
$204,100
According to our research of Ohio and other state lists, there were 2 registered sex offenders living in 43747 zip code as of July 03, 2024. The ratio of all residents to sex offenders in zip code 43747 is 465 to 1. The ratio of registered sex offenders to all residents in this zip code is near the state average.
Median resident age:
This zip code:
37.7 years
Ohio median age:
39.9 years
Average household size:
This zip code:
2.7 people
Ohio:
2.4 people
Averages for the 2020 tax year for zip code 43747, filed in 2021:
Average Adjusted Gross Income (AGI) in 2020: $49,833 (Individual Income Tax Returns)
Here:
$49,833
State:
$67,288
Salary/wage: $44,409 (reported on 71.1% of returns)
Here:
$44,409
State:
$55,628
(% of AGI for various income ranges: 1120.0% for AGIs below $25k, 3366.2% for AGIs $25k-50k, 5446.7% for AGIs $50k-75k, 7590.0% for AGIs $75k-100k, 15803.3% for AGIs $100k-200k)
Taxable interest for individuals: $650 (reported on 35.6% of returns)
This zip code:
$650
Ohio:
$1,518
(% of AGI for various income ranges: 21.8% for AGIs below $25k, 56.2% for AGIs $25k-50k, 16.7% for AGIs $50k-75k, 83.3% for AGIs $100k-200k)
Ordinary dividends: $900 (reported on 11.1% of returns)
Here:
$900
State:
$7,167
(% of AGI for various income ranges: 13.6% for AGIs below $25k, 100.0% for AGIs $75k-100k)
Net capital gain/loss in AGI: +$3,940 (reported on 11.1% of returns)
Here:
+$3,940
State:
+$18,919
(% of AGI for various income ranges: 39.1% for AGIs below $25k, 256.7% for AGIs $50k-75k)
Profit/loss from business: +$1,783 (reported on 13.3% of returns)
Here:
+$1,783
State:
+$13,744
(% of AGI for various income ranges: 116.4% for AGIs below $25k)
Taxable individual retirement arrangement distribution: $5,033 (reported on 6.7% of returns)
43747:
$5,033
Ohio:
$18,876
(% of AGI for various income ranges: 188.8% for AGIs $25k-50k)
Earned income credit: $2,212 (reported on 17.8% of returns)
Here:
$2,212
State:
$2,304
(% of AGI for various income ranges: 110.0% for AGIs below $25k, 70.0% for AGIs $25k-50k)
Percentage of individuals using paid preparers for their 2020 taxes: 93.3%
Here:
93%
State:
94%
(% for various income ranges: 93.8% for AGIs below $25k, 91.7% for AGIs $25k-50k, 100.0% for AGIs $50k-75k, 100.0% for AGIs $75k-100k, 83.3% for AGIs $100k-200k)
Averages for the 2012 tax year for zip code 43747, filed in 2013:
Average Adjusted Gross Income (AGI) in 2012: $87,396 (Individual Income Tax Returns)
Here:
$87,396
State:
$54,926
Salary/wage: $37,773 (reported on 80.4% of returns)
Here:
$37,773
State:
$45,869
(% of AGI for various income ranges: 61.6% for AGIs below $25k, 77.0% for AGIs $25k-50k, 91.2% for AGIs $50k-75k, 77.3% for AGIs $75k-100k, 81.3% for AGIs $100k-200k)
Taxable interest for individuals: $531 (reported on 34.8% of returns)
This zip code:
$531
Ohio:
$1,297
(% of AGI for various income ranges: 1.5% for AGIs below $25k, 0.8% for AGIs $25k-50k, 0.1% for AGIs $75k-100k)
Ordinary dividends: $850 (reported on 8.7% of returns)
Here:
$850
State:
$5,821
(% of AGI for various income ranges: 1.0% for AGIs $25k-50k)
Net capital gain/loss in AGI: +$164,700 (reported on 6.5% of returns)
Here:
+$164,700
State:
+$11,232
(% of AGI for various income ranges: 184.8% for AGIs below $25k)
Profit/loss from business: +$6,771 (reported on 15.2% of returns)
Here:
+$6,771
State:
+$12,773
(% of AGI for various income ranges: 15.7% for AGIs below $25k, 1.5% for AGIs $50k-75k)
Taxable individual retirement arrangement distribution: $5,250 (reported on 4.3% of returns)
43747:
$5,250
Ohio:
$14,511
(% of AGI for various income ranges: 3.9% for AGIs below $25k)
Total itemized deductions: $22,750 (8% of AGI, reported on 13.0% of returns)
Here:
$22,750
State:
$21,278
Here:
8.3% of AGI
State:
18.8% of AGI
(% of AGI for various income ranges: 10.8% for AGIs below $25k, 11.2% for AGIs $50k-75k, 3.0% for AGIs over 200k)
Charity contributions: $4,667 (reported on 6.5% of returns)
Here:
$4,667
State:
$3,943
(% of AGI for various income ranges: 3.5% for AGIs $100k-200k)
Taxes paid: $11,217 (reported on 13.0% of returns)
43747:
$11,217
State:
$9,568
(% of AGI for various income ranges: 5.7% for AGIs $50k-75k, 2.1% for AGIs over 200k)
Earned income credit: $1,775 (reported on 17.4% of returns)
Here:
$1,775
State:
$2,285
(% of AGI for various income ranges: 5.3% for AGIs below $25k)
Percentage of individuals using paid preparers for their 2012 taxes: 67.4%
Here:
67%
State:
51%
(% for various income ranges: 60.0% for AGIs below $25k, 66.7% for AGIs $25k-50k, 66.7% for AGIs $50k-75k, 60.0% for AGIs $75k-100k, 100.0% for AGIs $100k-200k, 100.0% for AGIs over 200k)
Averages for the 2004 tax year for zip code 43747, filed in 2005:
Average Adjusted Gross Income (AGI) in 2004: $28,893 (Individual Income Tax Returns)
Here:
$28,893
State:
$44,480
Salary/wage: $28,577 (reported on 84.3% of returns)
Here:
$28,577
State:
$39,198
(% of AGI for various income ranges: 93.6% for AGIs below $10k, 74.8% for AGIs $10k-25k, 84.3% for AGIs $25k-50k, 86.6% for AGIs $50k-75k, 85.4% for AGIs $75k-100k)
Taxable interest for individuals: $959 (reported on 42.0% of returns)
This zip code:
$959
Ohio:
$1,532
(% of AGI for various income ranges: 2.5% for AGIs below $10k, 2.0% for AGIs $10k-25k, 2.3% for AGIs $25k-50k, 0.2% for AGIs $50k-75k, 0.2% for AGIs $75k-100k)
Taxable dividends: $1,130 (reported on 11.7% of returns)
Here:
$1,130
State:
$3,496
Profit/loss from business: +$1,282 (reported on 15.4% of returns)
Here:
+$1,282
State:
+$10,813
(% of AGI for various income ranges: 2.5% for AGIs below $10k, 3.2% for AGIs $10k-25k, -0.1% for AGIs $25k-50k, 0.0% for AGIs $50k-75k)
Total itemized deductions: $12,725 (24% of AGI, reported on 11.1% of returns)
Here:
$12,725
State:
$17,503
Here:
23.8% of AGI
State:
20.8% of AGI
(% of AGI for various income ranges: 5.7% for AGIs $10k-25k, 2.7% for AGIs $25k-50k, 4.4% for AGIs $50k-75k, 9.8% for AGIs $75k-100k)
Charity contributions deductions: $656 (1% of AGI, reported on 7.0% of returns)
Here:
$656
State:
$3,087
Here:
1.2% of AGI
State:
3.4% of AGI
Total tax: $2,709 (reported on 73.3% of returns)
43747:
$2,709
State:
$6,781
(% of AGI for various income ranges: 1.8% for AGIs below $10k, 3.8% for AGIs $10k-25k, 6.2% for AGIs $25k-50k, 8.4% for AGIs $50k-75k, 10.6% for AGIs $75k-100k)
Earned income credit: $1,409 (reported on 19.1% of returns)
Here:
$1,409
State:
$1,696
Percentage of individuals using paid preparers for their 2004 taxes: 63.5%
Here:
63%
State:
55%
(% for various income ranges: 56.2% for AGIs below $10k, 55.8% for AGIs $10k-25k, 78.2% for AGIs $25k-50k, 60.8% for AGIs $50k-75k, 65.4% for AGIs $75k-100k)
Likely homosexual households (counted as self-reported same-sex unmarried-partner households)
Lesbian couples: 0.2% of all households
Gay men: 0.0% of all households
Household received Food Stamps/SNAP in the past 12 months: 67 Household did not receive Food Stamps/SNAP in the past 12 months: 492
Women who had a birth in the past 12 months: 71 (20 now married, 49 unmarried) Women who did not have a birth in the past 12 months: 192 (131 now married, 60 unmarried)
Housing units in zip code 43747 with a mortgage: 117 (7 second mortgage, 7 both second mortgage and home equity loan) Median monthly owner costs for units with a mortgage: $1,105 Median monthly owner costs for units without a mortgage: $375
Residents with income below the poverty level in 2022:
This zip code:
6.3%
Whole state:
13.4%
Residents with income below 50% of the poverty level in 2022:
This zip code:
6.0%
Whole state:
7.0%
Median number of rooms in houses and condos:
Here:
6.3
State:
6.7
Median number of rooms in apartments:
Here:
6.2
State:
4.4
Notable locations in this zip code not listed on our city pages
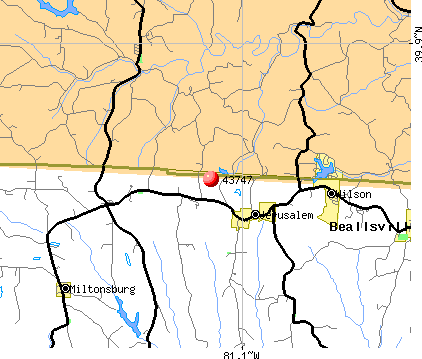
Cemeteries: Jerusalem Cemetery (1), Bush Cemetery (2), Quaker Cemetery (3), Neptune Cemetery (4), Pleasant Ridge Cemetery (5), Boston Cemetery (6). Display/hide their locations on the map
Streams, rivers, and creeks: Grassy Creek (A), Flag Run (B), Cranenest Creek (C), Baker Fork (D), Slope Creek (E), Brushy Creek (F), Millers Run (G). Display/hide their locations on the map
Size of family households: 122 2-persons, 94 3-persons, 34 4-persons, 72 5-persons, 28 6-persons
Size of nonfamily households: 194 1-person, 9 2-persons
349 married couples with children.
94 single-parent households (52 men, 42 women).
91.7% of residents of 43747 zip code speak English at home.
8.8% of residents speak other Indo-European language at home (12% very well, 59% well, 29% not well).
Foreign born population: 0 (0.0%)
:
0.0%
Whole state:
5.0%
33%German
29%English
11%Irish
7%European
7%Pennsylvania German
6%American
4%Dutch
Housing units lacking complete plumbing facilities: 5.8% Housing units lacking complete kitchen facilities: 11.4%
52.9%Utility gas
19.6%Wood
15.0%Electricity
6.8%Fuel oil, kerosene, etc.
3.5%Other fuel
2.7%Bottled, tank, or LP gas
Population in 1990: 2,037.
Place of birth for U.S.-born residents:
This state: 942
Northeast: 1
South: 517
West: 14
80% of the 43747 zip code residents lived in the same house 5 years ago. Out of people who lived in different houses, 49% lived in this county. Out of people who lived in different counties, 50% lived in Ohio.
92% of the 43747 zip code residents lived in the same house 1 year ago. Out of people who lived in different houses, 1% moved from this county. Out of people who lived in different houses, 53% moved from different county within same state. Out of people who lived in different houses, 53% moved from different state.
Private vs. public school enrollment:
Students in private schools in grades 1 to 8 (elementary and middle school): 41
Here:
24.7%
Ohio:
16.0%
Students in private schools in grades 9 to 12 (high school):
Here:
0.0%
Ohio:
13.1%
Students in private undergraduate colleges:
Here:
0.0%
Ohio:
22.3%
Occupation by median earnings in the past 12 months ($)
99,152Health diagnosing and treating practitioners and other technical occupations
76,938Production occupations
67,005Construction and extraction occupations
58,187Sales and related occupations
30,550Building and grounds cleaning and maintenance occupations
22,740Food preparation and serving related occupations
Top industries in this zip code by the number of employees in 2005:
Accommodation and Food Services: Limited-Service Restaurants (5-9 employees: 1 establishment)
Mining: Crude Petroleum and Natural Gas Extraction (1-4: 1)
Other Services (except Public Administration): Commercial and Industrial Machinery and Equipment (except Automotive and Electronic) Repair and Maintenance (1-4: 1)
Construction: New Single-Family Housing Construction (except Operative Builders) (1-4: 1)
Construction: Electrical Contractors (1-4: 1)
Construction: Plumbing, Heating, and Air-Conditioning Contractors (1-4: 1)
Other Services (except Public Administration): Religious Organizations (1-4: 1)
Home Mortgage Disclosure Act Aggregated Statistics For Year 2009 (Based on 2 partial tracts)
A) FHA, FSA/RHS & VA Home Purchase Loans
B) Conventional Home Purchase Loans
C) Refinancings
D) Home Improvement Loans
G) Loans On Manufactured Home Dwelling (A B C & D)
Number
Average Value
Number
Average Value
Number
Average Value
Number
Average Value
Number
Average Value
LOANS ORIGINATED
3
$85,933
3
$102,410
8
$99,549
4
$40,235
1
$31,610
APPLICATIONS APPROVED, NOT ACCEPTED
0
$0
1
$43,970
1
$28,450
0
$0
0
$0
APPLICATIONS DENIED
0
$0
1
$138,240
7
$80,020
4
$29,458
0
$0
APPLICATIONS WITHDRAWN
1
$43,400
1
$98,000
3
$84,880
0
$0
0
$0
FILES CLOSED FOR INCOMPLETENESS
0
$0
0
$0
1
$96,850
0
$0
0
$0
Aggregated Statistics For Year 2008 (Based on 2 partial tracts)
A) FHA, FSA/RHS & VA Home Purchase Loans
B) Conventional Home Purchase Loans
C) Refinancings
D) Home Improvement Loans
F) Non-occupant Loans on < 5 Family Dwellings (A B C & D)
G) Loans On Manufactured Home Dwelling (A B C & D)
Number
Average Value
Number
Average Value
Number
Average Value
Number
Average Value
Number
Average Value
Number
Average Value
LOANS ORIGINATED
3
$60,353
6
$84,303
11
$62,261
5
$44,088
0
$0
1
$62,370
APPLICATIONS APPROVED, NOT ACCEPTED
0
$0
0
$0
1
$75,870
0
$0
0
$0
0
$0
APPLICATIONS DENIED
1
$94,550
4
$80,975
10
$99,958
3
$29,313
1
$40,520
4
$87,945
APPLICATIONS WITHDRAWN
1
$43,970
1
$22,700
2
$131,630
1
$52,880
0
$0
1
$51,730
FILES CLOSED FOR INCOMPLETENESS
0
$0
0
$0
0
$0
0
$0
0
$0
0
$0
Aggregated Statistics For Year 2007 (Based on 2 partial tracts)
A) FHA, FSA/RHS & VA Home Purchase Loans
B) Conventional Home Purchase Loans
C) Refinancings
D) Home Improvement Loans
F) Non-occupant Loans on < 5 Family Dwellings (A B C & D)
G) Loans On Manufactured Home Dwelling (A B C & D)
Number
Average Value
Number
Average Value
Number
Average Value
Number
Average Value
Number
Average Value
Number
Average Value
LOANS ORIGINATED
3
$90,820
9
$85,134
7
$64,377
7
$26,933
2
$31,470
3
$50,293
APPLICATIONS APPROVED, NOT ACCEPTED
0
$0
1
$80,180
1
$109,210
1
$16,090
0
$0
1
$82,480
APPLICATIONS DENIED
0
$0
2
$76,590
16
$123,546
3
$23,470
0
$0
1
$111,220
APPLICATIONS WITHDRAWN
1
$33,050
1
$52,310
6
$126,120
1
$48,860
0
$0
0
$0
FILES CLOSED FOR INCOMPLETENESS
0
$0
0
$0
0
$0
0
$0
0
$0
0
$0
Aggregated Statistics For Year 2006 (Based on 2 partial tracts)
A) FHA, FSA/RHS & VA Home Purchase Loans
B) Conventional Home Purchase Loans
C) Refinancings
D) Home Improvement Loans
F) Non-occupant Loans on < 5 Family Dwellings (A B C & D)
G) Loans On Manufactured Home Dwelling (A B C & D)
Number
Average Value
Number
Average Value
Number
Average Value
Number
Average Value
Number
Average Value
Number
Average Value
LOANS ORIGINATED
3
$60,547
11
$91,550
12
$63,468
7
$31,450
2
$96,855
1
$46,850
APPLICATIONS APPROVED, NOT ACCEPTED
0
$0
1
$89,090
3
$55,373
1
$13,800
0
$0
1
$32,190
APPLICATIONS DENIED
1
$54,610
7
$67,129
14
$72,527
5
$24,658
1
$59,200
3
$56,810
APPLICATIONS WITHDRAWN
1
$48,000
1
$62,940
7
$111,799
1
$7,470
0
$0
0
$0
FILES CLOSED FOR INCOMPLETENESS
0
$0
1
$60,640
2
$162,525
0
$0
0
$0
0
$0
Aggregated Statistics For Year 2005 (Based on 2 partial tracts)
A) FHA, FSA/RHS & VA Home Purchase Loans
B) Conventional Home Purchase Loans
C) Refinancings
D) Home Improvement Loans
G) Loans On Manufactured Home Dwelling (A B C & D)
Number
Average Value
Number
Average Value
Number
Average Value
Number
Average Value
Number
Average Value
LOANS ORIGINATED
2
$91,105
8
$71,779
12
$75,586
8
$22,381
3
$49,433
APPLICATIONS APPROVED, NOT ACCEPTED
0
$0
1
$48,570
4
$102,602
0
$0
0
$0
APPLICATIONS DENIED
0
$0
4
$68,760
18
$86,907
5
$35,466
2
$51,590
APPLICATIONS WITHDRAWN
0
$0
1
$100,020
9
$115,248
1
$96,570
1
$86,790
FILES CLOSED FOR INCOMPLETENESS
0
$0
1
$46,560
2
$45,985
0
$0
0
$0
Aggregated Statistics For Year 2004 (Based on 2 partial tracts)
A) FHA, FSA/RHS & VA Home Purchase Loans
B) Conventional Home Purchase Loans
C) Refinancings
D) Home Improvement Loans
F) Non-occupant Loans on < 5 Family Dwellings (A B C & D)
G) Loans On Manufactured Home Dwelling (A B C & D)
Number
Average Value
Number
Average Value
Number
Average Value
Number
Average Value
Number
Average Value
Number
Average Value
LOANS ORIGINATED
2
$61,075
11
$77,024
16
$80,221
9
$17,308
2
$54,750
1
$31,330
APPLICATIONS APPROVED, NOT ACCEPTED
0
$0
1
$118,120
1
$102,600
1
$26,440
0
$0
0
$0
APPLICATIONS DENIED
1
$83,350
3
$67,633
11
$73,339
4
$30,608
1
$14,370
3
$58,820
APPLICATIONS WITHDRAWN
0
$0
1
$116,970
8
$85,538
1
$31,900
0
$0
1
$42,250
FILES CLOSED FOR INCOMPLETENESS
0
$0
0
$0
3
$87,850
1
$26,150
0
$0
0
$0
Aggregated Statistics For Year 2003 (Based on 2 partial tracts)
A) FHA, FSA/RHS & VA Home Purchase Loans
B) Conventional Home Purchase Loans
C) Refinancings
D) Home Improvement Loans
F) Non-occupant Loans on < 5 Family Dwellings (A B C & D)
Number
Average Value
Number
Average Value
Number
Average Value
Number
Average Value
Number
Average Value
LOANS ORIGINATED
2
$71,275
7
$52,430
35
$67,999
8
$18,574
1
$35,640
APPLICATIONS APPROVED, NOT ACCEPTED
0
$0
1
$87,080
5
$61,446
2
$27,590
0
$0
APPLICATIONS DENIED
1
$45,120
4
$67,252
15
$62,404
1
$10,350
0
$0
APPLICATIONS WITHDRAWN
0
$0
1
$71,850
7
$82,566
1
$15,810
0
$0
FILES CLOSED FOR INCOMPLETENESS
1
$60,930
1
$35,640
2
$86,365
0
$0
1
$67,540
Aggregated Statistics For Year 2002 (Based on 2 partial tracts)
A) FHA, FSA/RHS & VA Home Purchase Loans
B) Conventional Home Purchase Loans
C) Refinancings
D) Home Improvement Loans
F) Non-occupant Loans on < 5 Family Dwellings (A B C & D)
Number
Average Value
Number
Average Value
Number
Average Value
Number
Average Value
Number
Average Value
LOANS ORIGINATED
2
$49,865
10
$63,630
29
$63,763
7
$14,493
1
$16,670
APPLICATIONS APPROVED, NOT ACCEPTED
0
$0
1
$38,220
7
$64,624
1
$4,020
0
$0
APPLICATIONS DENIED
0
$0
2
$48,715
16
$58,953
3
$14,467
0
$0
APPLICATIONS WITHDRAWN
0
$0
2
$65,670
7
$76,201
0
$0
0
$0
FILES CLOSED FOR INCOMPLETENESS
0
$0
1
$39,660
3
$75,107
0
$0
0
$0
Aggregated Statistics For Year 2001 (Based on 2 partial tracts)
A) FHA, FSA/RHS & VA Home Purchase Loans
B) Conventional Home Purchase Loans
C) Refinancings
D) Home Improvement Loans
F) Non-occupant Loans on < 5 Family Dwellings (A B C & D)
Number
Average Value
Number
Average Value
Number
Average Value
Number
Average Value
Number
Average Value
LOANS ORIGINATED
2
$57,910
8
$52,846
16
$58,091
5
$17,358
1
$42,820
APPLICATIONS APPROVED, NOT ACCEPTED
0
$0
1
$34,200
6
$80,998
1
$3,450
0
$0
APPLICATIONS DENIED
1
$49,150
4
$40,092
12
$61,120
3
$8,813
0
$0
APPLICATIONS WITHDRAWN
1
$31,900
3
$63,900
13
$69,153
1
$18,970
0
$0
FILES CLOSED FOR INCOMPLETENESS
0
$0
0
$0
1
$82,480
0
$0
0
$0
Aggregated Statistics For Year 2000 (Based on 2 partial tracts)
A) FHA, FSA/RHS & VA Home Purchase Loans
B) Conventional Home Purchase Loans
C) Refinancings
D) Home Improvement Loans
F) Non-occupant Loans on < 5 Family Dwellings (A B C & D)
Number
Average Value
Number
Average Value
Number
Average Value
Number
Average Value
Number
Average Value
LOANS ORIGINATED
1
$73,290
9
$47,038
11
$48,596
6
$9,293
2
$43,685
APPLICATIONS APPROVED, NOT ACCEPTED
0
$0
2
$45,410
3
$44,833
1
$25,580
0
$0
APPLICATIONS DENIED
0
$0
9
$38,863
8
$48,714
5
$16,726
1
$19,260
APPLICATIONS WITHDRAWN
0
$0
2
$76,880
11
$49,798
0
$0
0
$0
FILES CLOSED FOR INCOMPLETENESS
0
$0
0
$0
1
$51,160
0
$0
0
$0
Aggregated Statistics For Year 1999 (Based on 1 partial tract)
B) Conventional Home Purchase Loans
C) Refinancings
D) Home Improvement Loans
F) Non-occupant Loans on < 5 Family Dwellings (A B C & D)


 Nearest zip codes: 43716, 43793, 43713, 43719, 43754, 43902.


