Estimated zip code population in 2022: 2,818 Zip code population in 2010: 2,818 Zip code population in 2000: 2,838
Houses and condos: 1,244 Renter-occupied apartments: 270
% of renters here:
23%
State:
33%
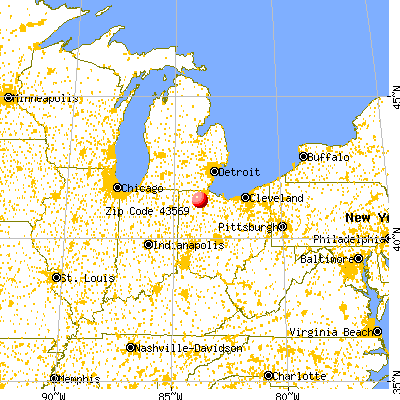
March 2022 cost of living index in zip code 43569: 82.8 (low, U.S. average is 100)
Land area: 34.7 sq. mi. Water area: 0.0 sq. mi.
Population density: 81 people per square mile
(very low).
OSM Map
General Map
Google Map
MSN Map
OSM Map
General Map
Google Map
MSN Map
OSM Map
General Map
Google Map
MSN Map
OSM Map
General Map
Google Map
MSN Map
Please wait while loading the map...
Real estate property taxes paid for housing units in 2022:
This zip code:
1.1% ($1,781)
Ohio:
1.3% ($2,639)
Median real estate property taxes paid for housing units with mortgages in 2022: $1,845 (1.1%) Median real estate property taxes paid for housing units with no mortgage in 2022: $1,483 (1.0%)
Business Search- 14 Million verified businesses
Males: 1,404
(49.8%)
Females: 1,413
(50.2%)
For population 25 years and over in 43569:
High school or higher: 97.0%
Bachelor's degree or higher: 27.8%
Graduate or professional degree: 9.2%
Unemployed: 3.6%
Mean travel time to work (commute): 25.6 minutes
For population 15 years and over in 43569:
Never married: 19.0%
Now married: 61.0%
Separated: 2.4%
Widowed: 5.0%
Divorced: 12.6%
Zip code 43569 compared to state average:
Black race population percentage significantly below state average.
Hispanic race population percentage significantly above state average.
Median age below state average.
Length of stay since moving in above state average.
Averages for the 2020 tax year for zip code 43569, filed in 2021:
Average Adjusted Gross Income (AGI) in 2020: $50,566 (Individual Income Tax Returns)
Here:
$50,566
State:
$67,288
Salary/wage: $44,301 (reported on 82.1% of returns)
Here:
$44,301
State:
$55,628
(% of AGI for various income ranges: 1080.7% for AGIs below $25k, 3466.4% for AGIs $25k-50k, 6271.7% for AGIs $50k-75k, 8572.2% for AGIs $75k-100k, 13678.2% for AGIs $100k-200k)
Taxable interest for individuals: $569 (reported on 19.4% of returns)
This zip code:
$569
Ohio:
$1,518
(% of AGI for various income ranges: 6.3% for AGIs below $25k, 5.2% for AGIs $25k-50k, 14.4% for AGIs $50k-75k, 17.8% for AGIs $75k-100k, 63.6% for AGIs $100k-200k)
Ordinary dividends: $1,541 (reported on 12.7% of returns)
Here:
$1,541
State:
$7,167
(% of AGI for various income ranges: 8.7% for AGIs below $25k, 10.9% for AGIs $25k-50k, 34.4% for AGIs $50k-75k, 35.6% for AGIs $75k-100k, 96.4% for AGIs $100k-200k)
Net capital gain/loss in AGI: +$6,171 (reported on 10.4% of returns)
Here:
+$6,171
State:
+$18,919
(% of AGI for various income ranges: 41.5% for AGIs $25k-50k, 101.1% for AGIs $50k-75k, 495.5% for AGIs $100k-200k)
Profit/loss from business: +$10,525 (reported on 11.9% of returns)
Here:
+$10,525
State:
+$13,744
(% of AGI for various income ranges: 78.0% for AGIs below $25k, 33.9% for AGIs $25k-50k, 184.4% for AGIs $50k-75k, 415.6% for AGIs $75k-100k, 574.5% for AGIs $100k-200k)
Taxable individual retirement arrangement distribution: $17,230 (reported on 7.5% of returns)
43569:
$17,230
Ohio:
$18,876
(% of AGI for various income ranges: 39.0% for AGIs below $25k, 64.8% for AGIs $25k-50k, 263.3% for AGIs $50k-75k, 1020.0% for AGIs $75k-100k)
Total itemized deductions: $25,000 (reported on 1.5% of returns)
Here:
$25,000
State:
$33,869
(% of AGI for various income ranges: 166.7% for AGIs below $25k)
Taxes paid: $6,650 (reported on 1.5% of returns)
43569:
$6,650
State:
$7,681
(% of AGI for various income ranges: 44.3% for AGIs below $25k)
Earned income credit: $2,017 (reported on 17.2% of returns)
Here:
$2,017
State:
$2,304
(% of AGI for various income ranges: 97.7% for AGIs below $25k, 51.8% for AGIs $25k-50k)
Percentage of individuals using paid preparers for their 2020 taxes: 95.5%
Here:
96%
State:
94%
(% for various income ranges: 95.1% for AGIs below $25k, 97.4% for AGIs $25k-50k, 92.0% for AGIs $50k-75k, 100.0% for AGIs $75k-100k, 94.1% for AGIs $100k-200k)
Averages for the 2012 tax year for zip code 43569, filed in 2013:
Average Adjusted Gross Income (AGI) in 2012: $44,151 (Individual Income Tax Returns)
Here:
$44,151
State:
$54,926
Salary/wage: $37,206 (reported on 86.2% of returns)
Here:
$37,206
State:
$45,869
(% of AGI for various income ranges: 71.3% for AGIs below $25k, 79.4% for AGIs $25k-50k, 77.4% for AGIs $50k-75k, 82.6% for AGIs $75k-100k, 57.1% for AGIs $100k-200k)
Taxable interest for individuals: $568 (reported on 23.8% of returns)
This zip code:
$568
Ohio:
$1,297
(% of AGI for various income ranges: 0.5% for AGIs below $25k, 0.2% for AGIs $25k-50k, 0.4% for AGIs $50k-75k, 0.2% for AGIs $75k-100k, 0.3% for AGIs $100k-200k)
Ordinary dividends: $1,150 (reported on 12.3% of returns)
Here:
$1,150
State:
$5,821
(% of AGI for various income ranges: 0.2% for AGIs below $25k, 0.2% for AGIs $25k-50k, 0.3% for AGIs $50k-75k, 0.4% for AGIs $75k-100k, 0.5% for AGIs $100k-200k)
Net capital gain/loss in AGI: +$5,725 (reported on 6.2% of returns)
Here:
+$5,725
State:
+$11,232
(% of AGI for various income ranges: 3.1% for AGIs $100k-200k)
Profit/loss from business: +$6,128 (reported on 13.8% of returns)
Here:
+$6,128
State:
+$12,773
(% of AGI for various income ranges: 5.6% for AGIs below $25k, 1.9% for AGIs $25k-50k, 2.2% for AGIs $50k-75k, 2.2% for AGIs $75k-100k)
Taxable individual retirement arrangement distribution: $10,982 (reported on 8.5% of returns)
43569:
$10,982
Ohio:
$14,511
(% of AGI for various income ranges: 2.4% for AGIs below $25k, 1.5% for AGIs $25k-50k, 2.2% for AGIs $50k-75k, 6.3% for AGIs $75k-100k)
Total itemized deductions: $17,333 (21% of AGI, reported on 23.1% of returns)
Here:
$17,333
State:
$21,278
Here:
21.5% of AGI
State:
18.8% of AGI
(% of AGI for various income ranges: 4.6% for AGIs below $25k, 6.7% for AGIs $25k-50k, 9.4% for AGIs $50k-75k, 13.0% for AGIs $75k-100k, 10.6% for AGIs $100k-200k)
Charity contributions: $2,250 (reported on 15.4% of returns)
Here:
$2,250
State:
$3,943
(% of AGI for various income ranges: 0.5% for AGIs $25k-50k, 1.0% for AGIs $50k-75k, 1.4% for AGIs $75k-100k, 0.9% for AGIs $100k-200k)
Taxes paid: $5,943 (reported on 23.1% of returns)
43569:
$5,943
State:
$9,568
(% of AGI for various income ranges: 0.5% for AGIs below $25k, 1.9% for AGIs $25k-50k, 2.6% for AGIs $50k-75k, 5.0% for AGIs $75k-100k, 4.7% for AGIs $100k-200k)
Earned income credit: $2,196 (reported on 21.5% of returns)
Here:
$2,196
State:
$2,285
(% of AGI for various income ranges: 6.8% for AGIs below $25k, 1.2% for AGIs $25k-50k)
Percentage of individuals using paid preparers for their 2012 taxes: 50.8%
Here:
51%
State:
51%
(% for various income ranges: 45.1% for AGIs below $25k, 50.0% for AGIs $25k-50k, 52.6% for AGIs $50k-75k, 60.0% for AGIs $75k-100k, 70.0% for AGIs $100k-200k)
Averages for the 2004 tax year for zip code 43569, filed in 2005:
Average Adjusted Gross Income (AGI) in 2004: $35,430 (Individual Income Tax Returns)
Here:
$35,430
State:
$44,480
Salary/wage: $33,562 (reported on 88.7% of returns)
Here:
$33,562
State:
$39,198
(% of AGI for various income ranges: 84.5% for AGIs below $10k, 75.6% for AGIs $10k-25k, 86.7% for AGIs $25k-50k, 88.8% for AGIs $50k-75k, 91.6% for AGIs $75k-100k, 61.2% for AGIs over 100k)
Taxable interest for individuals: $998 (reported on 33.1% of returns)
This zip code:
$998
Ohio:
$1,532
(% of AGI for various income ranges: 4.7% for AGIs below $10k, 1.7% for AGIs $10k-25k, 1.2% for AGIs $25k-50k, 0.5% for AGIs $50k-75k, 0.4% for AGIs $75k-100k, 0.3% for AGIs over 100k)
Taxable dividends: $679 (reported on 14.9% of returns)
Here:
$679
State:
$3,496
(% of AGI for various income ranges: 0.9% for AGIs below $10k, 0.4% for AGIs $10k-25k, 0.4% for AGIs $25k-50k, 0.1% for AGIs $50k-75k, 0.2% for AGIs $75k-100k, 0.2% for AGIs over 100k)
Net capital gain/loss: +$421 (reported on 7.8% of returns)
Here:
+$421
State:
+$8,582
(% of AGI for various income ranges: 0.2% for AGIs $10k-25k, -0.1% for AGIs $25k-50k, 0.2% for AGIs $50k-75k, -0.1% for AGIs $75k-100k, 0.4% for AGIs over 100k)
Profit/loss from business: +$7,490 (reported on 10.7% of returns)
Here:
+$7,490
State:
+$10,813
(% of AGI for various income ranges: 7.8% for AGIs below $10k, 4.2% for AGIs $10k-25k, 2.2% for AGIs $25k-50k, 2.3% for AGIs $50k-75k, 1.5% for AGIs $75k-100k)
IRA payment deduction: $1,875 (reported on 1.1% of returns)
43569:
$1,875
Ohio:
$2,794
Total itemized deductions: $13,752 (23% of AGI, reported on 28.4% of returns)
Here:
$13,752
State:
$17,503
Here:
22.7% of AGI
State:
20.8% of AGI
(% of AGI for various income ranges: 6.5% for AGIs $10k-25k, 8.1% for AGIs $25k-50k, 12.0% for AGIs $50k-75k, 14.0% for AGIs $75k-100k, 21.1% for AGIs over 100k)
Charity contributions deductions: $1,941 (3% of AGI, reported on 20.8% of returns)
Here:
$1,941
State:
$3,087
Here:
3.0% of AGI
State:
3.4% of AGI
(% of AGI for various income ranges: 0.6% for AGIs $10k-25k, 0.7% for AGIs $25k-50k, 0.9% for AGIs $50k-75k, 1.9% for AGIs $75k-100k, 2.7% for AGIs over 100k)
Total tax: $3,757 (reported on 77.4% of returns)
43569:
$3,757
State:
$6,781
(% of AGI for various income ranges: 2.3% for AGIs below $10k, 4.5% for AGIs $10k-25k, 7.1% for AGIs $25k-50k, 8.2% for AGIs $50k-75k, 9.8% for AGIs $75k-100k, 15.2% for AGIs over 100k)
Earned income credit: $1,577 (reported on 14.5% of returns)
Here:
$1,577
State:
$1,696
Percentage of individuals using paid preparers for their 2004 taxes: 50.1%
Here:
50%
State:
55%
(% for various income ranges: 45.5% for AGIs below $10k, 49.6% for AGIs $10k-25k, 53.9% for AGIs $25k-50k, 50.0% for AGIs $50k-75k, 41.6% for AGIs $75k-100k, 63.6% for AGIs over 100k)
Likely homosexual households (counted as self-reported same-sex unmarried-partner households)
Lesbian couples: 0.0% of all households
Gay men: 0.3% of all households
Household received Food Stamps/SNAP in the past 12 months: 134 Household did not receive Food Stamps/SNAP in the past 12 months: 1,024
Women who had a birth in the past 12 months: 26 (24 now married, 2 unmarried) Women who did not have a birth in the past 12 months: 600 (391 now married, 208 unmarried)
Housing units in zip code 43569 with a mortgage: 609 (69 second mortgage, 61 both second mortgage and home equity loan) Median monthly owner costs for units with a mortgage: $1,346 Median monthly owner costs for units without a mortgage: $438
Residents with income below the poverty level in 2022:
This zip code:
10.4%
Whole state:
13.4%
Residents with income below 50% of the poverty level in 2022:
This zip code:
4.0%
Whole state:
7.0%
Median number of rooms in houses and condos:
Here:
7.0
State:
6.7
Median number of rooms in apartments:
Here:
5.0
State:
4.4
Notable locations in this zip code not listed on our city pages
Notable locations in zip code 43569: Manders Dairy (A), Weston Water Treatment Plant (B), Weston Sewage Treatment Plant (C), Weston Emergency Medical Services (D), Weston Fire Department (E), Weston Public Library (F). Display/hide their locations on the map
Churches in zip code 43569 include: Antioch Church (A), Grace Evangelical Lutheran Church (B), Sonlight Christian Assembly of God Church (C), Weston Church of Christ (D), Weston United Methodist Church (E). Display/hide their locations on the map
542 married couples with children.
63 single-parent households (18 men, 45 women).
92.8% of residents of 43569 zip code speak English at home.
6.3% of residents speak Spanish at home (92% very well, 4% well, 4% not well).
0.3% of residents speak other Indo-European language at home (75% very well, 25% not well).
Foreign born population: 104 (3.7%) (68.0% of them are naturalized citizens)
This zip code:
3.7%
Whole state:
5.0%
64%France
31%Honduras
5%Zimbabwe
2%El Salvador
39%German
9%Irish
8%American
6%Italian
4%English
2%Pennsylvania German
1%Scottish
Year of entry for the foreign-born population
162010 or later
62000 to 2009
181990 to 1999
72Before 1990
Facilities with environmental interests located in this zip code:
CENTRAL OIL ASPHALT CORP (20560 LOCUST ST in WESTON, OH)
STATE MASTER (Ohio general info) - PCS-OH0116556, National Pollutant Discharge Elimination System Permit, AIR MAJOR, EPCRA National Pollutant Discharge Elimination System NON-MAJOR (Tracking pollutant discharge elimination systems) - permit Conditionally Exempt Small Quantity Generators, less than 100 kg/month of hazardous waste (Resource Conservation and Recovery Act (tracking hazardous waste)) - notification Business SIC classification: ASPHALT PAVING MIXTURES AND BLOCKS
Housing units lacking complete plumbing facilities: 2.1% Housing units lacking complete kitchen facilities: 1.0%
48.5%Utility gas
27.4%Bottled, tank, or LP gas
13.5%Electricity
7.7%Other fuel
1.9%Wood
1.3%Fuel oil, kerosene, etc.
Population in 1990: 2,560. Population change in the 1990s: +278 (+10.9%).
Place of birth for U.S.-born residents:
This state: 2,315
Northeast: 38
Midwest: 117
South: 124
West: 99
62% of the 43569 zip code residents lived in the same house 5 years ago. Out of people who lived in different houses, 62% lived in this county. Out of people who lived in different counties, 50% lived in Ohio.
92% of the 43569 zip code residents lived in the same house 1 year ago. Out of people who lived in different houses, 51% moved from this county. Out of people who lived in different houses, 36% moved from different county within same state. Out of people who lived in different houses, 8% moved from different state. Out of people who lived in different houses, 9% moved from abroad.
Private vs. public school enrollment:
Students in private schools in grades 1 to 8 (elementary and middle school): 78
Here:
19.3%
Ohio:
16.0%
Students in private schools in grades 9 to 12 (high school): 9
Here:
12.8%
Ohio:
13.1%
Students in private undergraduate colleges: 9
Here:
7.5%
Ohio:
22.3%
Occupation by median earnings in the past 12 months ($)
94,250Management occupations
87,664Architecture and engineering occupations
71,463Installation, maintenance, and repair occupations
69,602Law enforcement workers including supervisors
67,525Sales and related occupations
64,323Health diagnosing and treating practitioners and other technical occupations
Top industries in this zip code by the number of employees in 2005:
Accommodation and Food Services: Full-Service Restaurants (10-19 employees: 1 establishment)
Professional, Scientific, and Technical Services: Environmental Consulting Services (10-19: 1)
Health Care and Social Assistance: Offices of Dentists (5-9: 1, 1-4: 1)
Finance and Insurance: Commercial Banking (5-9: 1)
People in group quarters in 2010:
4 people in group homes intended for adults
Fatal accident statistics in 2014:
Fatal accident count: 1
Vehicles involved in fatal accidents: 1
Fatal accidents caused by drunken drivers: 0
Fatalities: 1
Persons involved in fatal accidents: 2
Pedestrians involved in fatal accidents: 0
Fatal accident statistics in 2013:
Fatal accident count: 1
Vehicles involved in fatal accidents: 1
Fatal accidents caused by drunken drivers: 0
Fatalities: 1
Persons involved in fatal accidents: 2
Pedestrians involved in fatal accidents: 0
Home Mortgage Disclosure Act Aggregated Statistics For Year 2009 (Based on 4 partial tracts)
A) FHA, FSA/RHS & VA Home Purchase Loans
B) Conventional Home Purchase Loans
C) Refinancings
D) Home Improvement Loans
F) Non-occupant Loans on < 5 Family Dwellings (A B C & D)
G) Loans On Manufactured Home Dwelling (A B C & D)
Number
Average Value
Number
Average Value
Number
Average Value
Number
Average Value
Number
Average Value
Number
Average Value
LOANS ORIGINATED
8
$90,148
10
$135,818
65
$115,710
3
$31,580
2
$35,945
2
$44,640
APPLICATIONS APPROVED, NOT ACCEPTED
2
$62,220
2
$41,140
9
$104,341
2
$39,165
1
$18,370
0
$0
APPLICATIONS DENIED
2
$108,565
3
$137,687
40
$106,395
5
$75,878
0
$0
4
$35,712
APPLICATIONS WITHDRAWN
2
$106,370
3
$111,300
17
$122,821
0
$0
0
$0
0
$0
FILES CLOSED FOR INCOMPLETENESS
0
$0
1
$42,340
2
$134,375
0
$0
0
$0
0
$0
Aggregated Statistics For Year 2008 (Based on 4 partial tracts)
A) FHA, FSA/RHS & VA Home Purchase Loans
B) Conventional Home Purchase Loans
C) Refinancings
D) Home Improvement Loans
F) Non-occupant Loans on < 5 Family Dwellings (A B C & D)
G) Loans On Manufactured Home Dwelling (A B C & D)
Number
Average Value
Number
Average Value
Number
Average Value
Number
Average Value
Number
Average Value
Number
Average Value
LOANS ORIGINATED
9
$88,901
13
$93,588
44
$120,256
7
$23,401
4
$113,288
4
$29,272
APPLICATIONS APPROVED, NOT ACCEPTED
0
$0
4
$47,715
5
$90,216
2
$7,100
0
$0
2
$52,720
APPLICATIONS DENIED
3
$60,813
9
$101,930
31
$110,358
5
$48,172
2
$59,110
2
$89,165
APPLICATIONS WITHDRAWN
1
$124,170
3
$66,977
13
$120,202
1
$159,760
1
$31,950
0
$0
FILES CLOSED FOR INCOMPLETENESS
0
$0
1
$35,950
2
$154,965
0
$0
0
$0
0
$0
Aggregated Statistics For Year 2007 (Based on 4 partial tracts)
A) FHA, FSA/RHS & VA Home Purchase Loans
B) Conventional Home Purchase Loans
C) Refinancings
D) Home Improvement Loans
E) Loans on Dwellings For 5+ Families
F) Non-occupant Loans on < 5 Family Dwellings (A B C & D)
G) Loans On Manufactured Home Dwelling (A B C & D)
Number
Average Value
Number
Average Value
Number
Average Value
Number
Average Value
Number
Average Value
Number
Average Value
Number
Average Value
LOANS ORIGINATED
3
$110,440
51
$107,652
57
$98,527
17
$36,876
1
$139,790
6
$93,557
8
$45,688
APPLICATIONS APPROVED, NOT ACCEPTED
0
$0
13
$58,428
9
$117,371
2
$19,535
0
$0
0
$0
8
$38,941
APPLICATIONS DENIED
1
$107,750
18
$70,262
50
$119,616
14
$24,292
0
$0
4
$161,958
9
$38,257
APPLICATIONS WITHDRAWN
1
$103,100
3
$135,793
19
$125,548
2
$132,200
0
$0
1
$83,870
1
$125,710
FILES CLOSED FOR INCOMPLETENESS
0
$0
0
$0
3
$106,183
0
$0
0
$0
0
$0
0
$0
Aggregated Statistics For Year 2006 (Based on 4 partial tracts)
A) FHA, FSA/RHS & VA Home Purchase Loans
B) Conventional Home Purchase Loans
C) Refinancings
D) Home Improvement Loans
F) Non-occupant Loans on < 5 Family Dwellings (A B C & D)
G) Loans On Manufactured Home Dwelling (A B C & D)
Number
Average Value
Number
Average Value
Number
Average Value
Number
Average Value
Number
Average Value
Number
Average Value
LOANS ORIGINATED
2
$98,935
64
$88,775
65
$94,306
18
$28,878
8
$62,665
11
$31,637
APPLICATIONS APPROVED, NOT ACCEPTED
0
$0
7
$105,786
18
$95,689
2
$46,660
1
$64,590
4
$55,118
APPLICATIONS DENIED
0
$0
16
$67,790
59
$100,592
21
$36,345
2
$71,715
10
$33,707
APPLICATIONS WITHDRAWN
0
$0
5
$59,518
36
$82,535
4
$38,802
1
$43,930
0
$0
FILES CLOSED FOR INCOMPLETENESS
0
$0
3
$113,037
10
$118,484
0
$0
0
$0
0
$0
Aggregated Statistics For Year 2005 (Based on 4 partial tracts)
A) FHA, FSA/RHS & VA Home Purchase Loans
B) Conventional Home Purchase Loans
C) Refinancings
D) Home Improvement Loans
F) Non-occupant Loans on < 5 Family Dwellings (A B C & D)
G) Loans On Manufactured Home Dwelling (A B C & D)
Number
Average Value
Number
Average Value
Number
Average Value
Number
Average Value
Number
Average Value
Number
Average Value
LOANS ORIGINATED
4
$122,102
61
$87,737
83
$105,589
23
$30,694
3
$40,433
17
$51,774
APPLICATIONS APPROVED, NOT ACCEPTED
0
$0
12
$76,513
25
$88,103
2
$27,870
0
$0
8
$35,049
APPLICATIONS DENIED
1
$69,500
39
$52,864
96
$101,208
18
$28,207
4
$78,408
28
$26,953
APPLICATIONS WITHDRAWN
2
$47,130
7
$94,497
32
$119,368
6
$89,223
0
$0
2
$63,995
FILES CLOSED FOR INCOMPLETENESS
0
$0
1
$98,250
9
$129,809
1
$145,980
0
$0
0
$0
Aggregated Statistics For Year 2004 (Based on 4 partial tracts)
A) FHA, FSA/RHS & VA Home Purchase Loans
B) Conventional Home Purchase Loans
C) Refinancings
D) Home Improvement Loans
F) Non-occupant Loans on < 5 Family Dwellings (A B C & D)
G) Loans On Manufactured Home Dwelling (A B C & D)
Number
Average Value
Number
Average Value
Number
Average Value
Number
Average Value
Number
Average Value
Number
Average Value
LOANS ORIGINATED
3
$122,393
62
$81,846
106
$105,574
19
$37,192
9
$73,627
16
$38,461
APPLICATIONS APPROVED, NOT ACCEPTED
2
$91,465
11
$59,347
27
$99,877
3
$64,670
2
$41,140
7
$42,131
APPLICATIONS DENIED
2
$125,010
22
$47,399
93
$102,135
16
$33,849
2
$21,570
16
$41,540
APPLICATIONS WITHDRAWN
0
$0
10
$81,769
47
$97,763
2
$52,725
3
$84,940
2
$53,750
FILES CLOSED FOR INCOMPLETENESS
0
$0
1
$70,290
12
$98,522
0
$0
1
$70,290
0
$0
Aggregated Statistics For Year 2003 (Based on 4 partial tracts)
A) FHA, FSA/RHS & VA Home Purchase Loans
B) Conventional Home Purchase Loans
C) Refinancings
D) Home Improvement Loans
F) Non-occupant Loans on < 5 Family Dwellings (A B C & D)
Number
Average Value
Number
Average Value
Number
Average Value
Number
Average Value
Number
Average Value
LOANS ORIGINATED
5
$108,956
67
$80,958
162
$97,336
15
$21,253
9
$55,486
APPLICATIONS APPROVED, NOT ACCEPTED
1
$71,890
7
$81,063
23
$85,616
6
$47,167
1
$65,500
APPLICATIONS DENIED
3
$104,517
58
$44,229
81
$93,502
10
$17,386
0
$0
APPLICATIONS WITHDRAWN
0
$0
4
$60,010
43
$108,714
2
$11,980
1
$123,580
FILES CLOSED FOR INCOMPLETENESS
0
$0
2
$49,925
10
$104,412
0
$0
0
$0
Aggregated Statistics For Year 2002 (Based on 4 partial tracts)
A) FHA, FSA/RHS & VA Home Purchase Loans
B) Conventional Home Purchase Loans
C) Refinancings
D) Home Improvement Loans
E) Loans on Dwellings For 5+ Families
F) Non-occupant Loans on < 5 Family Dwellings (A B C & D)
Number
Average Value
Number
Average Value
Number
Average Value
Number
Average Value
Number
Average Value
Number
Average Value
LOANS ORIGINATED
6
$106,463
49
$86,619
142
$96,704
10
$31,311
1
$141,390
9
$66,143
APPLICATIONS APPROVED, NOT ACCEPTED
0
$0
10
$67,638
32
$90,087
7
$21,307
0
$0
2
$23,780
APPLICATIONS DENIED
0
$0
53
$41,304
79
$91,172
8
$17,196
0
$0
3
$46,357
APPLICATIONS WITHDRAWN
0
$0
8
$89,242
48
$104,142
2
$24,530
0
$0
0
$0
FILES CLOSED FOR INCOMPLETENESS
0
$0
2
$82,935
18
$83,308
0
$0
0
$0
0
$0
Aggregated Statistics For Year 2001 (Based on 4 partial tracts)
A) FHA, FSA/RHS & VA Home Purchase Loans
B) Conventional Home Purchase Loans
C) Refinancings
D) Home Improvement Loans
F) Non-occupant Loans on < 5 Family Dwellings (A B C & D)
Number
Average Value
Number
Average Value
Number
Average Value
Number
Average Value
Number
Average Value
LOANS ORIGINATED
6
$103,308
61
$76,140
149
$90,942
11
$18,764
7
$75,573
APPLICATIONS APPROVED, NOT ACCEPTED
0
$0
47
$37,842
31
$73,126
2
$22,225
2
$24,765
APPLICATIONS DENIED
0
$0
135
$36,618
84
$76,481
17
$15,199
6
$36,345
APPLICATIONS WITHDRAWN
2
$64,705
7
$357,254
34
$144,518
3
$28,020
0
$0
FILES CLOSED FOR INCOMPLETENESS
0
$0
0
$0
12
$77,019
0
$0
0
$0
Aggregated Statistics For Year 2000 (Based on 4 partial tracts)
A) FHA, FSA/RHS & VA Home Purchase Loans
B) Conventional Home Purchase Loans
C) Refinancings
D) Home Improvement Loans
F) Non-occupant Loans on < 5 Family Dwellings (A B C & D)
Number
Average Value
Number
Average Value
Number
Average Value
Number
Average Value
Number
Average Value
LOANS ORIGINATED
3
$60,493
64
$70,218
51
$84,833
29
$19,822
7
$38,951
APPLICATIONS APPROVED, NOT ACCEPTED
0
$0
20
$29,349
25
$48,174
9
$14,846
0
$0
APPLICATIONS DENIED
0
$0
56
$35,488
43
$72,172
10
$32,319
1
$52,460
APPLICATIONS WITHDRAWN
0
$0
6
$55,192
21
$62,769
2
$9,985
0
$0
FILES CLOSED FOR INCOMPLETENESS
0
$0
0
$0
8
$67,174
0
$0
0
$0
Aggregated Statistics For Year 1999 (Based on 2 partial tracts)
A) FHA, FSA/RHS & VA Home Purchase Loans
B) Conventional Home Purchase Loans
C) Refinancings
D) Home Improvement Loans
F) Non-occupant Loans on < 5 Family Dwellings (A B C & D)
Detailed PMIC statistics for the following Tracts:0214.00
, 0215.00
2002 - 2018 National Fire Incident Reporting System (NFIRS) incidents
According to the data from the years 2002 - 2018 the average number of fires per year is 15. The highest number of reported fire incidents - 28 took place in 2009, and the least - 4 in 2004. The data has a dropping trend.
When looking into fire subcategories, the most reports belonged to: Structure Fires (52.0%), and Outside Fires (39.1%).
Fire incident types reported to NFIRS in Zip Code 43569


 Nearest zip codes: 43541, 43522, 43565, 43511, 43462, 43534.


 According to the data from the years 2002 - 2018 the average number of fires per year is 15. The highest number of reported fire incidents - 28 took place in 2009, and the least - 4 in 2004. The data has a dropping trend.
 When looking into fire subcategories, the most reports belonged to: Structure Fires (52.0%), and Outside Fires (39.1%).