Estimated zip code population in 2022: 3,555 Zip code population in 2010: 3,744 Zip code population in 2000: 3,759
Houses and condos: 1,658 Renter-occupied apartments: 295
% of renters here:
20%
State:
33%
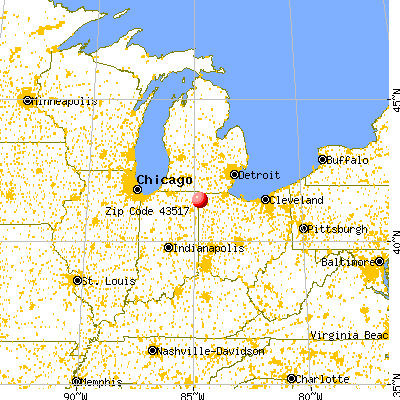
March 2022 cost of living index in zip code 43517: 82.6 (low, U.S. average is 100)
Land area: 64.8 sq. mi. Water area: 0.3 sq. mi.
Population density: 55 people per square mile
(very low).
OSM Map
General Map
Google Map
MSN Map
OSM Map
General Map
Google Map
MSN Map
OSM Map
General Map
Google Map
MSN Map
OSM Map
General Map
Google Map
MSN Map
Please wait while loading the map...
Real estate property taxes paid for housing units in 2022:
This zip code:
1.1% ($1,438)
Ohio:
1.3% ($2,639)
Median real estate property taxes paid for housing units with mortgages in 2022: $1,602 (1.1%) Median real estate property taxes paid for housing units with no mortgage in 2022: $1,175 (1.1%)
Estimated median house/condo value in 2022: $135,733
43517:
$135,733
Ohio:
$204,100
According to our research of Ohio and other state lists, there were 5 registered sex offenders living in 43517 zip code as of June 08, 2024. The ratio of all residents to sex offenders in zip code 43517 is 825 to 1. The ratio of registered sex offenders to all residents in this zip code is lower than the state average.
Median resident age:
This zip code:
41.7 years
Ohio median age:
39.9 years
Average household size:
This zip code:
2.3 people
Ohio:
2.4 people
Averages for the 2020 tax year for zip code 43517, filed in 2021:
Average Adjusted Gross Income (AGI) in 2020: $56,699 (Individual Income Tax Returns)
Here:
$56,699
State:
$67,288
Salary/wage: $47,931 (reported on 84.4% of returns)
Here:
$47,931
State:
$55,628
(% of AGI for various income ranges: 1111.1% for AGIs below $25k, 3505.4% for AGIs $25k-50k, 6230.4% for AGIs $50k-75k, 8935.0% for AGIs $75k-100k, 14816.2% for AGIs $100k-200k)
Taxable interest for individuals: $650 (reported on 27.9% of returns)
This zip code:
$650
Ohio:
$1,518
(% of AGI for various income ranges: 15.6% for AGIs below $25k, 10.4% for AGIs $25k-50k, 29.1% for AGIs $50k-75k, 37.1% for AGIs $75k-100k, 33.8% for AGIs $100k-200k)
Ordinary dividends: $2,834 (reported on 17.9% of returns)
Here:
$2,834
State:
$7,167
(% of AGI for various income ranges: 20.8% for AGIs below $25k, 16.3% for AGIs $25k-50k, 42.6% for AGIs $50k-75k, 188.6% for AGIs $75k-100k, 93.1% for AGIs $100k-200k)
Net capital gain/loss in AGI: +$9,630 (reported on 15.1% of returns)
Here:
+$9,630
State:
+$18,919
(% of AGI for various income ranges: 11.9% for AGIs below $25k, 19.1% for AGIs $25k-50k, 31.7% for AGIs $50k-75k, 361.4% for AGIs $75k-100k, 572.3% for AGIs $100k-200k)
Profit/loss from business: +$7,629 (reported on 11.7% of returns)
Here:
+$7,629
State:
+$13,744
(% of AGI for various income ranges: 56.7% for AGIs below $25k, 51.7% for AGIs $25k-50k, 150.0% for AGIs $50k-75k, 82.1% for AGIs $75k-100k, 538.5% for AGIs $100k-200k)
Taxable individual retirement arrangement distribution: $10,784 (reported on 10.6% of returns)
43517:
$10,784
Ohio:
$18,876
(% of AGI for various income ranges: 80.8% for AGIs below $25k, 117.6% for AGIs $25k-50k, 130.0% for AGIs $50k-75k, 232.1% for AGIs $75k-100k, 456.2% for AGIs $100k-200k)
Total itemized deductions: $30,620 (reported on 2.8% of returns)
Here:
$30,620
State:
$33,869
(% of AGI for various income ranges: 304.3% for AGIs $50k-75k, 639.2% for AGIs $100k-200k)
Charity contributions: $9,575 (reported on 2.2% of returns)
Here:
$9,575
State:
$14,577
(% of AGI for various income ranges: 294.6% for AGIs $100k-200k)
Taxes paid: $7,040 (reported on 2.8% of returns)
43517:
$7,040
State:
$7,681
(% of AGI for various income ranges: 60.9% for AGIs $50k-75k, 163.1% for AGIs $100k-200k)
Earned income credit: $2,313 (reported on 12.8% of returns)
Here:
$2,313
State:
$2,304
(% of AGI for various income ranges: 71.7% for AGIs below $25k, 59.6% for AGIs $25k-50k)
Percentage of individuals using paid preparers for their 2020 taxes: 93.3%
Here:
93%
State:
94%
(% for various income ranges: 92.0% for AGIs below $25k, 96.5% for AGIs $25k-50k, 93.1% for AGIs $50k-75k, 94.7% for AGIs $75k-100k, 90.0% for AGIs $100k-200k, 75.0% for AGIs over 200k)
Averages for the 2012 tax year for zip code 43517, filed in 2013:
Average Adjusted Gross Income (AGI) in 2012: $43,849 (Individual Income Tax Returns)
Here:
$43,849
State:
$54,926
Salary/wage: $37,156 (reported on 85.6% of returns)
Here:
$37,156
State:
$45,869
(% of AGI for various income ranges: 75.4% for AGIs below $25k, 79.2% for AGIs $25k-50k, 80.5% for AGIs $50k-75k, 82.9% for AGIs $75k-100k, 84.7% for AGIs $100k-200k)
Taxable interest for individuals: $698 (reported on 32.2% of returns)
This zip code:
$698
Ohio:
$1,297
(% of AGI for various income ranges: 1.1% for AGIs below $25k, 0.5% for AGIs $25k-50k, 0.6% for AGIs $50k-75k, 0.3% for AGIs $75k-100k, 0.3% for AGIs $100k-200k, 0.3% for AGIs over 200k)
Ordinary dividends: $1,781 (reported on 17.8% of returns)
Here:
$1,781
State:
$5,821
(% of AGI for various income ranges: 1.1% for AGIs below $25k, 0.7% for AGIs $25k-50k, 0.4% for AGIs $50k-75k, 0.3% for AGIs $75k-100k, 1.9% for AGIs $100k-200k)
Net capital gain/loss in AGI: +$13,780 (reported on 11.5% of returns)
Here:
+$13,780
State:
+$11,232
(% of AGI for various income ranges: 0.1% for AGIs below $25k, 0.5% for AGIs $50k-75k, 0.3% for AGIs $75k-100k, 24.9% for AGIs $100k-200k)
Profit/loss from business: +$7,722 (reported on 13.2% of returns)
Here:
+$7,722
State:
+$12,773
(% of AGI for various income ranges: 3.6% for AGIs below $25k, 3.6% for AGIs $25k-50k, 2.4% for AGIs $50k-75k, 0.7% for AGIs $75k-100k, 2.4% for AGIs $100k-200k)
Taxable individual retirement arrangement distribution: $9,716 (reported on 10.9% of returns)
43517:
$9,716
Ohio:
$14,511
(% of AGI for various income ranges: 3.7% for AGIs below $25k, 2.9% for AGIs $25k-50k, 2.0% for AGIs $50k-75k, 4.9% for AGIs $75k-100k)
Total itemized deductions: $15,546 (20% of AGI, reported on 21.3% of returns)
Here:
$15,546
State:
$21,278
Here:
19.7% of AGI
State:
18.8% of AGI
(% of AGI for various income ranges: 5.9% for AGIs below $25k, 5.5% for AGIs $25k-50k, 6.6% for AGIs $50k-75k, 9.1% for AGIs $75k-100k, 17.7% for AGIs $100k-200k)
Charity contributions: $3,704 (reported on 16.1% of returns)
Here:
$3,704
State:
$3,943
(% of AGI for various income ranges: 0.5% for AGIs below $25k, 0.9% for AGIs $25k-50k, 1.0% for AGIs $50k-75k, 1.8% for AGIs $75k-100k, 3.9% for AGIs $100k-200k)
Taxes paid: $5,703 (reported on 21.3% of returns)
43517:
$5,703
State:
$9,568
(% of AGI for various income ranges: 0.9% for AGIs below $25k, 1.4% for AGIs $25k-50k, 2.4% for AGIs $50k-75k, 3.5% for AGIs $75k-100k, 8.6% for AGIs $100k-200k)
Earned income credit: $2,055 (reported on 16.7% of returns)
Here:
$2,055
State:
$2,285
(% of AGI for various income ranges: 4.7% for AGIs below $25k, 1.0% for AGIs $25k-50k)
Percentage of individuals using paid preparers for their 2012 taxes: 65.5%
Here:
66%
State:
51%
(% for various income ranges: 56.9% for AGIs below $25k, 68.4% for AGIs $25k-50k, 69.2% for AGIs $50k-75k, 73.3% for AGIs $75k-100k, 77.8% for AGIs $100k-200k, 100.0% for AGIs over 200k)
Averages for the 2004 tax year for zip code 43517, filed in 2005:
Average Adjusted Gross Income (AGI) in 2004: $37,497 (Individual Income Tax Returns)
Here:
$37,497
State:
$44,480
Salary/wage: $34,419 (reported on 87.7% of returns)
Here:
$34,419
State:
$39,198
(% of AGI for various income ranges: 139.5% for AGIs below $10k, 81.3% for AGIs $10k-25k, 85.6% for AGIs $25k-50k, 88.2% for AGIs $50k-75k, 86.4% for AGIs $75k-100k, 42.5% for AGIs over 100k)
Taxable interest for individuals: $1,748 (reported on 40.9% of returns)
This zip code:
$1,748
Ohio:
$1,532
(% of AGI for various income ranges: 11.3% for AGIs below $10k, 3.1% for AGIs $10k-25k, 1.3% for AGIs $25k-50k, 1.1% for AGIs $50k-75k, 1.2% for AGIs $75k-100k, 3.6% for AGIs over 100k)
Taxable dividends: $1,814 (reported on 20.0% of returns)
Here:
$1,814
State:
$3,496
(% of AGI for various income ranges: 3.5% for AGIs below $10k, 0.5% for AGIs $10k-25k, 0.7% for AGIs $25k-50k, 0.4% for AGIs $50k-75k, 0.3% for AGIs $75k-100k, 3.4% for AGIs over 100k)
Net capital gain/loss: +$5,960 (reported on 14.1% of returns)
Here:
+$5,960
State:
+$8,582
(% of AGI for various income ranges: -0.7% for AGIs below $10k, 0.6% for AGIs $10k-25k, 0.7% for AGIs $25k-50k, 1.8% for AGIs $50k-75k, 0.1% for AGIs $75k-100k, 10.4% for AGIs over 100k)
Profit/loss from business: +$6,685 (reported on 14.5% of returns)
Here:
+$6,685
State:
+$10,813
(% of AGI for various income ranges: 3.9% for AGIs below $10k, 3.5% for AGIs $10k-25k, 2.2% for AGIs $25k-50k, 2.0% for AGIs $50k-75k, 3.7% for AGIs $75k-100k, 2.3% for AGIs over 100k)
IRA payment deduction: $2,282 (reported on 2.2% of returns)
43517:
$2,282
Ohio:
$2,794
Total itemized deductions: $14,126 (22% of AGI, reported on 26.0% of returns)
Here:
$14,126
State:
$17,503
Here:
22.1% of AGI
State:
20.8% of AGI
(% of AGI for various income ranges: 24.2% for AGIs below $10k, 7.4% for AGIs $10k-25k, 8.0% for AGIs $25k-50k, 9.6% for AGIs $50k-75k, 12.6% for AGIs $75k-100k, 11.3% for AGIs over 100k)
Charity contributions deductions: $2,711 (4% of AGI, reported on 19.8% of returns)
Here:
$2,711
State:
$3,087
Here:
3.9% of AGI
State:
3.4% of AGI
(% of AGI for various income ranges: 0.9% for AGIs $10k-25k, 1.0% for AGIs $25k-50k, 1.5% for AGIs $50k-75k, 1.7% for AGIs $75k-100k, 2.4% for AGIs over 100k)
Total tax: $4,504 (reported on 76.8% of returns)
43517:
$4,504
State:
$6,781
(% of AGI for various income ranges: 3.0% for AGIs below $10k, 4.2% for AGIs $10k-25k, 7.0% for AGIs $25k-50k, 8.5% for AGIs $50k-75k, 10.2% for AGIs $75k-100k, 19.2% for AGIs over 100k)
Earned income credit: $1,745 (reported on 11.2% of returns)
Here:
$1,745
State:
$1,696
Percentage of individuals using paid preparers for their 2004 taxes: 66.9%
Here:
67%
State:
55%
(% for various income ranges: 53.3% for AGIs below $10k, 65.7% for AGIs $10k-25k, 70.5% for AGIs $25k-50k, 69.9% for AGIs $50k-75k, 74.2% for AGIs $75k-100k, 84.3% for AGIs over 100k)
Household received Food Stamps/SNAP in the past 12 months: 179 Household did not receive Food Stamps/SNAP in the past 12 months: 1,305
Women who had a birth in the past 12 months: 48 (41 now married, 7 unmarried) Women who did not have a birth in the past 12 months: 691 (305 now married, 386 unmarried)
Housing units in zip code 43517 with a mortgage: 736 (26 second mortgage, 17 both second mortgage and home equity loan) Houses without a mortgage: 51
Median monthly owner costs for units with a mortgage: $1,063 Median monthly owner costs for units without a mortgage: $412
Residents with income below the poverty level in 2022:
This zip code:
9.3%
Whole state:
13.4%
Residents with income below 50% of the poverty level in 2022:
This zip code:
3.9%
Whole state:
7.0%
Median number of rooms in houses and condos:
Here:
6.8
State:
6.7
Median number of rooms in apartments:
Here:
5.5
State:
4.4
Notable locations in this zip code not listed on our city pages
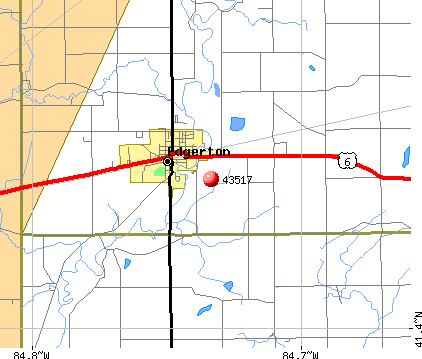
Notable locations in zip code 43517: Goebel Farms (A), Appel Farm (B), Radabaugh Farms (C), Williams County Emergency Medical Services Medic 1 (D), Edgerton Town Hall (E), Edgerton Fire Department (F). Display/hide their locations on the map
Churches in zip code 43517 include: Grace Lutheran Church (A), Church of Christ (B), Emanuel Church (C), Salem Church (D), Zion Lutheran Church (E), Edgerton Emanuel United Methodist Church (F), Saint Marys Catholic Church (G). Display/hide their locations on the map
Cemeteries: Tamarack Cemetery (1), Clarksville Cemetery (2), Thomas Cemetery (3), Farmer Cemetery (4), Farnham Cemetery (5), West Buffalo Cemetery (6), Maple Grove Cemetery (7). Display/hide their locations on the map
In group quarters: 79 (-1 institutionalized population)
Size of family households: 447 2-persons, 203 3-persons, 156 4-persons, 125 5-persons, 12 6-persons
Size of nonfamily households: 461 1-person, 75 2-persons
341 married couples with children.
268 single-parent households (126 men, 142 women).
98.1% of residents of 43517 zip code speak English at home.
0.1% of residents speak Spanish at home (100% very well).
0.7% of residents speak other Indo-European language at home (82% very well, 18% not well).
0.7% of residents speak Asian or Pacific Island language at home (100% very well).
Foreign born population: 20 (0.6%) (20.3% of them are naturalized citizens)
This zip code:
0.6%
Whole state:
5.0%
40%Singapore
25%Marshall Islands
20%Japan
42%German
14%American
10%English
5%French
3%Irish
2%European
1%Hungarian
Year of entry for the foreign-born population
232010 or later
02000 to 2009
71990 to 1999
73Before 1990
Facilities with environmental interests located in this zip code:
AIR WAY MFG CO (303 W RIVER ST in EDGERTON, OH)
(Resource Conservation and Recovery Act (tracking hazardous waste)) Organizations: HAMM RONALD CEO (CONTACT/OWNER)
Housing units lacking complete plumbing facilities: 0.5% Housing units lacking complete kitchen facilities: 1.8%
47.1%Utility gas
23.6%Electricity
19.7%Bottled, tank, or LP gas
4.1%Wood
3.1%No fuel used
1.4%Fuel oil, kerosene, etc.
1.2%Other fuel
Population in 1990: 3,663. Population change in the 1990s: +96 (+2.6%).
Place of birth for U.S.-born residents:
This state: 2,442
Northeast: 71
Midwest: 713
South: 145
West: 66
61% of the 43517 zip code residents lived in the same house 5 years ago. Out of people who lived in different houses, 60% lived in this county. Out of people who lived in different counties, 50% lived in Ohio.
95% of the 43517 zip code residents lived in the same house 1 year ago. Out of people who lived in different houses, 70% moved from this county. Out of people who lived in different houses, 12% moved from different county within same state. Out of people who lived in different houses, 22% moved from different state.
Private vs. public school enrollment:
Students in private schools in grades 1 to 8 (elementary and middle school): 55
Here:
12.6%
Ohio:
16.0%
Students in private schools in grades 9 to 12 (high school):
Here:
0.0%
Ohio:
13.1%
Students in private undergraduate colleges: 17
Here:
8.3%
Ohio:
22.3%
Occupation by median earnings in the past 12 months ($)
77,889Arts, design, entertainment, sports, and media occupations
73,189Architecture and engineering occupations
53,028Construction and extraction occupations
50,979Installation, maintenance, and repair occupations
49,397Health technologists and technicians
46,849Education, training, and library occupations
Top industries in this zip code by the number of employees in 2005:
Management of Companies and Enterprises: Corporate, Subsidiary, and Regional Managing Offices (100-249 employees: 1 establishment)
Administrative and Support and Waste Management and Remediation Services: Office Administrative Services (50-99: 1)
Health Care and Social Assistance: Nursing Care Facilities (50-99: 1)
People in group quarters in 2010:
68 people in nursing facilities/skilled-nursing facilities
12 people in group homes intended for adults
People in group quarters in 2000:
70 people in nursing homes
Fatal accident statistics in 2014:
Fatal accident count: 1
Vehicles involved in fatal accidents: 1
Fatal accidents caused by drunken drivers: 0
Fatalities: 1
Persons involved in fatal accidents: 1
Pedestrians involved in fatal accidents: 0
Fatal accident statistics in 2013:
Fatal accident count: 1
Vehicles involved in fatal accidents: 2
Fatal accidents caused by drunken drivers: 0
Fatalities: 1
Persons involved in fatal accidents: 3
Pedestrians involved in fatal accidents: 0
2002 - 2018 National Fire Incident Reporting System (NFIRS) incidents
Based on the data from the years 2002 - 2018 the average number of fire incidents per year is 19. The highest number of reported fires - 49 took place in 2012, and the least - 4 in 2002. The data has a growing trend.
When looking into fire subcategories, the most reports belonged to: Structure Fires (59.1%), and Outside Fires (29.6%).
Fire incident types reported to NFIRS in Zip Code 43517


 Nearest zip codes: 43505, 43526, 46721, 43536, 43518, 43506.


 Based on the data from the years 2002 - 2018 the average number of fire incidents per year is 19. The highest number of reported fires - 49 took place in 2012, and the least - 4 in 2002. The data has a growing trend.
 When looking into fire subcategories, the most reports belonged to: Structure Fires (59.1%), and Outside Fires (29.6%).