Estimated zip code population in 2022: 7,912 Zip code population in 2010: 7,979 Zip code population in 2000: 8,200
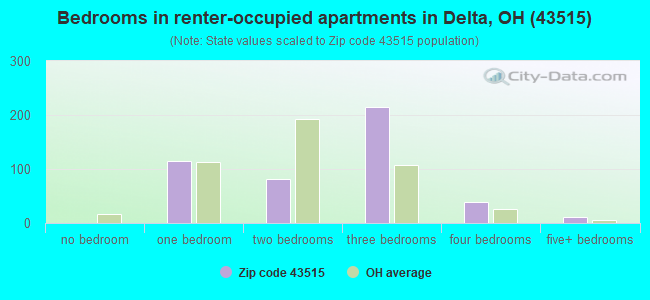
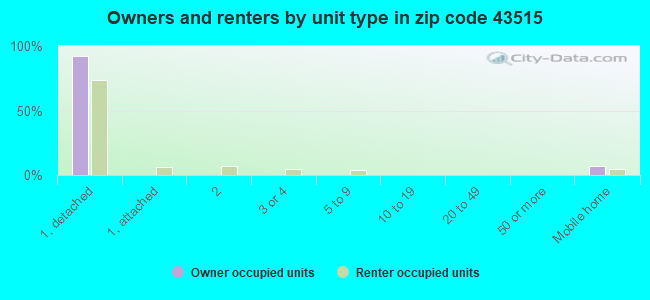
Houses and condos: 3,360 Renter-occupied apartments: 466
% of renters here:
15%
State:
33%
March 2022 cost of living index in zip code 43515: 82.7 (low, U.S. average is 100)
Land area: 81.6 sq. mi. Water area: 0.3 sq. mi.
Population density: 97 people per square mile
(very low).
OSM Map
General Map
Google Map
MSN Map
OSM Map
General Map
Google Map
MSN Map
OSM Map
General Map
Google Map
MSN Map
OSM Map
General Map
Google Map
MSN Map
Please wait while loading the map...
Real estate property taxes paid for housing units in 2022:
This zip code:
1.2% ($2,073)
Ohio:
1.3% ($2,639)
Median real estate property taxes paid for housing units with mortgages in 2022: $2,028 (1.0%) Median real estate property taxes paid for housing units with no mortgage in 2022: $2,179 (1.4%)
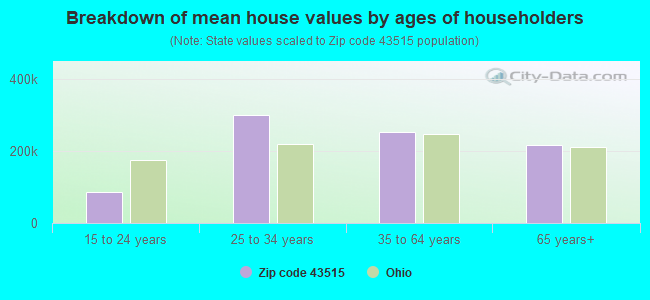
Estimated median house/condo value in 2022: $179,604
43515:
$179,604
Ohio:
$204,100
According to our research of Ohio and other state lists, there were 11 registered sex offenders living in 43515 zip code as of July 03, 2024. The ratio of all residents to sex offenders in zip code 43515 is 831 to 1. The ratio of registered sex offenders to all residents in this zip code is lower than the state average.
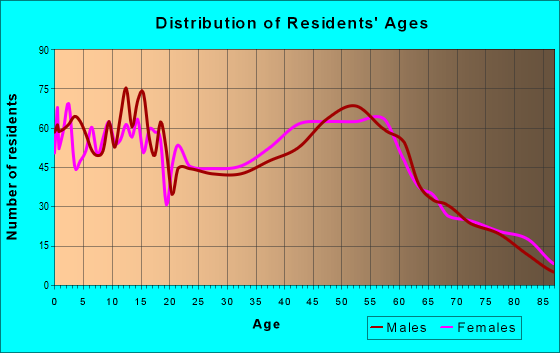
Median resident age:
This zip code:
41.4 years
Ohio median age:
39.9 years
Average household size:
This zip code:
2.5 people
Ohio:
2.4 people
Averages for the 2020 tax year for zip code 43515, filed in 2021:
Average Adjusted Gross Income (AGI) in 2020: $55,612 (Individual Income Tax Returns)
Here:
$55,612
State:
$67,288
Salary/wage: $47,793 (reported on 83.5% of returns)
Here:
$47,793
State:
$55,628
(% of AGI for various income ranges: 1211.6% for AGIs below $25k, 3488.3% for AGIs $25k-50k, 6222.7% for AGIs $50k-75k, 8990.0% for AGIs $75k-100k, 14873.8% for AGIs $100k-200k)
Taxable interest for individuals: $858 (reported on 25.8% of returns)
This zip code:
$858
Ohio:
$1,518
(% of AGI for various income ranges: 12.2% for AGIs below $25k, 14.7% for AGIs $25k-50k, 24.1% for AGIs $50k-75k, 59.1% for AGIs $75k-100k, 67.1% for AGIs $100k-200k)
Ordinary dividends: $1,807 (reported on 14.5% of returns)
Here:
$1,807
State:
$7,167
(% of AGI for various income ranges: 15.9% for AGIs below $25k, 23.0% for AGIs $25k-50k, 36.3% for AGIs $50k-75k, 40.9% for AGIs $75k-100k, 84.4% for AGIs $100k-200k)
Net capital gain/loss in AGI: +$8,231 (reported on 13.5% of returns)
Here:
+$8,231
State:
+$18,919
(% of AGI for various income ranges: 9.9% for AGIs below $25k, 45.3% for AGIs $25k-50k, 34.5% for AGIs $50k-75k, 192.1% for AGIs $75k-100k, 543.5% for AGIs $100k-200k)
Profit/loss from business: +$7,986 (reported on 12.0% of returns)
Here:
+$7,986
State:
+$13,744
(% of AGI for various income ranges: 82.9% for AGIs below $25k, 15.6% for AGIs $25k-50k, 218.4% for AGIs $50k-75k, 158.8% for AGIs $75k-100k, 410.3% for AGIs $100k-200k)
Taxable individual retirement arrangement distribution: $11,862 (reported on 9.1% of returns)
43515:
$11,862
Ohio:
$18,876
(% of AGI for various income ranges: 54.7% for AGIs below $25k, 85.9% for AGIs $25k-50k, 190.2% for AGIs $50k-75k, 262.4% for AGIs $75k-100k, 382.4% for AGIs $100k-200k)
Total itemized deductions: $27,680 (reported on 2.5% of returns)
Here:
$27,680
State:
$33,869
(% of AGI for various income ranges: 51.2% for AGIs below $25k, 229.2% for AGIs $50k-75k, 343.8% for AGIs $100k-200k)
Charity contributions: $10,800 (reported on 1.7% of returns)
Here:
$10,800
State:
$14,577
(% of AGI for various income ranges: 62.2% for AGIs $50k-75k, 132.6% for AGIs $100k-200k)
Taxes paid: $5,800 (reported on 2.5% of returns)
43515:
$5,800
State:
$7,681
(% of AGI for various income ranges: 54.5% for AGIs $50k-75k, 92.1% for AGIs $100k-200k)
Earned income credit: $2,196 (reported on 13.8% of returns)
Here:
$2,196
State:
$2,304
(% of AGI for various income ranges: 80.4% for AGIs below $25k, 54.8% for AGIs $25k-50k)
Percentage of individuals using paid preparers for their 2020 taxes: 94.1%
Here:
94%
State:
94%
(% for various income ranges: 92.8% for AGIs below $25k, 95.5% for AGIs $25k-50k, 94.0% for AGIs $50k-75k, 95.7% for AGIs $75k-100k, 94.1% for AGIs $100k-200k, 83.3% for AGIs over 200k)
Averages for the 2012 tax year for zip code 43515, filed in 2013:
Average Adjusted Gross Income (AGI) in 2012: $46,990 (Individual Income Tax Returns)
Here:
$46,990
State:
$54,926
Salary/wage: $39,350 (reported on 85.6% of returns)
Here:
$39,350
State:
$45,869
(% of AGI for various income ranges: 72.6% for AGIs below $25k, 76.3% for AGIs $25k-50k, 76.3% for AGIs $50k-75k, 77.5% for AGIs $75k-100k, 73.0% for AGIs $100k-200k, 28.1% for AGIs over 200k)
Taxable interest for individuals: $823 (reported on 30.9% of returns)
This zip code:
$823
Ohio:
$1,297
(% of AGI for various income ranges: 0.9% for AGIs below $25k, 0.5% for AGIs $25k-50k, 0.7% for AGIs $50k-75k, 0.4% for AGIs $75k-100k, 0.5% for AGIs $100k-200k, 0.3% for AGIs over 200k)
Ordinary dividends: $1,630 (reported on 14.1% of returns)
Here:
$1,630
State:
$5,821
(% of AGI for various income ranges: 0.7% for AGIs below $25k, 0.4% for AGIs $25k-50k, 0.7% for AGIs $50k-75k, 0.4% for AGIs $75k-100k, 0.4% for AGIs $100k-200k, 0.3% for AGIs over 200k)
Net capital gain/loss in AGI: +$4,462 (reported on 10.7% of returns)
Here:
+$4,462
State:
+$11,232
(% of AGI for various income ranges: 0.3% for AGIs below $25k, 0.4% for AGIs $25k-50k, 0.3% for AGIs $50k-75k, 0.2% for AGIs $75k-100k, 3.7% for AGIs $100k-200k)
Profit/loss from business: +$11,239 (reported on 14.4% of returns)
Here:
+$11,239
State:
+$12,773
(% of AGI for various income ranges: 5.7% for AGIs below $25k, 3.4% for AGIs $25k-50k, 3.0% for AGIs $50k-75k, 2.2% for AGIs $75k-100k, 5.2% for AGIs $100k-200k)
Taxable individual retirement arrangement distribution: $11,081 (reported on 9.9% of returns)
43515:
$11,081
Ohio:
$14,511
(% of AGI for various income ranges: 2.1% for AGIs below $25k, 2.0% for AGIs $25k-50k, 2.7% for AGIs $50k-75k, 2.4% for AGIs $75k-100k, 3.1% for AGIs $100k-200k)
Total itemized deductions: $17,278 (21% of AGI, reported on 27.7% of returns)
Here:
$17,278
State:
$21,278
Here:
20.9% of AGI
State:
18.8% of AGI
(% of AGI for various income ranges: 6.0% for AGIs below $25k, 7.4% for AGIs $25k-50k, 11.0% for AGIs $50k-75k, 11.8% for AGIs $75k-100k, 12.6% for AGIs $100k-200k, 10.5% for AGIs over 200k)
Charity contributions: $3,071 (reported on 20.0% of returns)
Here:
$3,071
State:
$3,943
(% of AGI for various income ranges: 0.6% for AGIs below $25k, 0.8% for AGIs $25k-50k, 1.1% for AGIs $50k-75k, 1.4% for AGIs $75k-100k, 1.8% for AGIs $100k-200k, 2.4% for AGIs over 200k)
Taxes paid: $6,067 (reported on 27.7% of returns)
43515:
$6,067
State:
$9,568
(% of AGI for various income ranges: 1.0% for AGIs below $25k, 1.7% for AGIs $25k-50k, 3.6% for AGIs $50k-75k, 4.3% for AGIs $75k-100k, 5.3% for AGIs $100k-200k, 5.6% for AGIs over 200k)
Earned income credit: $2,093 (reported on 15.7% of returns)
Here:
$2,093
State:
$2,285
(% of AGI for various income ranges: 5.3% for AGIs below $25k, 0.9% for AGIs $25k-50k)
Percentage of individuals using paid preparers for their 2012 taxes: 57.6%
Here:
58%
State:
51%
(% for various income ranges: 49.6% for AGIs below $25k, 61.8% for AGIs $25k-50k, 60.7% for AGIs $50k-75k, 59.0% for AGIs $75k-100k, 66.7% for AGIs $100k-200k, 100.0% for AGIs over 200k)
Averages for the 2004 tax year for zip code 43515, filed in 2005:
Average Adjusted Gross Income (AGI) in 2004: $37,908 (Individual Income Tax Returns)
Here:
$37,908
State:
$44,480
Salary/wage: $35,030 (reported on 87.4% of returns)
Here:
$35,030
State:
$39,198
(% of AGI for various income ranges: 112.7% for AGIs below $10k, 75.6% for AGIs $10k-25k, 81.0% for AGIs $25k-50k, 84.0% for AGIs $50k-75k, 85.4% for AGIs $75k-100k, 67.6% for AGIs over 100k)
Taxable interest for individuals: $1,098 (reported on 41.2% of returns)
This zip code:
$1,098
Ohio:
$1,532
(% of AGI for various income ranges: 6.7% for AGIs below $10k, 2.1% for AGIs $10k-25k, 0.9% for AGIs $25k-50k, 1.2% for AGIs $50k-75k, 0.8% for AGIs $75k-100k, 0.8% for AGIs over 100k)
Taxable dividends: $1,113 (reported on 17.7% of returns)
Here:
$1,113
State:
$3,496
(% of AGI for various income ranges: 2.2% for AGIs below $10k, 0.7% for AGIs $10k-25k, 0.5% for AGIs $25k-50k, 0.5% for AGIs $50k-75k, 0.2% for AGIs $75k-100k, 0.7% for AGIs over 100k)
Net capital gain/loss: +$3,161 (reported on 13.1% of returns)
Here:
+$3,161
State:
+$8,582
(% of AGI for various income ranges: -1.1% for AGIs below $10k, 0.4% for AGIs $10k-25k, 0.4% for AGIs $25k-50k, 0.5% for AGIs $50k-75k, 1.4% for AGIs $75k-100k, 4.2% for AGIs over 100k)
Profit/loss from business: +$10,292 (reported on 14.8% of returns)
Here:
+$10,292
State:
+$10,813
(% of AGI for various income ranges: -0.6% for AGIs below $10k, 4.7% for AGIs $10k-25k, 4.8% for AGIs $25k-50k, 2.9% for AGIs $50k-75k, 3.0% for AGIs $75k-100k, 6.0% for AGIs over 100k)
IRA payment deduction: $2,371 (reported on 3.2% of returns)
43515:
$2,371
Ohio:
$2,794
(% of AGI for various income ranges: 0.2% for AGIs $10k-25k, 0.3% for AGIs $25k-50k, 0.2% for AGIs $50k-75k, 0.2% for AGIs $75k-100k)
Self-employed pension: $8,316 (reported on 0.5% of returns)
Here:
$8,316
Ohio:
$13,981
Total itemized deductions: $14,323 (23% of AGI, reported on 33.5% of returns)
Here:
$14,323
State:
$17,503
Here:
22.8% of AGI
State:
20.8% of AGI
(% of AGI for various income ranges: 8.6% for AGIs below $10k, 8.5% for AGIs $10k-25k, 10.5% for AGIs $25k-50k, 13.5% for AGIs $50k-75k, 15.8% for AGIs $75k-100k, 14.9% for AGIs over 100k)
Charity contributions deductions: $2,110 (3% of AGI, reported on 25.3% of returns)
Here:
$2,110
State:
$3,087
Here:
3.1% of AGI
State:
3.4% of AGI
(% of AGI for various income ranges: 0.3% for AGIs below $10k, 0.7% for AGIs $10k-25k, 1.0% for AGIs $25k-50k, 1.5% for AGIs $50k-75k, 1.6% for AGIs $75k-100k, 2.5% for AGIs over 100k)
Total tax: $4,311 (reported on 78.6% of returns)
43515:
$4,311
State:
$6,781
(% of AGI for various income ranges: 3.2% for AGIs below $10k, 4.5% for AGIs $10k-25k, 7.2% for AGIs $25k-50k, 8.7% for AGIs $50k-75k, 10.2% for AGIs $75k-100k, 15.6% for AGIs over 100k)
Earned income credit: $1,622 (reported on 11.8% of returns)
Here:
$1,622
State:
$1,696
Percentage of individuals using paid preparers for their 2004 taxes: 58.5%
Here:
59%
State:
55%
(% for various income ranges: 49.1% for AGIs below $10k, 57.1% for AGIs $10k-25k, 63.1% for AGIs $25k-50k, 60.2% for AGIs $50k-75k, 61.6% for AGIs $75k-100k, 65.3% for AGIs over 100k)
Likely homosexual households (counted as self-reported same-sex unmarried-partner households)
Lesbian couples: 0.2% of all households
Gay men: 0.0% of all households
Household received Food Stamps/SNAP in the past 12 months: 197 Household did not receive Food Stamps/SNAP in the past 12 months: 2,921
Women who had a birth in the past 12 months: 100 (63 now married, 36 unmarried) Women who did not have a birth in the past 12 months: 1,550 (825 now married, 724 unmarried)
Housing units in zip code 43515 with a mortgage: 1,682 (166 second mortgage, 16 home equity loan, 154 both second mortgage and home equity loan) Houses without a mortgage: 124
Median monthly owner costs for units with a mortgage: $1,246 Median monthly owner costs for units without a mortgage: $514
Residents with income below the poverty level in 2022:
This zip code:
9.4%
Whole state:
13.4%
Residents with income below 50% of the poverty level in 2022:
This zip code:
3.5%
Whole state:
7.0%
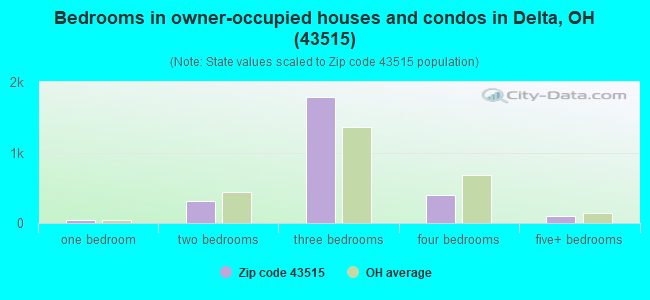
Median number of rooms in houses and condos:
Here:
6.8
State:
6.7
Median number of rooms in apartments:
Here:
5.1
State:
4.4
Notable locations in this zip code not listed on our city pages
Notable locations in zip code 43515: Delta Industrial Park (A), Brehm's Dairy Farm (B), Beroske Farms and Greenhouse (C), Delta Sewage Treatment Plant (D), Delta Community Fire Department Station 1 (E), Delta Community Fire Department Station 2 (F), Delta Public Library (G), Delta Memorial Hall (H), Lemles Greenhouse (I). Display/hide their locations on the map
Churches in zip code 43515 include: Fulton Union Church (A), Shiloh Christian Union Church (B), Trail Chapel (C), First Baptist Church (D), Church of Christ (E), Lytton Zion United Church of Christ (F), Bible Baptist Church (G), Delta Assembly of God Church (H), Delta Church of the Nazarene (I). Display/hide their locations on the map
Cemeteries: Berkebile Cemetery (1), Salsberry Cemetery (2), Lutheran Cemetery (3), Aetna Cemetery (4), Shiloh Cemetery (5), Raker Cemetery (6), Old Delta Cemetery (7). Display/hide their locations on the map
1,450 married couples with children.
362 single-parent households (71 men, 291 women).
96.6% of residents of 43515 zip code speak English at home.
3.0% of residents speak Spanish at home (7% very well, 18% well, 76% not well).
0.4% of residents speak other Indo-European language at home (100% very well).
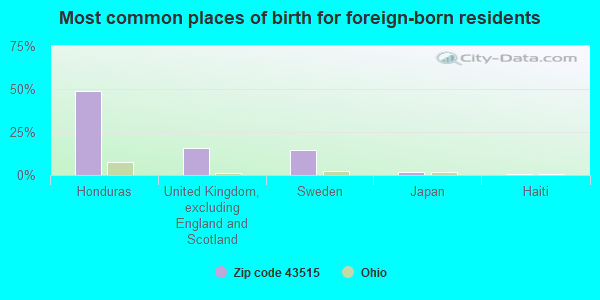
Foreign born population: 114 (1.4%) (1.8% of them are naturalized citizens)
This zip code:
1.4%
Whole state:
5.0%
49%Honduras
16%United Kingdom, excluding England and Scotland
15%Sweden
2%Japan
1%Haiti
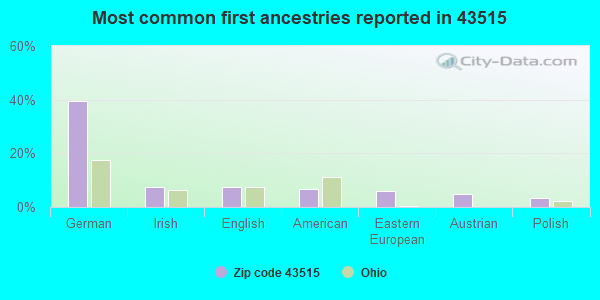
39%German
7%Irish
7%English
7%American
6%Eastern European
5%Austrian
3%Polish
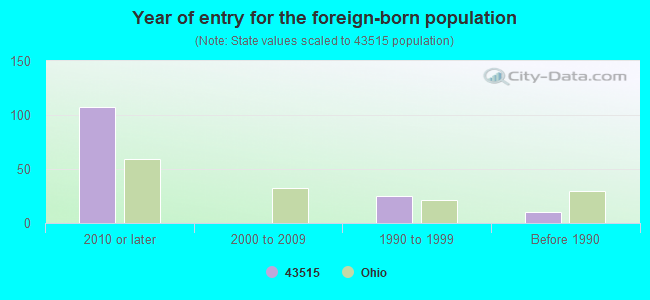
Year of entry for the foreign-born population
1072010 or later
02000 to 2009
251990 to 1999
10Before 1990
Facilities with environmental interests located in this zip code:
BAILEY-PVS OXIDES LLC (6191 COUNTY RD 10 in DELTA, OH)
AIR MINOR (AIRS/AFS) ENFORCEMENT/COMPLIANCE ACTIVITY (Integrated Compliance Information System) STATE MASTER (Ohio general info) - RCRA-OHR000040931, HAZARDOUS WASTE PROGRAM Conditionally Exempt Small Quantity Generators, less than 100 kg/month of hazardous waste (Resource Conservation and Recovery Act (tracking hazardous waste)) - notification TRI REPORTER (Tracking of toxic chemicals releasing facilities) Business SIC classification: INORGANIC PIGMENTS; INDUSTRIAL INORGANIC CHEMICALS Organizations: BAILY - PVS OXIDES, LLC (COGNIZANT OFFICIAL)
Alternative names: BAILEY PVS OXIDES, BAILEY - PVS OXIDES (DELTA) LLC
AMOCO FERTILIZER PLANT (1000 S ST RT 109 in DELTA, OH)
STATE MASTER (Ohio general info) - RCRA-OHD000721928, HAZARDOUS WASTE PROGRAM (Resource Conservation and Recovery Act (tracking hazardous waste))
BORDEN CHEMICAL SMITH-DOUGLASS DIV (M ROAD & STATE RT 109 in DELTA, OH)
(Resource Conservation and Recovery Act (tracking hazardous waste))
BEROSKES FARMS & GREENHOUSE (12647 COUNTY ROAD 5 in DELTA, OH)
ENFORCEMENT/COMPLIANCE ACTIVITY (Integrated Compliance Information System) COMPLIANCE ACTIVITY (Tracking inspections of insecticide, fungicide, and rodenticide, and toxic substances)
Housing units lacking complete plumbing facilities: 2.3% Housing units lacking complete kitchen facilities: 2.3%
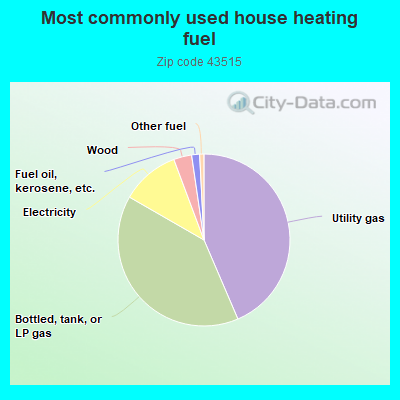
43.6%Utility gas
39.8%Bottled, tank, or LP gas
11.0%Electricity
3.4%Wood
1.5%Fuel oil, kerosene, etc.
0.8%Other fuel
Population in 1990: 11,110.
Place of birth for U.S.-born residents:
This state: 6,591
Northeast: 127
Midwest: 610
South: 329
West: 110
66% of the 43515 zip code residents lived in the same house 5 years ago. Out of people who lived in different houses, 49% lived in this county. Out of people who lived in different counties, 50% lived in Ohio.
95% of the 43515 zip code residents lived in the same house 1 year ago. Out of people who lived in different houses, 37% moved from this county. Out of people who lived in different houses, 58% moved from different county within same state. Out of people who lived in different houses, 12% moved from different state. Out of people who lived in different houses, 3% moved from abroad.
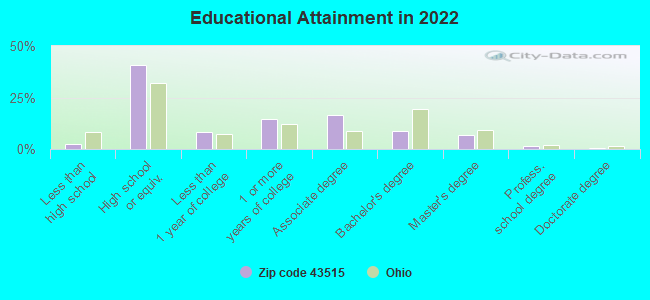
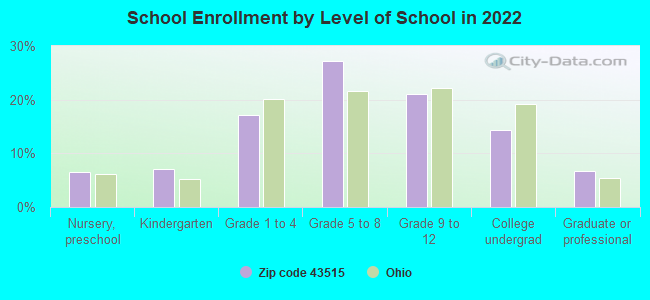
Private vs. public school enrollment:
Students in private schools in grades 1 to 8 (elementary and middle school): 167
Here:
19.7%
Ohio:
16.0%
Students in private schools in grades 9 to 12 (high school): 78
Here:
19.4%
Ohio:
13.1%
Students in private undergraduate colleges: 15
Here:
5.4%
Ohio:
22.3%
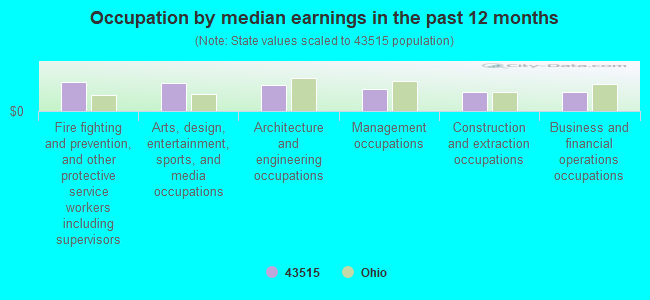
Occupation by median earnings in the past 12 months ($)
106,483Fire fighting and prevention, and other protective service workers including supervisors
100,184Arts, design, entertainment, sports, and media occupations
94,060Architecture and engineering occupations
78,272Management occupations
70,265Construction and extraction occupations
68,292Business and financial operations occupations
Top industries in this zip code by the number of employees in 2005:
Construction: New Single-Family Housing Construction (except Operative Builders) (10-19: 2, 5-9: 2)
Health Care and Social Assistance: Child Day Care Services (20-49: 1, 5-9: 1, 1-4: 1)
Other Services (except Public Administration): Commercial and Industrial Machinery and Equipment (except Automotive and Electronic) Repair and Maintenance (20-49: 1, 1-4: 1)
People in group quarters in 2000:
14 people in agriculture workers' dormitories on farms
5 people in homes or halfway houses for drug/alcohol abuse
4 people in homes for the mentally retarded
4 people in other group homes
Fatal accident statistics in 2014:
Fatal accident count: 2
Vehicles involved in fatal accidents: 4
Fatal accidents caused by drunken drivers: 0
Fatalities: 4
Persons involved in fatal accidents: 6
Pedestrians involved in fatal accidents: 0
Fatal accident statistics in 2013:
Fatal accident count: 4
Vehicles involved in fatal accidents: 6
Fatal accidents caused by drunken drivers: 3
Fatalities: 4
Persons involved in fatal accidents: 12
Pedestrians involved in fatal accidents: 0
Home Mortgage Disclosure Act Aggregated Statistics For Year 2009 (Based on 1 full and 6 partial tracts)
A) FHA, FSA/RHS & VA Home Purchase Loans
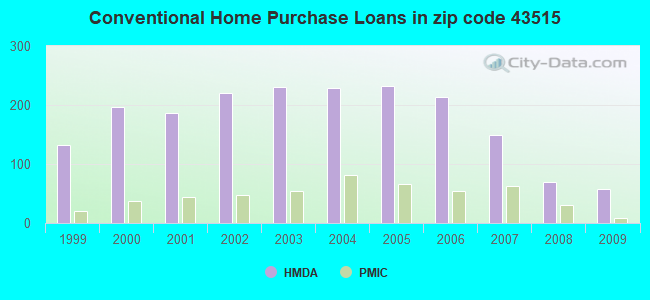
B) Conventional Home Purchase Loans
C) Refinancings
D) Home Improvement Loans
F) Non-occupant Loans on < 5 Family Dwellings (A B C & D)
G) Loans On Manufactured Home Dwelling (A B C & D)
Number
Average Value
Number
Average Value
Number
Average Value
Number
Average Value
Number
Average Value
Number
Average Value
LOANS ORIGINATED
35
$117,877
58
$119,220
370
$125,518
27
$44,768
19
$112,932
12
$71,590
APPLICATIONS APPROVED, NOT ACCEPTED
4
$93,575
1
$133,530
25
$151,853
3
$10,283
0
$0
0
$0
APPLICATIONS DENIED
4
$80,805
13
$78,786
168
$140,082
13
$26,244
5
$60,616
13
$54,681
APPLICATIONS WITHDRAWN
1
$67,900
9
$131,908
66
$146,301
3
$122,010
0
$0
1
$138,910
FILES CLOSED FOR INCOMPLETENESS
0
$0
0
$0
4
$160,195
0
$0
0
$0
0
$0
Aggregated Statistics For Year 2008 (Based on 1 full and 6 partial tracts)
A) FHA, FSA/RHS & VA Home Purchase Loans
B) Conventional Home Purchase Loans
C) Refinancings
D) Home Improvement Loans
F) Non-occupant Loans on < 5 Family Dwellings (A B C & D)
G) Loans On Manufactured Home Dwelling (A B C & D)
Number
Average Value
Number
Average Value
Number
Average Value
Number
Average Value
Number
Average Value
Number
Average Value
LOANS ORIGINATED
32
$119,829
70
$116,506
179
$122,153
36
$51,209
11
$129,669
10
$81,375
APPLICATIONS APPROVED, NOT ACCEPTED
2
$114,575
8
$108,525
22
$114,458
9
$23,212
2
$77,175
1
$46,500
APPLICATIONS DENIED
6
$103,730
29
$104,949
161
$132,594
36
$57,016
10
$110,933
7
$101,811
APPLICATIONS WITHDRAWN
3
$75,767
8
$148,799
59
$140,017
4
$127,938
4
$120,582
1
$47,870
FILES CLOSED FOR INCOMPLETENESS
0
$0
2
$113,100
12
$160,388
5
$48,288
1
$30,040
2
$74,390
Aggregated Statistics For Year 2007 (Based on 1 full and 6 partial tracts)
A) FHA, FSA/RHS & VA Home Purchase Loans
B) Conventional Home Purchase Loans
C) Refinancings
D) Home Improvement Loans
E) Loans on Dwellings For 5+ Families
F) Non-occupant Loans on < 5 Family Dwellings (A B C & D)
G) Loans On Manufactured Home Dwelling (A B C & D)
Number
Average Value
Number
Average Value
Number
Average Value
Number
Average Value
Number
Average Value
Number
Average Value
Number
Average Value
LOANS ORIGINATED
12
$121,257
149
$118,982
219
$111,943
45
$43,460
1
$269,000
20
$82,658
15
$76,260
APPLICATIONS APPROVED, NOT ACCEPTED
1
$75,000
18
$76,426
43
$132,758
9
$34,604
0
$0
1
$36,780
11
$47,776
APPLICATIONS DENIED
2
$112,075
61
$89,215
265
$127,167
39
$47,680
0
$0
11
$65,151
32
$62,677
APPLICATIONS WITHDRAWN
2
$102,785
20
$110,534
90
$136,849
8
$78,418
0
$0
6
$72,405
7
$84,431
FILES CLOSED FOR INCOMPLETENESS
1
$74,120
2
$175,355
24
$164,705
3
$18,600
0
$0
0
$0
0
$0
Aggregated Statistics For Year 2006 (Based on 1 full and 6 partial tracts)
A) FHA, FSA/RHS & VA Home Purchase Loans
B) Conventional Home Purchase Loans
C) Refinancings
D) Home Improvement Loans
F) Non-occupant Loans on < 5 Family Dwellings (A B C & D)
G) Loans On Manufactured Home Dwelling (A B C & D)
Number
Average Value
Number
Average Value
Number
Average Value
Number
Average Value
Number
Average Value
Number
Average Value
LOANS ORIGINATED
13
$122,677
214
$111,610
284
$111,128
36
$39,619
23
$94,127
28
$71,885
APPLICATIONS APPROVED, NOT ACCEPTED
2
$118,140
24
$89,750
61
$111,346
12
$47,938
5
$81,038
3
$49,410
APPLICATIONS DENIED
1
$134,000
63
$78,236
239
$118,586
46
$34,724
3
$110,443
40
$58,560
APPLICATIONS WITHDRAWN
3
$107,680
30
$94,624
105
$120,542
7
$59,117
4
$110,345
4
$81,060
FILES CLOSED FOR INCOMPLETENESS
0
$0
3
$123,577
40
$154,404
1
$79,210
0
$0
0
$0
Aggregated Statistics For Year 2005 (Based on 1 full and 6 partial tracts)
A) FHA, FSA/RHS & VA Home Purchase Loans
B) Conventional Home Purchase Loans
C) Refinancings
D) Home Improvement Loans
E) Loans on Dwellings For 5+ Families
F) Non-occupant Loans on < 5 Family Dwellings (A B C & D)
G) Loans On Manufactured Home Dwelling (A B C & D)
Number
Average Value
Number
Average Value
Number
Average Value
Number
Average Value
Number
Average Value
Number
Average Value
Number
Average Value
LOANS ORIGINATED
8
$119,402
233
$116,729
354
$116,736
48
$57,968
1
$484,400
20
$78,022
41
$69,160
APPLICATIONS APPROVED, NOT ACCEPTED
0
$0
38
$105,085
69
$103,680
10
$34,895
0
$0
4
$74,348
6
$23,113
APPLICATIONS DENIED
2
$126,430
86
$75,898
275
$124,716
58
$42,364
0
$0
11
$87,603
53
$41,015
APPLICATIONS WITHDRAWN
4
$121,290
25
$114,648
168
$133,719
26
$134,612
0
$0
9
$105,351
4
$89,322
FILES CLOSED FOR INCOMPLETENESS
0
$0
9
$95,062
29
$144,767
3
$81,033
0
$0
2
$70,695
1
$25,000
Aggregated Statistics For Year 2004 (Based on 1 full and 6 partial tracts)
A) FHA, FSA/RHS & VA Home Purchase Loans
B) Conventional Home Purchase Loans
C) Refinancings
D) Home Improvement Loans
F) Non-occupant Loans on < 5 Family Dwellings (A B C & D)
G) Loans On Manufactured Home Dwelling (A B C & D)
Number
Average Value
Number
Average Value
Number
Average Value
Number
Average Value
Number
Average Value
Number
Average Value
LOANS ORIGINATED
14
$119,426
228
$115,680
382
$110,507
46
$43,958
26
$86,693
32
$69,502
APPLICATIONS APPROVED, NOT ACCEPTED
2
$145,680
26
$86,417
65
$103,050
6
$31,007
2
$42,735
6
$38,815
APPLICATIONS DENIED
3
$123,800
86
$91,430
254
$117,351
50
$57,867
8
$64,649
38
$60,539
APPLICATIONS WITHDRAWN
4
$118,472
36
$121,496
149
$122,480
10
$51,980
4
$103,440
7
$81,624
FILES CLOSED FOR INCOMPLETENESS
0
$0
9
$112,333
38
$124,026
4
$49,975
1
$70,390
1
$100,430
Aggregated Statistics For Year 2003 (Based on 1 full and 6 partial tracts)
A) FHA, FSA/RHS & VA Home Purchase Loans
B) Conventional Home Purchase Loans
C) Refinancings
D) Home Improvement Loans
F) Non-occupant Loans on < 5 Family Dwellings (A B C & D)
Number
Average Value
Number
Average Value
Number
Average Value
Number
Average Value
Number
Average Value
LOANS ORIGINATED
14
$131,274
230
$106,680
848
$107,866
45
$20,127
44
$97,562
APPLICATIONS APPROVED, NOT ACCEPTED
0
$0
30
$77,951
123
$117,924
8
$31,322
1
$140,790
APPLICATIONS DENIED
2
$137,085
69
$71,186
289
$108,255
29
$21,850
8
$99,576
APPLICATIONS WITHDRAWN
3
$124,563
23
$92,409
147
$111,362
6
$43,945
8
$72,708
FILES CLOSED FOR INCOMPLETENESS
0
$0
6
$89,327
33
$116,617
0
$0
1
$45,830
Aggregated Statistics For Year 2002 (Based on 1 full and 6 partial tracts)
A) FHA, FSA/RHS & VA Home Purchase Loans
B) Conventional Home Purchase Loans
C) Refinancings
D) Home Improvement Loans
E) Loans on Dwellings For 5+ Families
F) Non-occupant Loans on < 5 Family Dwellings (A B C & D)
Number
Average Value
Number
Average Value
Number
Average Value
Number
Average Value
Number
Average Value
Number
Average Value
LOANS ORIGINATED
15
$127,635
220
$105,315
734
$101,029
32
$26,276
1
$406,000
26
$83,205
APPLICATIONS APPROVED, NOT ACCEPTED
3
$101,727
37
$70,611
101
$100,624
13
$12,552
0
$0
4
$99,310
APPLICATIONS DENIED
3
$80,357
88
$55,582
243
$103,391
34
$11,525
0
$0
7
$45,563
APPLICATIONS WITHDRAWN
2
$107,500
17
$89,320
121
$106,729
2
$10,195
0
$0
2
$89,040
FILES CLOSED FOR INCOMPLETENESS
0
$0
1
$79,210
50
$120,470
2
$19,690
0
$0
0
$0
Aggregated Statistics For Year 2001 (Based on 1 full and 6 partial tracts)
A) FHA, FSA/RHS & VA Home Purchase Loans
B) Conventional Home Purchase Loans
C) Refinancings
D) Home Improvement Loans
F) Non-occupant Loans on < 5 Family Dwellings (A B C & D)
Number
Average Value
Number
Average Value
Number
Average Value
Number
Average Value
Number
Average Value
LOANS ORIGINATED
23
$100,538
186
$96,072
769
$98,005
54
$14,591
13
$51,612
APPLICATIONS APPROVED, NOT ACCEPTED
1
$75,820
49
$49,630
111
$105,290
18
$17,150
3
$35,093
APPLICATIONS DENIED
0
$0
105
$43,418
220
$89,692
52
$14,072
4
$19,798
APPLICATIONS WITHDRAWN
3
$109,203
19
$83,488
118
$98,948
7
$25,787
2
$86,670
FILES CLOSED FOR INCOMPLETENESS
0
$0
2
$68,975
20
$88,338
0
$0
2
$72,175
Aggregated Statistics For Year 2000 (Based on 1 full and 6 partial tracts)
A) FHA, FSA/RHS & VA Home Purchase Loans
B) Conventional Home Purchase Loans
C) Refinancings
D) Home Improvement Loans
F) Non-occupant Loans on < 5 Family Dwellings (A B C & D)
Number
Average Value
Number
Average Value
Number
Average Value
Number
Average Value
Number
Average Value
LOANS ORIGINATED
19
$99,685
197
$97,486
197
$80,300
59
$18,592
16
$58,095
APPLICATIONS APPROVED, NOT ACCEPTED
0
$0
49
$47,957
66
$75,228
25
$21,187
0
$0
APPLICATIONS DENIED
2
$61,735
129
$42,800
125
$74,959
32
$15,781
2
$47,685
APPLICATIONS WITHDRAWN
5
$82,444
10
$94,483
76
$65,586
6
$29,207
2
$20,195
FILES CLOSED FOR INCOMPLETENESS
0
$0
2
$93,940
24
$81,894
0
$0
0
$0
Aggregated Statistics For Year 1999 (Based on 1 full and 3 partial tracts)
A) FHA, FSA/RHS & VA Home Purchase Loans
B) Conventional Home Purchase Loans
C) Refinancings
D) Home Improvement Loans
F) Non-occupant Loans on < 5 Family Dwellings (A B C & D)
2002 - 2018 National Fire Incident Reporting System (NFIRS) incidents
According to the data from the years 2002 - 2018 the average number of fire incidents per year is 47. The highest number of fire incidents - 71 took place in 2009, and the least - 21 in 2004. The data has a declining trend.
When looking into fire subcategories, the most incidents belonged to: Structure Fires (47.3%), and Outside Fires (39.6%).
Fire incident types reported to NFIRS in Zip Code 43515
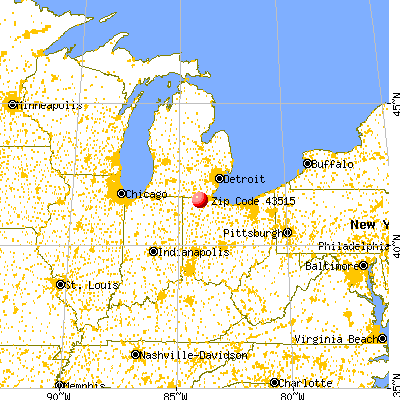


 Nearest zip codes: 43533, 43558, 43540, 43532, 43567, 43547.


 According to the data from the years 2002 - 2018 the average number of fire incidents per year is 47. The highest number of fire incidents - 71 took place in 2009, and the least - 21 in 2004. The data has a declining trend.
 When looking into fire subcategories, the most incidents belonged to: Structure Fires (47.3%), and Outside Fires (39.6%).