Estimated zip code population in 2022: 3,135 Zip code population in 2010: 3,450 Zip code population in 2000: 3,429
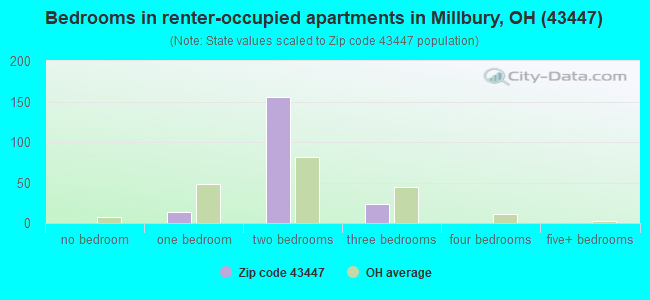
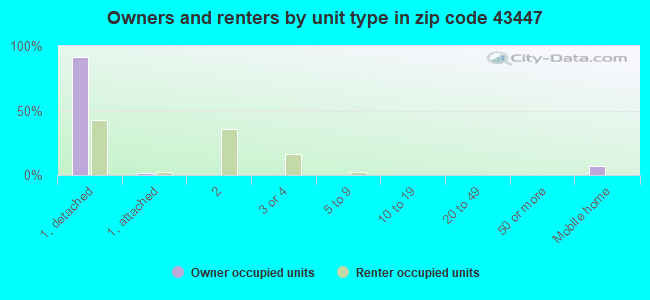
Houses and condos: 1,310 Renter-occupied apartments: 193
% of renters here:
16%
State:
33%
March 2022 cost of living index in zip code 43447: 92.7 (less than average, U.S. average is 100)
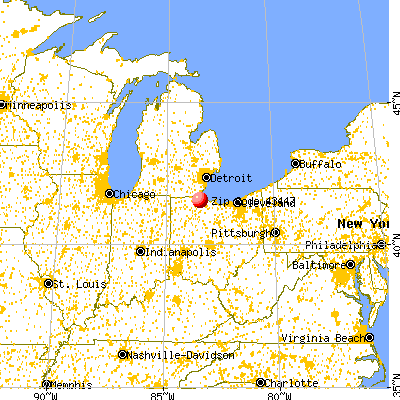
Land area: 16.9 sq. mi. Water area: 0.0 sq. mi.
Population density: 186 people per square mile
(very low).
OSM Map
General Map
Google Map
MSN Map
OSM Map
General Map
Google Map
MSN Map
OSM Map
General Map
Google Map
MSN Map
OSM Map
General Map
Google Map
MSN Map
Please wait while loading the map...
Real estate property taxes paid for housing units in 2022:
This zip code:
1.4% ($2,857)
Ohio:
1.3% ($2,639)
Median real estate property taxes paid for housing units with mortgages in 2022: $3,053 (1.4%) Median real estate property taxes paid for housing units with no mortgage in 2022: $2,542 (1.3%)
Business Search- 14 Million verified businesses
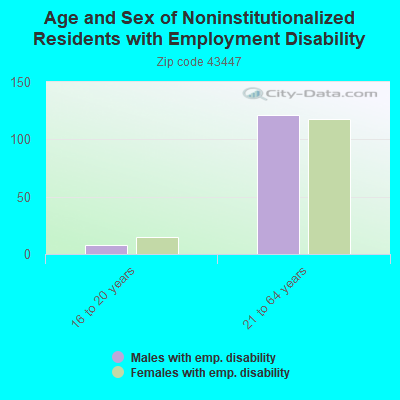
Males: 1,477
(47.1%)
Females: 1,657
(52.9%)
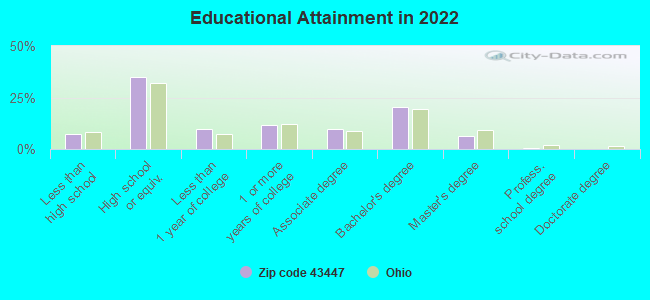
For population 25 years and over in 43447:
High school or higher: 92.7%
Bachelor's degree or higher: 27.2%
Graduate or professional degree: 6.8%
Unemployed: 2.6%
Mean travel time to work (commute): 24.4 minutes
For population 15 years and over in 43447:
Never married: 27.3%
Now married: 55.6%
Separated: 1.1%
Widowed: 4.8%
Divorced: 11.2%
Zip code 43447 compared to state average:
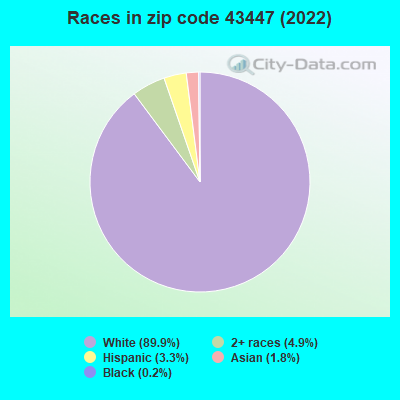
Black race population percentage significantly below state average.
Renting percentage below state average.
Length of stay since moving in significantly above state average.
Averages for the 2020 tax year for zip code 43447, filed in 2021:
Average Adjusted Gross Income (AGI) in 2020: $61,202 (Individual Income Tax Returns)
Here:
$61,202
State:
$67,288
Salary/wage: $52,407 (reported on 81.9% of returns)
Here:
$52,407
State:
$55,628
(% of AGI for various income ranges: 1174.7% for AGIs below $25k, 3187.6% for AGIs $25k-50k, 5668.8% for AGIs $50k-75k, 8586.0% for AGIs $75k-100k, 14426.7% for AGIs $100k-200k)
Taxable interest for individuals: $785 (reported on 29.7% of returns)
This zip code:
$785
Ohio:
$1,518
(% of AGI for various income ranges: 15.3% for AGIs below $25k, 20.0% for AGIs $25k-50k, 27.7% for AGIs $50k-75k, 26.0% for AGIs $75k-100k, 46.2% for AGIs $100k-200k)
Ordinary dividends: $2,109 (reported on 19.2% of returns)
Here:
$2,109
State:
$7,167
(% of AGI for various income ranges: 19.7% for AGIs below $25k, 31.9% for AGIs $25k-50k, 50.0% for AGIs $50k-75k, 72.0% for AGIs $75k-100k, 82.4% for AGIs $100k-200k)
Net capital gain/loss in AGI: +$3,400 (reported on 15.9% of returns)
Here:
+$3,400
State:
+$18,919
(% of AGI for various income ranges: 3.3% for AGIs below $25k, 6.8% for AGIs $25k-50k, 41.5% for AGIs $50k-75k, 89.3% for AGIs $75k-100k, 218.1% for AGIs $100k-200k)
Profit/loss from business: +$14,395 (reported on 10.4% of returns)
Here:
+$14,395
State:
+$13,744
(% of AGI for various income ranges: 51.4% for AGIs below $25k, 109.2% for AGIs $25k-50k, 244.6% for AGIs $50k-75k, 719.0% for AGIs $100k-200k)
Taxable individual retirement arrangement distribution: $20,218 (reported on 12.1% of returns)
43447:
$20,218
Ohio:
$18,876
(% of AGI for various income ranges: 60.8% for AGIs below $25k, 137.6% for AGIs $25k-50k, 275.0% for AGIs $50k-75k, 252.0% for AGIs $75k-100k, 1251.0% for AGIs $100k-200k)
Total itemized deductions: $28,717 (reported on 3.3% of returns)
Here:
$28,717
State:
$33,869
(% of AGI for various income ranges: 406.5% for AGIs $50k-75k, 317.1% for AGIs $100k-200k)
Charity contributions: $4,675 (reported on 2.2% of returns)
Here:
$4,675
State:
$14,577
(% of AGI for various income ranges: 124.7% for AGIs $75k-100k)
Taxes paid: $6,817 (reported on 3.3% of returns)
43447:
$6,817
State:
$7,681
(% of AGI for various income ranges: 78.1% for AGIs $50k-75k, 98.1% for AGIs $100k-200k)
Earned income credit: $2,132 (reported on 10.4% of returns)
Here:
$2,132
State:
$2,304
(% of AGI for various income ranges: 65.0% for AGIs below $25k, 46.2% for AGIs $25k-50k)
Percentage of individuals using paid preparers for their 2020 taxes: 93.4%
Here:
93%
State:
94%
(% for various income ranges: 91.8% for AGIs below $25k, 95.7% for AGIs $25k-50k, 97.0% for AGIs $50k-75k, 90.0% for AGIs $75k-100k, 93.3% for AGIs $100k-200k, 75.0% for AGIs over 200k)
Averages for the 2012 tax year for zip code 43447, filed in 2013:
Average Adjusted Gross Income (AGI) in 2012: $50,862 (Individual Income Tax Returns)
Here:
$50,862
State:
$54,926
Salary/wage: $45,426 (reported on 85.1% of returns)
Here:
$45,426
State:
$45,869
(% of AGI for various income ranges: 73.0% for AGIs below $25k, 76.8% for AGIs $25k-50k, 76.0% for AGIs $50k-75k, 80.6% for AGIs $75k-100k, 73.5% for AGIs $100k-200k)
Taxable interest for individuals: $667 (reported on 31.5% of returns)
This zip code:
$667
Ohio:
$1,297
(% of AGI for various income ranges: 1.1% for AGIs below $25k, 0.3% for AGIs $25k-50k, 0.5% for AGIs $50k-75k, 0.4% for AGIs $75k-100k, 0.3% for AGIs $100k-200k)
Ordinary dividends: $1,831 (reported on 19.3% of returns)
Here:
$1,831
State:
$5,821
(% of AGI for various income ranges: 1.3% for AGIs below $25k, 0.4% for AGIs $25k-50k, 0.6% for AGIs $50k-75k, 0.4% for AGIs $75k-100k, 1.0% for AGIs $100k-200k)
Net capital gain/loss in AGI: +$223 (reported on 12.2% of returns)
Here:
+$223
State:
+$11,232
(% of AGI for various income ranges: 0.1% for AGIs $50k-75k, 0.2% for AGIs $100k-200k)
Profit/loss from business: +$10,468 (reported on 10.5% of returns)
Here:
+$10,468
State:
+$12,773
(% of AGI for various income ranges: 5.4% for AGIs below $25k, 2.3% for AGIs $25k-50k, 0.7% for AGIs $50k-75k, 2.0% for AGIs $75k-100k, 2.5% for AGIs $100k-200k)
Taxable individual retirement arrangement distribution: $11,373 (reported on 12.2% of returns)
43447:
$11,373
Ohio:
$14,511
(% of AGI for various income ranges: 3.6% for AGIs below $25k, 2.6% for AGIs $25k-50k, 2.9% for AGIs $50k-75k, 2.8% for AGIs $75k-100k, 2.4% for AGIs $100k-200k)
Total itemized deductions: $16,624 (20% of AGI, reported on 34.3% of returns)
Here:
$16,624
State:
$21,278
Here:
20.3% of AGI
State:
18.8% of AGI
(% of AGI for various income ranges: 7.0% for AGIs below $25k, 9.3% for AGIs $25k-50k, 10.3% for AGIs $50k-75k, 12.5% for AGIs $75k-100k, 13.3% for AGIs $100k-200k)
Charity contributions: $2,227 (reported on 27.1% of returns)
Here:
$2,227
State:
$3,943
(% of AGI for various income ranges: 0.5% for AGIs below $25k, 1.0% for AGIs $25k-50k, 0.9% for AGIs $50k-75k, 1.1% for AGIs $75k-100k, 1.7% for AGIs $100k-200k)
Taxes paid: $6,529 (reported on 34.3% of returns)
43447:
$6,529
State:
$9,568
(% of AGI for various income ranges: 1.4% for AGIs below $25k, 2.6% for AGIs $25k-50k, 3.7% for AGIs $50k-75k, 4.8% for AGIs $75k-100k, 6.5% for AGIs $100k-200k)
Earned income credit: $1,943 (reported on 12.7% of returns)
Here:
$1,943
State:
$2,285
(% of AGI for various income ranges: 4.5% for AGIs below $25k, 0.6% for AGIs $25k-50k)
Percentage of individuals using paid preparers for their 2012 taxes: 54.1%
Here:
54%
State:
51%
(% for various income ranges: 47.5% for AGIs below $25k, 52.3% for AGIs $25k-50k, 62.9% for AGIs $50k-75k, 60.0% for AGIs $75k-100k, 57.1% for AGIs $100k-200k)
Averages for the 2004 tax year for zip code 43447, filed in 2005:
Average Adjusted Gross Income (AGI) in 2004: $43,229 (Individual Income Tax Returns)
Here:
$43,229
State:
$44,480
Salary/wage: $39,686 (reported on 87.1% of returns)
Here:
$39,686
State:
$39,198
(% of AGI for various income ranges: 105.3% for AGIs below $10k, 69.1% for AGIs $10k-25k, 80.5% for AGIs $25k-50k, 82.9% for AGIs $50k-75k, 89.3% for AGIs $75k-100k, 66.9% for AGIs over 100k)
Taxable interest for individuals: $949 (reported on 46.6% of returns)
This zip code:
$949
Ohio:
$1,532
(% of AGI for various income ranges: 4.0% for AGIs below $10k, 2.8% for AGIs $10k-25k, 1.5% for AGIs $25k-50k, 0.5% for AGIs $50k-75k, 0.4% for AGIs $75k-100k, 0.8% for AGIs over 100k)
Taxable dividends: $1,063 (reported on 23.1% of returns)
Here:
$1,063
State:
$3,496
(% of AGI for various income ranges: 2.1% for AGIs below $10k, 0.9% for AGIs $10k-25k, 0.6% for AGIs $25k-50k, 0.5% for AGIs $50k-75k, 0.2% for AGIs $75k-100k, 0.7% for AGIs over 100k)
Net capital gain/loss: +$3,603 (reported on 15.2% of returns)
Here:
+$3,603
State:
+$8,582
(% of AGI for various income ranges: -0.8% for AGIs below $10k, -0.4% for AGIs $10k-25k, 0.4% for AGIs $25k-50k, 1.3% for AGIs $50k-75k, 0.2% for AGIs $75k-100k, 4.7% for AGIs over 100k)
Profit/loss from business: +$10,136 (reported on 11.9% of returns)
Here:
+$10,136
State:
+$10,813
(% of AGI for various income ranges: -0.8% for AGIs below $10k, 4.0% for AGIs $10k-25k, 1.5% for AGIs $25k-50k, 3.0% for AGIs $50k-75k, 2.2% for AGIs $75k-100k, 4.8% for AGIs over 100k)
IRA payment deduction: $2,359 (reported on 2.2% of returns)
43447:
$2,359
Ohio:
$2,794
Total itemized deductions: $14,373 (21% of AGI, reported on 39.5% of returns)
Here:
$14,373
State:
$17,503
Here:
20.9% of AGI
State:
20.8% of AGI
(% of AGI for various income ranges: 6.9% for AGIs $10k-25k, 11.2% for AGIs $25k-50k, 14.9% for AGIs $50k-75k, 16.7% for AGIs $75k-100k, 13.3% for AGIs over 100k)
Charity contributions deductions: $1,772 (2% of AGI, reported on 33.0% of returns)
Here:
$1,772
State:
$3,087
Here:
2.4% of AGI
State:
3.4% of AGI
(% of AGI for various income ranges: 0.6% for AGIs $10k-25k, 1.2% for AGIs $25k-50k, 1.3% for AGIs $50k-75k, 1.8% for AGIs $75k-100k, 1.6% for AGIs over 100k)
Total tax: $5,150 (reported on 81.6% of returns)
43447:
$5,150
State:
$6,781
(% of AGI for various income ranges: 2.0% for AGIs below $10k, 4.4% for AGIs $10k-25k, 7.4% for AGIs $25k-50k, 9.3% for AGIs $50k-75k, 9.9% for AGIs $75k-100k, 16.5% for AGIs over 100k)
Earned income credit: $1,652 (reported on 9.0% of returns)
Here:
$1,652
State:
$1,696
Percentage of individuals using paid preparers for their 2004 taxes: 55.3%
Here:
55%
State:
55%
(% for various income ranges: 38.4% for AGIs below $10k, 55.2% for AGIs $10k-25k, 58.4% for AGIs $25k-50k, 65.1% for AGIs $50k-75k, 54.6% for AGIs $75k-100k, 56.5% for AGIs over 100k)
Household received Food Stamps/SNAP in the past 12 months: 138 Household did not receive Food Stamps/SNAP in the past 12 months: 1,062
Women who had a birth in the past 12 months: 55 (56 now married, 0 unmarried) Women who did not have a birth in the past 12 months: 704 (286 now married, 418 unmarried)
Housing units in zip code 43447 with a mortgage: 585 (69 second mortgage, 2 home equity loan, 68 both second mortgage and home equity loan) Houses without a mortgage: 14
Median monthly owner costs for units with a mortgage: $1,406 Median monthly owner costs for units without a mortgage: $568
Residents with income below the poverty level in 2022:
This zip code:
8.0%
Whole state:
13.4%
Residents with income below 50% of the poverty level in 2022:
This zip code:
4.6%
Whole state:
7.0%
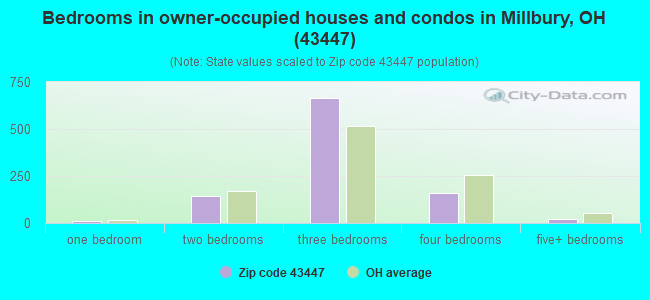
Median number of rooms in houses and condos:
Here:
6.7
State:
6.7
Median number of rooms in apartments:
Here:
4.4
State:
4.4
Notable locations in this zip code not listed on our city pages
Size of family households: 380 2-persons, 158 3-persons, 131 4-persons, 114 5-persons, 17 6-persons, 26 7-or-more-persons
Size of nonfamily households: 299 1-person, 42 2-persons, 26 3-persons
448 married couples with children.
77 single-parent households (18 men, 59 women).
93.7% of residents of 43447 zip code speak English at home.
3.6% of residents speak Spanish at home (37% very well, 36% well, 26% not at all).
2.2% of residents speak other Indo-European language at home (43% very well, 42% well, 15% not well).
0.4% of residents speak other language at home (42% very well, 58% not well).
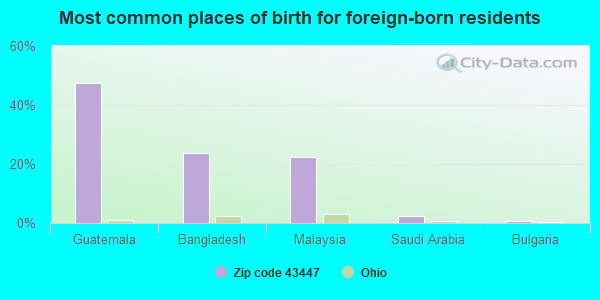
Foreign born population: 126 (4.0%) (42.4% of them are naturalized citizens)
This zip code:
4.0%
Whole state:
5.0%
48%Guatemala
24%Bangladesh
22%Malaysia
2%Saudi Arabia
1%Bulgaria
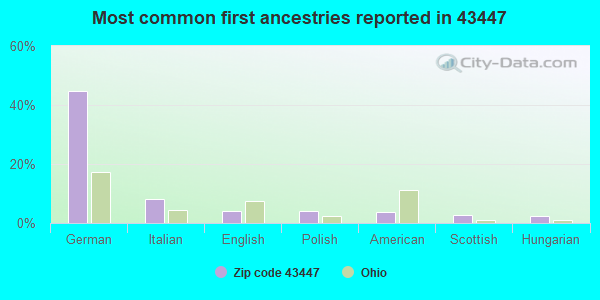
45%German
8%Italian
4%English
4%Polish
4%American
3%Scottish
2%Hungarian
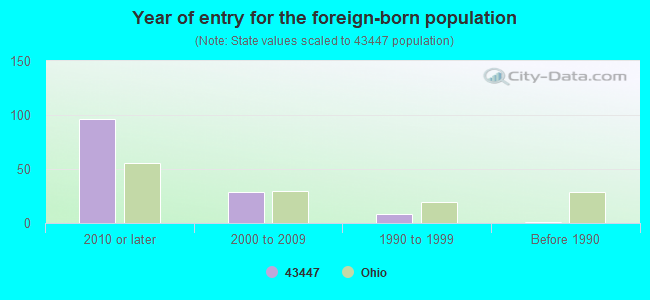
Year of entry for the foreign-born population
962010 or later
292000 to 2009
81990 to 1999
1Before 1990
Facilities with environmental interests located in this zip code:
BP AMOCO OIL CORP BULK PLANT MILLBURY (3140 MOLINE MARTIN RD in MILLBURY, OH)
AIR MINOR (AIRS/AFS) (Integrated Compliance Information System) - ICIS-05-1996-0567, FORMAL ENFORCEMENT ACTION STATE MASTER (Ohio general info) - PCS-OH0122637, National Pollutant Discharge Elimination System Permit, RCRA-OHD000727412, HAZARDOUS WASTE PROGRAM, AIR MAJOR, EPCRA National Pollutant Discharge Elimination System NON-MAJOR (Tracking pollutant discharge elimination systems) - permit Conditionally Exempt Small Quantity Generators, less than 100 kg/month of hazardous waste (Resource Conservation and Recovery Act (tracking hazardous waste)) - notification Business SIC classification: SPECIAL WAREHOUSING AND STORAGE; PETROLEUM BULK STATIONS AND TERMINALS; PETROLEUM AND PETROLEUM PRODUCTS WHOLESALERS, EXCEPT BULK STATIONS AND TERMINALS Organizations: BP OIL COMPANY (CONTACT/OWNER)
, BP EXPLORATION & OIL INC (CONTACT/OWNER)
, BP OIL COMPANY (CONTACT/OWNER)
Alternative names: BP OIL CO, BP OIL CO BULK PLT, BP OIL CO MILLBURY BULK PLANT, SOHIO OIL COMPANY MILLBURY BULK PLANT
AERO RESOURCES INC (3365 WALBRIDGE RD in MILLBURY, OH)
STATE MASTER (Ohio general info) - RCRA-OHD987029477, HAZARDOUS WASTE PROGRAM TRANSPORTER (Resource Conservation and Recovery Act (tracking hazardous waste)) Organizations: HAUN WILLIAM F (CONTACT/OWNER)
, WILLIAM F HAUN (CONTACT/OWNER)
B&J AUTO SERVICE (29071 CRAMER STREET in MILLBURY, OH)
Conditionally Exempt Small Quantity Generators, less than 100 kg/month of hazardous waste (Resource Conservation and Recovery Act (tracking hazardous waste)) Organizations: JOHN BASTUBEE (CONTACT/OWNER)
Housing units lacking complete plumbing facilities: 4.0% Housing units lacking complete kitchen facilities: 4.6%
64.6%Utility gas
20.6%Bottled, tank, or LP gas
11.0%Electricity
1.1%No fuel used
0.9%Fuel oil, kerosene, etc.
0.9%Wood
0.9%Other fuel
Population in 1990: 3,100. Population change in the 1990s: +329 (+10.6%).
Place of birth for U.S.-born residents:
This state: 2,650
Northeast: 15
Midwest: 213
South: 125
68% of the 43447 zip code residents lived in the same house 5 years ago. Out of people who lived in different houses, 41% lived in this county. Out of people who lived in different counties, 50% lived in Ohio.
97% of the 43447 zip code residents lived in the same house 1 year ago. Out of people who lived in different houses, 63% moved from this county. Out of people who lived in different houses, 36% moved from different county within same state. Out of people who lived in different houses, 14% moved from different state.
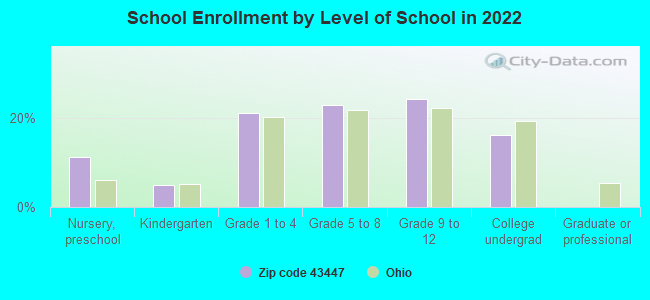
Private vs. public school enrollment:
Students in private schools in grades 1 to 8 (elementary and middle school): 27
Here:
9.3%
Ohio:
16.0%
Students in private schools in grades 9 to 12 (high school): 22
Here:
13.3%
Ohio:
13.1%
Students in private undergraduate colleges: 6
Here:
5.7%
Ohio:
22.3%
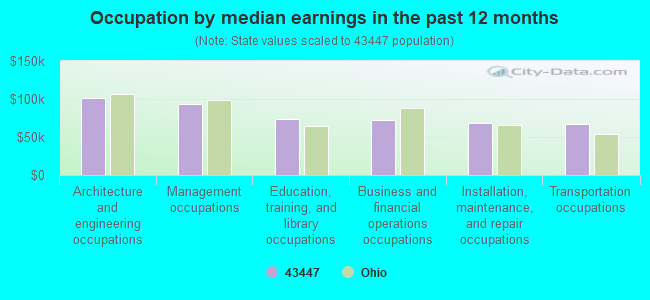
Occupation by median earnings in the past 12 months ($)
101,603Architecture and engineering occupations
93,829Management occupations
73,702Education, training, and library occupations
72,983Business and financial operations occupations
68,999Installation, maintenance, and repair occupations
66,735Transportation occupations
Companies with federal contracts located in this zip code:
ELECTRO PLASMA INC (4400 MARTIN-MOLINE RD in MILLBURY, OH; small business) : $1,634,830 in 6 contractsfrom 2003 to 2005
Contracts for Miscellaneous Electrical and Electronic Components, ADP Central Processing Unit (CPU, Computer), Analog, Optoelectronic Devices and Associated Hardware by Navy Signed by year:2000: $0; 2001: $0; 2002: $0; 2003: $121,492; 2004: $386,250; 2005: $1,127,088; 2006: $0.
Biggest contracts:
$682,796 with Navy for Miscellaneous Electrical and Electronic Components. Taking place in FL. Signed on 2005-09-23. Completion date: 2006-06-20.
$386,250 with Navy for Miscellaneous Electrical and Electronic Components. Signed on 2004-04-28. Completion date: 2005-04-28.
$231,200 with Navy for ADP Central Processing Unit (CPU, Computer), Analog. Signed on 2005-09-30. Completion date: 2006-04-27.
$213,092 with Navy for Optoelectronic Devices and Associated Hardware. Signed on 2005-07-21. Completion date: 2006-02-06.
B & B REPAIRS LTD (4400 MARTIN MOLINE RD STE in MILLBURY, OH; small business) : $54,680 in 3 contractsin 2005
$30,680 with Army for Installation of Equipment -- Ground Effect Vehicles, Motor Vehicles, Trailers, and Cycles. Signed on 2005-11-21. Completion date: 2005-05-10.
$13,557 with Army for Motor Vehicle Maintenance and Repair Shop Specialized Equipment. Signed on 2005-02-10. Completion date: 2005-05-10.
$10,443 with Army for Installation of Equipment -- Ground Effect Vehicles, Motor Vehicles, Trailers, and Cycles. Signed on 2005-03-07. Completion date: 2005-05-10.
Top industries in this zip code by the number of employees in 2005:
Construction: Plumbing, Heating, and Air-Conditioning Contractors (100-249 employees: 1 establishment)
Other Services (except Public Administration): General Automotive Repair (20-49: 1, 1-4: 2)
Construction: Commercial and Institutional Building Construction (20-49: 1, 1-4: 1)
Information: Newspaper Publishers (20-49: 1)
Fatal accident statistics in 2013:
Fatal accident count: 1
Vehicles involved in fatal accidents: 1
Fatal accidents caused by drunken drivers: 0
Fatalities: 1
Persons involved in fatal accidents: 1
Pedestrians involved in fatal accidents: 0
Fatal accident statistics in 2012:
Fatal accident count: 2
Vehicles involved in fatal accidents: 4
Fatal accidents caused by drunken drivers: 0
Fatalities: 2
Persons involved in fatal accidents: 7
Pedestrians involved in fatal accidents: 0
Home Mortgage Disclosure Act Aggregated Statistics For Year 2009 (Based on 8 partial tracts)
A) FHA, FSA/RHS & VA Home Purchase Loans
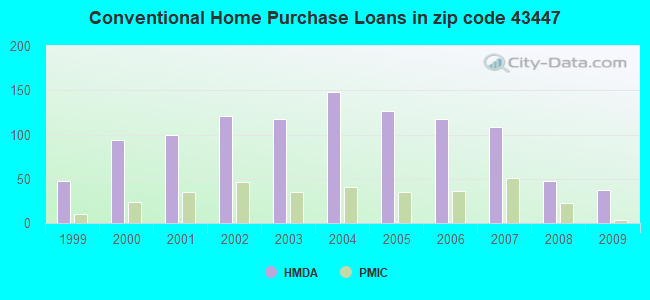
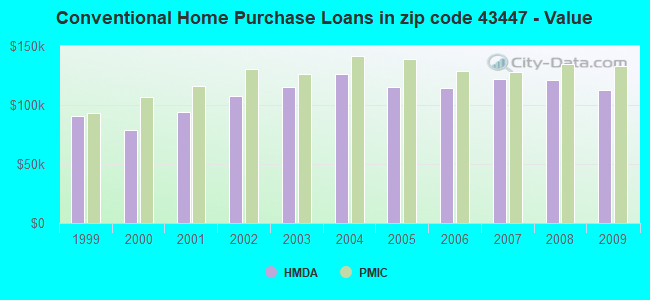
B) Conventional Home Purchase Loans
C) Refinancings
D) Home Improvement Loans
E) Loans on Dwellings For 5+ Families
F) Non-occupant Loans on < 5 Family Dwellings (A B C & D)
G) Loans On Manufactured Home Dwelling (A B C & D)
Number
Average Value
Number
Average Value
Number
Average Value
Number
Average Value
Number
Average Value
Number
Average Value
Number
Average Value
LOANS ORIGINATED
26
$119,601
37
$112,525
169
$128,908
8
$23,100
1
$117,180
4
$109,300
2
$40,110
APPLICATIONS APPROVED, NOT ACCEPTED
2
$173,915
1
$184,180
15
$149,893
1
$10,910
0
$0
0
$0
0
$0
APPLICATIONS DENIED
6
$131,858
2
$134,735
72
$133,259
13
$18,698
0
$0
3
$80,353
2
$26,135
APPLICATIONS WITHDRAWN
2
$149,955
6
$143,713
36
$149,450
1
$111,960
0
$0
2
$57,435
0
$0
FILES CLOSED FOR INCOMPLETENESS
0
$0
0
$0
8
$124,684
1
$207,020
0
$0
1
$96,870
0
$0
Aggregated Statistics For Year 2008 (Based on 8 partial tracts)
A) FHA, FSA/RHS & VA Home Purchase Loans
B) Conventional Home Purchase Loans
C) Refinancings
D) Home Improvement Loans
F) Non-occupant Loans on < 5 Family Dwellings (A B C & D)
G) Loans On Manufactured Home Dwelling (A B C & D)
Number
Average Value
Number
Average Value
Number
Average Value
Number
Average Value
Number
Average Value
Number
Average Value
LOANS ORIGINATED
25
$127,416
48
$120,769
77
$117,472
14
$36,816
8
$86,768
6
$55,000
APPLICATIONS APPROVED, NOT ACCEPTED
2
$63,555
5
$64,148
11
$125,856
5
$12,120
1
$102,630
3
$40,893
APPLICATIONS DENIED
6
$110,775
11
$108,338
77
$138,968
22
$42,068
3
$71,947
6
$41,965
APPLICATIONS WITHDRAWN
4
$125,210
5
$70,764
22
$134,234
3
$65,073
1
$56,170
1
$5,470
FILES CLOSED FOR INCOMPLETENESS
0
$0
0
$0
1
$92,780
1
$19,530
0
$0
0
$0
Aggregated Statistics For Year 2007 (Based on 8 partial tracts)
A) FHA, FSA/RHS & VA Home Purchase Loans
B) Conventional Home Purchase Loans
C) Refinancings
D) Home Improvement Loans
F) Non-occupant Loans on < 5 Family Dwellings (A B C & D)
G) Loans On Manufactured Home Dwelling (A B C & D)
Number
Average Value
Number
Average Value
Number
Average Value
Number
Average Value
Number
Average Value
Number
Average Value
LOANS ORIGINATED
6
$154,060
109
$121,635
121
$112,061
36
$35,230
8
$63,156
7
$51,703
APPLICATIONS APPROVED, NOT ACCEPTED
1
$49,220
14
$108,841
37
$130,315
6
$56,067
3
$66,357
2
$51,645
APPLICATIONS DENIED
2
$137,935
29
$110,696
129
$128,861
24
$61,093
5
$90,026
7
$48,139
APPLICATIONS WITHDRAWN
0
$0
13
$129,547
47
$136,470
4
$107,868
1
$72,650
0
$0
FILES CLOSED FOR INCOMPLETENESS
1
$194,050
2
$121,475
12
$148,688
0
$0
0
$0
0
$0
Aggregated Statistics For Year 2006 (Based on 8 partial tracts)
A) FHA, FSA/RHS & VA Home Purchase Loans
B) Conventional Home Purchase Loans
C) Refinancings
D) Home Improvement Loans
F) Non-occupant Loans on < 5 Family Dwellings (A B C & D)
G) Loans On Manufactured Home Dwelling (A B C & D)
Number
Average Value
Number
Average Value
Number
Average Value
Number
Average Value
Number
Average Value
Number
Average Value
LOANS ORIGINATED
6
$167,175
117
$114,698
146
$105,478
38
$31,635
13
$97,406
3
$62,600
APPLICATIONS APPROVED, NOT ACCEPTED
0
$0
15
$114,498
34
$112,094
4
$21,585
4
$129,065
0
$0
APPLICATIONS DENIED
2
$121,595
26
$121,402
130
$112,114
20
$37,760
5
$61,170
4
$77,792
APPLICATIONS WITHDRAWN
0
$0
15
$116,790
72
$119,622
7
$42,260
2
$44,435
1
$76,560
FILES CLOSED FOR INCOMPLETENESS
0
$0
4
$100,670
21
$133,873
1
$7,810
1
$53,900
0
$0
Aggregated Statistics For Year 2005 (Based on 8 partial tracts)
A) FHA, FSA/RHS & VA Home Purchase Loans
B) Conventional Home Purchase Loans
C) Refinancings
D) Home Improvement Loans
F) Non-occupant Loans on < 5 Family Dwellings (A B C & D)
G) Loans On Manufactured Home Dwelling (A B C & D)
Number
Average Value
Number
Average Value
Number
Average Value
Number
Average Value
Number
Average Value
Number
Average Value
LOANS ORIGINATED
4
$115,732
127
$114,900
215
$118,514
28
$31,818
15
$94,082
7
$33,761
APPLICATIONS APPROVED, NOT ACCEPTED
2
$32,810
13
$125,433
62
$131,717
4
$31,722
1
$62,620
6
$36,118
APPLICATIONS DENIED
2
$122,810
36
$88,838
160
$126,125
26
$38,897
2
$127,625
14
$46,684
APPLICATIONS WITHDRAWN
0
$0
16
$111,280
86
$131,824
9
$71,949
1
$36,950
3
$55,667
FILES CLOSED FOR INCOMPLETENESS
1
$98,430
3
$99,573
15
$127,650
1
$8,590
0
$0
0
$0
Aggregated Statistics For Year 2004 (Based on 8 partial tracts)
A) FHA, FSA/RHS & VA Home Purchase Loans
B) Conventional Home Purchase Loans
C) Refinancings
D) Home Improvement Loans
F) Non-occupant Loans on < 5 Family Dwellings (A B C & D)
G) Loans On Manufactured Home Dwelling (A B C & D)
Number
Average Value
Number
Average Value
Number
Average Value
Number
Average Value
Number
Average Value
Number
Average Value
LOANS ORIGINATED
7
$121,970
148
$126,411
208
$128,197
24
$50,165
14
$86,371
6
$25,743
APPLICATIONS APPROVED, NOT ACCEPTED
0
$0
16
$89,394
52
$132,104
6
$26,618
0
$0
6
$46,267
APPLICATIONS DENIED
2
$133,890
39
$111,941
137
$117,870
25
$38,403
0
$0
14
$26,115
APPLICATIONS WITHDRAWN
1
$138,790
18
$122,460
66
$119,518
9
$50,157
1
$39,060
1
$21,060
FILES CLOSED FOR INCOMPLETENESS
1
$130,660
8
$116,985
22
$138,882
1
$111,710
1
$99,340
0
$0
Aggregated Statistics For Year 2003 (Based on 6 partial tracts)
A) FHA, FSA/RHS & VA Home Purchase Loans
B) Conventional Home Purchase Loans
C) Refinancings
D) Home Improvement Loans
F) Non-occupant Loans on < 5 Family Dwellings (A B C & D)
Number
Average Value
Number
Average Value
Number
Average Value
Number
Average Value
Number
Average Value
LOANS ORIGINATED
9
$127,233
117
$114,950
342
$112,337
15
$21,968
12
$93,451
APPLICATIONS APPROVED, NOT ACCEPTED
2
$80,855
13
$105,436
58
$110,179
5
$12,136
2
$114,445
APPLICATIONS DENIED
1
$44,530
24
$89,062
121
$114,786
17
$29,104
6
$77,638
APPLICATIONS WITHDRAWN
1
$79,680
12
$117,248
69
$101,456
1
$15,520
4
$67,395
FILES CLOSED FOR INCOMPLETENESS
1
$44,530
1
$107,550
17
$120,388
1
$31,250
1
$39,060
Aggregated Statistics For Year 2002 (Based on 6 partial tracts)
A) FHA, FSA/RHS & VA Home Purchase Loans
B) Conventional Home Purchase Loans
C) Refinancings
D) Home Improvement Loans
E) Loans on Dwellings For 5+ Families
F) Non-occupant Loans on < 5 Family Dwellings (A B C & D)
Number
Average Value
Number
Average Value
Number
Average Value
Number
Average Value
Number
Average Value
Number
Average Value
LOANS ORIGINATED
11
$115,716
121
$107,350
300
$105,646
16
$16,191
1
$74,960
20
$96,606
APPLICATIONS APPROVED, NOT ACCEPTED
0
$0
11
$81,151
45
$113,704
8
$16,565
0
$0
4
$67,098
APPLICATIONS DENIED
0
$0
33
$47,815
92
$107,364
12
$12,105
0
$0
2
$132,140
APPLICATIONS WITHDRAWN
0
$0
9
$129,557
68
$110,047
2
$8,815
0
$0
0
$0
FILES CLOSED FOR INCOMPLETENESS
0
$0
1
$117,180
13
$121,575
0
$0
0
$0
1
$157,650
Aggregated Statistics For Year 2001 (Based on 6 partial tracts)
A) FHA, FSA/RHS & VA Home Purchase Loans
B) Conventional Home Purchase Loans
C) Refinancings
D) Home Improvement Loans
E) Loans on Dwellings For 5+ Families
F) Non-occupant Loans on < 5 Family Dwellings (A B C & D)
Number
Average Value
Number
Average Value
Number
Average Value
Number
Average Value
Number
Average Value
Number
Average Value
LOANS ORIGINATED
9
$108,439
100
$94,352
278
$104,785
24
$15,729
1
$105,730
20
$91,382
APPLICATIONS APPROVED, NOT ACCEPTED
2
$105,830
15
$47,005
45
$97,335
6
$24,980
1
$116,400
3
$78,703
APPLICATIONS DENIED
2
$60,530
33
$32,505
92
$98,817
17
$9,511
0
$0
4
$88,168
APPLICATIONS WITHDRAWN
1
$69,530
7
$103,681
53
$93,449
6
$16,482
0
$0
1
$75,000
FILES CLOSED FOR INCOMPLETENESS
1
$88,280
4
$79,982
12
$125,453
1
$26,560
0
$0
1
$42,970
Aggregated Statistics For Year 2000 (Based on 6 partial tracts)
A) FHA, FSA/RHS & VA Home Purchase Loans
B) Conventional Home Purchase Loans
C) Refinancings
D) Home Improvement Loans
F) Non-occupant Loans on < 5 Family Dwellings (A B C & D)
Number
Average Value
Number
Average Value
Number
Average Value
Number
Average Value
Number
Average Value
LOANS ORIGINATED
9
$103,131
94
$78,553
79
$83,615
26
$13,587
10
$52,099
APPLICATIONS APPROVED, NOT ACCEPTED
0
$0
18
$46,299
26
$67,360
4
$30,428
2
$11,325
APPLICATIONS DENIED
2
$57,420
59
$48,176
53
$119,040
25
$14,012
4
$101,050
APPLICATIONS WITHDRAWN
0
$0
5
$102,968
32
$85,372
7
$48,744
0
$0
FILES CLOSED FOR INCOMPLETENESS
0
$0
1
$46,670
8
$81,860
0
$0
0
$0
Aggregated Statistics For Year 1999 (Based on 3 partial tracts)
A) FHA, FSA/RHS & VA Home Purchase Loans
B) Conventional Home Purchase Loans
C) Refinancings
D) Home Improvement Loans
F) Non-occupant Loans on < 5 Family Dwellings (A B C & D)
2002 - 2018 National Fire Incident Reporting System (NFIRS) incidents
According to the data from the years 2002 - 2018 the average number of fire incidents per year is 13. The highest number of fire incidents - 29 took place in 2018, and the least - 3 in 2005. The data has an increasing trend.
When looking into fire subcategories, the most incidents belonged to: Structure Fires (61.7%), and Outside Fires (24.3%).
Fire incident types reported to NFIRS in Zip Code 43447


 Nearest zip codes: 43619, 43465, 43408, 43463, 43430, 43616.


 According to the data from the years 2002 - 2018 the average number of fire incidents per year is 13. The highest number of fire incidents - 29 took place in 2018, and the least - 3 in 2005. The data has an increasing trend.
 When looking into fire subcategories, the most incidents belonged to: Structure Fires (61.7%), and Outside Fires (24.3%).