Estimated zip code population in 2022: 2,683 Zip code population in 2010: 2,817 Zip code population in 2000: 2,725
Houses and condos: 1,778 Renter-occupied apartments: 122
% of renters here:
11%
State:
33%
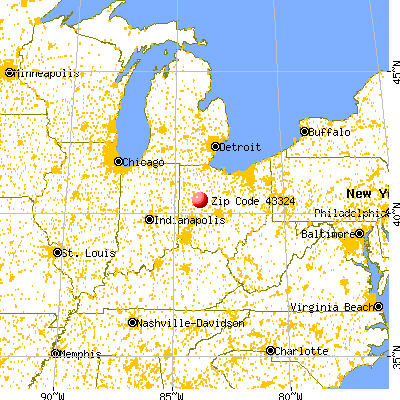
March 2022 cost of living index in zip code 43324: 83.5 (less than average, U.S. average is 100)
Land area: 28.4 sq. mi. Water area: 1.9 sq. mi.
Population density: 94 people per square mile
(very low).
OSM Map
General Map
Google Map
MSN Map
OSM Map
General Map
Google Map
MSN Map
OSM Map
General Map
Google Map
MSN Map
OSM Map
General Map
Google Map
MSN Map
Please wait while loading the map...
Real estate property taxes paid for housing units in 2022:
This zip code:
1.0% ($2,380)
Ohio:
1.3% ($2,639)
Median real estate property taxes paid for housing units with mortgages in 2022: $2,512 (1.0%) Median real estate property taxes paid for housing units with no mortgage in 2022: $2,110 (1.2%)
Business Search- 14 Million verified businesses
Males: 1,371
(51.1%)
Females: 1,311
(48.9%)
For population 25 years and over in 43324:
High school or higher: 93.7%
Bachelor's degree or higher: 30.6%
Graduate or professional degree: 12.2%
Unemployed: 1.3%
Mean travel time to work (commute): 21.9 minutes
For population 15 years and over in 43324:
Never married: 22.2%
Now married: 56.9%
Separated: 0.3%
Widowed: 2.0%
Divorced: 18.6%
Zip code 43324 compared to state average:
Unemployed percentage below state average.
Black race population percentage significantly below state average.
Hispanic race population percentage below state average.
Median age significantly above state average.
Foreign-born population percentage below state average.
Renting percentage significantly below state average.
Length of stay since moving in above state average.
Averages for the 2020 tax year for zip code 43324, filed in 2021:
Average Adjusted Gross Income (AGI) in 2020: $69,603 (Individual Income Tax Returns)
Here:
$69,603
State:
$67,288
Salary/wage: $56,726 (reported on 72.7% of returns)
Here:
$56,726
State:
$55,628
(% of AGI for various income ranges: 1125.0% for AGIs below $25k, 3390.0% for AGIs $25k-50k, 5740.0% for AGIs $50k-75k, 8123.6% for AGIs $75k-100k, 13310.7% for AGIs $100k-200k)
Taxable interest for individuals: $1,196 (reported on 38.0% of returns)
This zip code:
$1,196
Ohio:
$1,518
(% of AGI for various income ranges: 25.0% for AGIs below $25k, 34.5% for AGIs $25k-50k, 37.5% for AGIs $50k-75k, 119.3% for AGIs $75k-100k, 66.0% for AGIs $100k-200k)
Ordinary dividends: $5,378 (reported on 24.0% of returns)
Here:
$5,378
State:
$7,167
(% of AGI for various income ranges: 45.8% for AGIs below $25k, 39.5% for AGIs $25k-50k, 79.0% for AGIs $50k-75k, 170.7% for AGIs $75k-100k, 344.0% for AGIs $100k-200k)
Net capital gain/loss in AGI: +$15,750 (reported on 18.7% of returns)
Here:
+$15,750
State:
+$18,919
(% of AGI for various income ranges: 7.5% for AGIs below $25k, 59.5% for AGIs $25k-50k, 57.5% for AGIs $50k-75k, 116.4% for AGIs $75k-100k, 543.3% for AGIs $100k-200k)
Profit/loss from business: +$10,543 (reported on 15.3% of returns)
Here:
+$10,543
State:
+$13,744
(% of AGI for various income ranges: 100.0% for AGIs below $25k, 60.0% for AGIs $25k-50k, 171.0% for AGIs $50k-75k, 216.4% for AGIs $75k-100k, 938.7% for AGIs $100k-200k)
Taxable individual retirement arrangement distribution: $24,440 (reported on 16.7% of returns)
43324:
$24,440
Ohio:
$18,876
(% of AGI for various income ranges: 140.8% for AGIs below $25k, 223.2% for AGIs $25k-50k, 505.0% for AGIs $50k-75k, 766.4% for AGIs $75k-100k, 2132.0% for AGIs $100k-200k)
Total itemized deductions: $26,822 (reported on 6.0% of returns)
Here:
$26,822
State:
$33,869
(% of AGI for various income ranges: 580.0% for AGIs $50k-75k, 836.0% for AGIs $100k-200k)
Charity contributions: $8,683 (reported on 4.0% of returns)
Here:
$8,683
State:
$14,577
(% of AGI for various income ranges: 56.5% for AGIs $50k-75k, 272.0% for AGIs $100k-200k)
Taxes paid: $6,433 (reported on 6.0% of returns)
43324:
$6,433
State:
$7,681
(% of AGI for various income ranges: 114.0% for AGIs $50k-75k, 234.0% for AGIs $100k-200k)
Earned income credit: $1,930 (reported on 6.7% of returns)
Here:
$1,930
State:
$2,304
(% of AGI for various income ranges: 48.3% for AGIs below $25k, 35.0% for AGIs $25k-50k)
Percentage of individuals using paid preparers for their 2020 taxes: 95.3%
Here:
95%
State:
94%
(% for various income ranges: 92.5% for AGIs below $25k, 96.7% for AGIs $25k-50k, 96.6% for AGIs $50k-75k, 95.5% for AGIs $75k-100k, 95.8% for AGIs $100k-200k, 100.0% for AGIs over 200k)
Averages for the 2012 tax year for zip code 43324, filed in 2013:
Average Adjusted Gross Income (AGI) in 2012: $59,211 (Individual Income Tax Returns)
Here:
$59,211
State:
$54,926
Salary/wage: $46,139 (reported on 79.3% of returns)
Here:
$46,139
State:
$45,869
(% of AGI for various income ranges: 68.1% for AGIs below $25k, 67.2% for AGIs $25k-50k, 72.8% for AGIs $50k-75k, 67.0% for AGIs $75k-100k, 82.4% for AGIs $100k-200k)
Taxable interest for individuals: $1,820 (reported on 37.0% of returns)
This zip code:
$1,820
Ohio:
$1,297
(% of AGI for various income ranges: 1.8% for AGIs below $25k, 0.8% for AGIs $25k-50k, 1.4% for AGIs $50k-75k, 0.4% for AGIs $75k-100k, 1.1% for AGIs $100k-200k, 1.8% for AGIs over 200k)
Ordinary dividends: $3,303 (reported on 25.2% of returns)
Here:
$3,303
State:
$5,821
(% of AGI for various income ranges: 1.6% for AGIs below $25k, 1.2% for AGIs $25k-50k, 0.9% for AGIs $50k-75k, 1.4% for AGIs $75k-100k, 2.7% for AGIs $100k-200k)
Net capital gain/loss in AGI: +$7,517 (reported on 17.0% of returns)
Here:
+$7,517
State:
+$11,232
(% of AGI for various income ranges: 2.3% for AGIs $75k-100k, 6.6% for AGIs $100k-200k)
Profit/loss from business: +$6,950 (reported on 16.3% of returns)
Here:
+$6,950
State:
+$12,773
(% of AGI for various income ranges: 6.4% for AGIs below $25k, 2.9% for AGIs $25k-50k, 1.7% for AGIs $50k-75k, 2.3% for AGIs $75k-100k, 1.3% for AGIs $100k-200k)
Taxable individual retirement arrangement distribution: $15,083 (reported on 13.3% of returns)
43324:
$15,083
Ohio:
$14,511
(% of AGI for various income ranges: 6.9% for AGIs below $25k, 3.0% for AGIs $25k-50k, 3.3% for AGIs $50k-75k, 4.6% for AGIs $75k-100k, 4.0% for AGIs $100k-200k)
Total itemized deductions: $17,524 (17% of AGI, reported on 31.1% of returns)
Here:
$17,524
State:
$21,278
Here:
16.9% of AGI
State:
18.8% of AGI
(% of AGI for various income ranges: 9.7% for AGIs below $25k, 7.7% for AGIs $25k-50k, 8.4% for AGIs $50k-75k, 9.8% for AGIs $75k-100k, 10.8% for AGIs $100k-200k, 8.1% for AGIs over 200k)
Charity contributions: $2,790 (reported on 23.0% of returns)
Here:
$2,790
State:
$3,943
(% of AGI for various income ranges: 0.5% for AGIs below $25k, 0.8% for AGIs $25k-50k, 0.8% for AGIs $50k-75k, 1.5% for AGIs $75k-100k, 1.9% for AGIs $100k-200k)
Taxes paid: $7,576 (reported on 31.1% of returns)
43324:
$7,576
State:
$9,568
(% of AGI for various income ranges: 2.3% for AGIs below $25k, 2.2% for AGIs $25k-50k, 3.1% for AGIs $50k-75k, 3.5% for AGIs $75k-100k, 5.1% for AGIs $100k-200k, 6.0% for AGIs over 200k)
Earned income credit: $1,993 (reported on 10.4% of returns)
Here:
$1,993
State:
$2,285
(% of AGI for various income ranges: 3.7% for AGIs below $25k, 0.7% for AGIs $25k-50k)
Percentage of individuals using paid preparers for their 2012 taxes: 60.7%
Here:
61%
State:
51%
(% for various income ranges: 52.3% for AGIs below $25k, 63.6% for AGIs $25k-50k, 65.2% for AGIs $50k-75k, 64.7% for AGIs $75k-100k, 62.5% for AGIs $100k-200k, 100.0% for AGIs over 200k)
Averages for the 2004 tax year for zip code 43324, filed in 2005:
Average Adjusted Gross Income (AGI) in 2004: $55,164 (Individual Income Tax Returns)
Here:
$55,164
State:
$44,480
Salary/wage: $42,085 (reported on 83.8% of returns)
Here:
$42,085
State:
$39,198
(% of AGI for various income ranges: 82.4% for AGIs below $10k, 65.1% for AGIs $10k-25k, 75.1% for AGIs $25k-50k, 80.6% for AGIs $50k-75k, 77.3% for AGIs $75k-100k, 43.1% for AGIs over 100k)
Taxable interest for individuals: $1,840 (reported on 50.8% of returns)
This zip code:
$1,840
Ohio:
$1,532
(% of AGI for various income ranges: 5.1% for AGIs below $10k, 3.7% for AGIs $10k-25k, 1.4% for AGIs $25k-50k, 1.3% for AGIs $50k-75k, 0.9% for AGIs $75k-100k, 1.9% for AGIs over 100k)
Taxable dividends: $2,596 (reported on 26.5% of returns)
Here:
$2,596
State:
$3,496
(% of AGI for various income ranges: 3.6% for AGIs below $10k, 1.9% for AGIs $10k-25k, 0.8% for AGIs $25k-50k, 1.0% for AGIs $50k-75k, 0.9% for AGIs $75k-100k, 1.5% for AGIs over 100k)
Net capital gain/loss: +$8,344 (reported on 19.5% of returns)
Here:
+$8,344
State:
+$8,582
(% of AGI for various income ranges: 4.8% for AGIs below $10k, 0.1% for AGIs $10k-25k, 0.4% for AGIs $25k-50k, 0.3% for AGIs $50k-75k, 2.4% for AGIs $75k-100k, 6.3% for AGIs over 100k)
Profit/loss from business: +$13,276 (reported on 15.2% of returns)
Here:
+$13,276
State:
+$10,813
(% of AGI for various income ranges: 5.1% for AGIs below $10k, 5.3% for AGIs $10k-25k, 3.8% for AGIs $25k-50k, 2.7% for AGIs $50k-75k, 3.9% for AGIs $75k-100k, 3.7% for AGIs over 100k)
IRA payment deduction: $2,581 (reported on 2.2% of returns)
43324:
$2,581
Ohio:
$2,794
Total itemized deductions: $15,597 (16% of AGI, reported on 38.5% of returns)
Here:
$15,597
State:
$17,503
Here:
16.3% of AGI
State:
20.8% of AGI
(% of AGI for various income ranges: 18.1% for AGIs below $10k, 10.2% for AGIs $10k-25k, 9.9% for AGIs $25k-50k, 11.2% for AGIs $50k-75k, 13.5% for AGIs $75k-100k, 10.0% for AGIs over 100k)
Charity contributions deductions: $2,038 (2% of AGI, reported on 30.9% of returns)
Here:
$2,038
State:
$3,087
Here:
1.9% of AGI
State:
3.4% of AGI
(% of AGI for various income ranges: 1.2% for AGIs below $10k, 1.2% for AGIs $10k-25k, 0.7% for AGIs $25k-50k, 1.1% for AGIs $50k-75k, 1.5% for AGIs $75k-100k, 1.2% for AGIs over 100k)
Total tax: $7,213 (reported on 81.6% of returns)
43324:
$7,213
State:
$6,781
(% of AGI for various income ranges: 2.1% for AGIs below $10k, 4.7% for AGIs $10k-25k, 7.7% for AGIs $25k-50k, 9.9% for AGIs $50k-75k, 11.3% for AGIs $75k-100k, 13.5% for AGIs over 100k)
Earned income credit: $1,495 (reported on 7.3% of returns)
Here:
$1,495
State:
$1,696
Percentage of individuals using paid preparers for their 2004 taxes: 61.7%
Here:
62%
State:
55%
(% for various income ranges: 50.2% for AGIs below $10k, 61.5% for AGIs $10k-25k, 65.8% for AGIs $25k-50k, 64.1% for AGIs $50k-75k, 62.7% for AGIs $75k-100k, 65.3% for AGIs over 100k)
Household received Food Stamps/SNAP in the past 12 months: 71 Household did not receive Food Stamps/SNAP in the past 12 months: 1,075
Women who had a birth in the past 12 months: 25 (7 now married, 18 unmarried) Women who did not have a birth in the past 12 months: 480 (221 now married, 258 unmarried)
Housing units in zip code 43324 with a mortgage: 602 (62 second mortgage, 63 both second mortgage and home equity loan) Houses without a mortgage: 11
Median monthly owner costs for units with a mortgage: $1,262 Median monthly owner costs for units without a mortgage: $573
Residents with income below the poverty level in 2022:
This zip code:
11.2%
Whole state:
13.4%
Residents with income below 50% of the poverty level in 2022:
This zip code:
5.5%
Whole state:
7.0%
Median number of rooms in houses and condos:
Here:
6.1
State:
6.7
Median number of rooms in apartments:
Here:
5.5
State:
4.4
Notable locations in this zip code not listed on our city pages
252 married couples with children.
113 single-parent households (86 men, 27 women).
97.4% of residents of 43324 zip code speak English at home.
1.3% of residents speak Spanish at home (55% very well, 45% well).
0.7% of residents speak other Indo-European language at home (95% very well, 5% well).
0.8% of residents speak Asian or Pacific Island language at home (5% very well, 70% well, 25% not well).
Foreign born population: 75 (2.8%) (36.9% of them are naturalized citizens)
This zip code:
2.8%
Whole state:
5.0%
44%Honduras
15%Malaysia
12%Japan
9%Taiwan
7%Denmark
30%German
26%English
14%American
5%Irish
3%European
3%Polish
2%Scotch-Irish
Year of entry for the foreign-born population
112010 or later
102000 to 2009
81990 to 1999
40Before 1990
Facilities with environmental interests located in this zip code:
BEARD VE OIL CO INC * (6690 LIMA ST ST RTE 117 in HUNTSVILLE, OH)
STATE MASTER (Ohio general info) - RCRA-OHD986985547, HAZARDOUS WASTE PROGRAM Small Quantity Generators, between 100 kg and 1000 kg of hazardous waste/month (Resource Conservation and Recovery Act (tracking hazardous waste)) - notification Organizations: BEARD GENE (CONTACT/OWNER)
, UNKNOWN (CONTACT/OWNER)
Housing units lacking complete plumbing facilities: 2.2% Housing units lacking complete kitchen facilities: 0.9%
55.5%Utility gas
23.2%Electricity
16.4%Bottled, tank, or LP gas
3.9%Wood
1.2%Other fuel
Population in 1990: 1,953. Population change in the 1990s: +772 (+39.5%).
Place of birth for U.S.-born residents:
This state: 2,139
Northeast: 45
Midwest: 132
South: 269
West: 14
62% of the 43324 zip code residents lived in the same house 5 years ago. Out of people who lived in different houses, 61% lived in this county. Out of people who lived in different counties, 50% lived in Ohio.
96% of the 43324 zip code residents lived in the same house 1 year ago. Out of people who lived in different houses, 42% moved from this county. Out of people who lived in different houses, 49% moved from different county within same state. Out of people who lived in different houses, 1% moved from different state. Out of people who lived in different houses, 26% moved from abroad.
Private vs. public school enrollment:
Students in private schools in grades 1 to 8 (elementary and middle school):
Here:
0.0%
Ohio:
16.0%
Students in private schools in grades 9 to 12 (high school):
Here:
0.0%
Ohio:
13.1%
Students in private undergraduate colleges: 16
Here:
27.9%
Ohio:
22.3%
Occupation by median earnings in the past 12 months ($)
88,840Construction and extraction occupations
84,713Architecture and engineering occupations
69,099Management occupations
63,899Business and financial operations occupations
59,926Installation, maintenance, and repair occupations
56,787Material moving occupations
Top industries in this zip code by the number of employees in 2005:
Mining: Crushed and Broken Limestone Mining and Quarrying (20-49 employees: 1 establishment, 10-19 employees: 1 establishment)
Accommodation and Food Services: Full-Service Restaurants (10-19: 1, 5-9: 1)
Accommodation and Food Services: Limited-Service Restaurants (10-19: 1, 1-4: 2)
Wholesale Trade: Petroleum Bulk Stations and Terminals (10-19: 1)
Other Services (except Public Administration): Automotive Oil Change and Lubrication Shops (10-19: 1)
Health Care and Social Assistance: Other Individual and Family Services (10-19: 1)
Wholesale Trade: Other Miscellaneous Durable Goods Merchant Wholesalers (10-19: 1)
People in group quarters in 2000:
6 people in religious group quarters
Fatal accident statistics in 2012:
Fatal accident count: 1
Vehicles involved in fatal accidents: 2
Fatal accidents caused by drunken drivers: 0
Fatalities: 1
Persons involved in fatal accidents: 2
Pedestrians involved in fatal accidents: 0
Fatal accident statistics in 2010:
Fatal accident count: 2
Vehicles involved in fatal accidents: 3
Fatal accidents caused by drunken drivers: 0
Fatalities: 2
Persons involved in fatal accidents: 5
Pedestrians involved in fatal accidents: 0
2002 - 2018 National Fire Incident Reporting System (NFIRS) incidents
According to the data from the years 2002 - 2018 the average number of fire incidents per year is 18. The highest number of fire incidents - 31 took place in 2004, and the least - 6 in 2015. The data has a dropping trend.
When looking into fire subcategories, the most reports belonged to: Outside Fires (43.8%), and Structure Fires (41.1%).
Fire incident types reported to NFIRS in Zip Code 43324


 Nearest zip codes: 43348, 43310, 43311, 43333, 43331, 43347.


 According to the data from the years 2002 - 2018 the average number of fire incidents per year is 18. The highest number of fire incidents - 31 took place in 2004, and the least - 6 in 2015. The data has a dropping trend.
 When looking into fire subcategories, the most reports belonged to: Outside Fires (43.8%), and Structure Fires (41.1%).