Estimated zip code population in 2022: 6,404 Zip code population in 2010: 5,114 Zip code population in 2000: 4,378
Houses and condos: 2,502 Renter-occupied apartments: 400
% of renters here:
17%
State:
31%
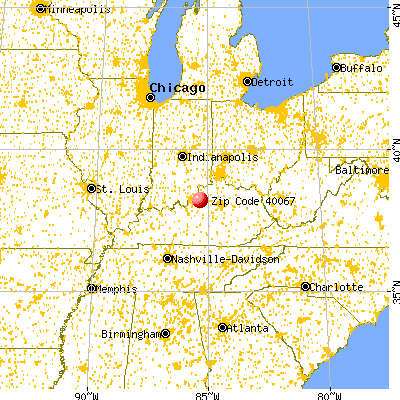
March 2022 cost of living index in zip code 40067: 82.7 (low, U.S. average is 100)
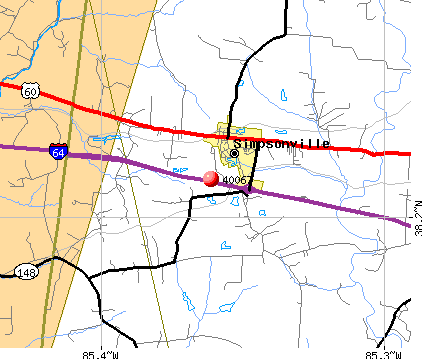
Land area: 43.1 sq. mi. Water area: 0.8 sq. mi.
Population density: 149 people per square mile
(very low).
OSM Map
General Map
Google Map
MSN Map
OSM Map
General Map
Google Map
MSN Map
OSM Map
General Map
Google Map
MSN Map
OSM Map
General Map
Google Map
MSN Map
Please wait while loading the map...
Real estate property taxes paid for housing units in 2022:
This zip code:
0.8% ($2,665)
Kentucky:
0.7% ($1,456)
Median real estate property taxes paid for housing units with mortgages in 2022: $2,595 (0.8%) Median real estate property taxes paid for housing units with no mortgage in 2022: $2,842 (0.8%)
Estimated median house/condo value in 2022: $333,599
40067:
$333,599
Kentucky:
$196,300
According to our research of Kentucky and other state lists, there were 4 registered sex offenders living in 40067 zip code as of June 29, 2024. The ratio of all residents to sex offenders in zip code 40067 is 1,361 to 1. The ratio of registered sex offenders to all residents in this zip code is much lower than the state average.
Median resident age:
This zip code:
37.9 years
Kentucky median age:
39.4 years
Average household size:
This zip code:
2.6 people
Kentucky:
2.4 people
Averages for the 2020 tax year for zip code 40067, filed in 2021:
Average Adjusted Gross Income (AGI) in 2020: $124,322 (Individual Income Tax Returns)
Here:
$124,322
State:
$61,342
Salary/wage: $83,569 (reported on 80.2% of returns)
Here:
$83,569
State:
$50,827
(% of AGI for various income ranges: 1127.2% for AGIs below $25k, 3596.4% for AGIs $25k-50k, 5990.7% for AGIs $50k-75k, 9858.1% for AGIs $75k-100k, 19018.5% for AGIs $100k-200k, 87312.2% for AGIs over 200k)
Taxable interest for individuals: $2,961 (reported on 38.4% of returns)
This zip code:
$2,961
Kentucky:
$1,441
(% of AGI for various income ranges: 23.7% for AGIs below $25k, 34.2% for AGIs $25k-50k, 61.1% for AGIs $50k-75k, 87.5% for AGIs $75k-100k, 145.6% for AGIs $100k-200k, 2363.3% for AGIs over 200k)
Ordinary dividends: $12,961 (reported on 26.9% of returns)
Here:
$12,961
State:
$7,388
(% of AGI for various income ranges: 49.3% for AGIs below $25k, 60.0% for AGIs $25k-50k, 203.7% for AGIs $50k-75k, 230.0% for AGIs $75k-100k, 487.8% for AGIs $100k-200k, 7410.0% for AGIs over 200k)
Net capital gain/loss in AGI: +$36,470 (reported on 23.9% of returns)
Here:
+$36,470
State:
+$19,475
(% of AGI for various income ranges: 4.4% for AGIs below $25k, 51.4% for AGIs $25k-50k, 111.1% for AGIs $50k-75k, 236.9% for AGIs $75k-100k, 864.4% for AGIs $100k-200k, 22360.0% for AGIs over 200k)
Profit/loss from business: +$20,975 (reported on 19.0% of returns)
Here:
+$20,975
State:
+$11,386
(% of AGI for various income ranges: 140.2% for AGIs below $25k, 285.3% for AGIs $25k-50k, 258.5% for AGIs $50k-75k, 683.1% for AGIs $75k-100k, 1014.8% for AGIs $100k-200k, 5040.0% for AGIs over 200k)
Taxable individual retirement arrangement distribution: $25,059 (reported on 11.9% of returns)
40067:
$25,059
Kentucky:
$18,941
(% of AGI for various income ranges: 69.8% for AGIs below $25k, 178.3% for AGIs $25k-50k, 208.1% for AGIs $50k-75k, 383.1% for AGIs $75k-100k, 1300.0% for AGIs $100k-200k, 2657.8% for AGIs over 200k)
Self-employed (Keogh) retirement plans: $31,900 (reported on 0.7% of returns)
40067:
$31,900
Kentucky:
$23,933
(% of AGI for various income ranges: 236.3% for AGIs $100k-200k)
Total itemized deductions: $37,342 (reported on 14.9% of returns)
Here:
$37,342
State:
$32,473
(% of AGI for various income ranges: 191.1% for AGIs $25k-50k, 298.5% for AGIs $50k-75k, 720.6% for AGIs $75k-100k, 1375.9% for AGIs $100k-200k, 9527.8% for AGIs over 200k)
Charity contributions: $15,646 (reported on 13.8% of returns)
Here:
$15,646
State:
$13,472
(% of AGI for various income ranges: 39.2% for AGIs $25k-50k, 74.1% for AGIs $50k-75k, 191.2% for AGIs $75k-100k, 374.8% for AGIs $100k-200k, 4588.9% for AGIs over 200k)
Taxes paid: $8,750 (reported on 14.9% of returns)
40067:
$8,750
State:
$7,830
(% of AGI for various income ranges: 34.7% for AGIs $25k-50k, 93.0% for AGIs $50k-75k, 211.9% for AGIs $75k-100k, 423.0% for AGIs $100k-200k, 1825.6% for AGIs over 200k)
Earned income credit: $2,268 (reported on 8.2% of returns)
Here:
$2,268
State:
$2,336
(% of AGI for various income ranges: 65.6% for AGIs below $25k, 60.3% for AGIs $25k-50k)
Percentage of individuals using paid preparers for their 2020 taxes: 91.4%
Here:
91%
State:
94%
(% for various income ranges: 89.7% for AGIs below $25k, 92.0% for AGIs $25k-50k, 89.5% for AGIs $50k-75k, 88.9% for AGIs $75k-100k, 92.6% for AGIs $100k-200k, 96.8% for AGIs over 200k)
Averages for the 2012 tax year for zip code 40067, filed in 2013:
Average Adjusted Gross Income (AGI) in 2012: $89,889 (Individual Income Tax Returns)
Here:
$89,889
State:
$50,814
Salary/wage: $62,781 (reported on 83.8% of returns)
Here:
$62,781
State:
$42,723
(% of AGI for various income ranges: 73.0% for AGIs below $25k, 77.4% for AGIs $25k-50k, 74.4% for AGIs $50k-75k, 79.1% for AGIs $75k-100k, 71.3% for AGIs $100k-200k, 40.4% for AGIs over 200k)
Taxable interest for individuals: $2,502 (reported on 39.0% of returns)
This zip code:
$2,502
Kentucky:
$1,381
(% of AGI for various income ranges: 2.1% for AGIs below $25k, 0.8% for AGIs $25k-50k, 0.5% for AGIs $50k-75k, 0.3% for AGIs $75k-100k, 1.0% for AGIs $100k-200k, 1.4% for AGIs over 200k)
Ordinary dividends: $8,402 (reported on 25.4% of returns)
Here:
$8,402
State:
$6,239
(% of AGI for various income ranges: 2.2% for AGIs below $25k, 1.5% for AGIs $25k-50k, 2.2% for AGIs $50k-75k, 1.0% for AGIs $75k-100k, 1.4% for AGIs $100k-200k, 3.3% for AGIs over 200k)
Net capital gain/loss in AGI: +$42,564 (reported on 19.3% of returns)
Here:
+$42,564
State:
+$11,336
(% of AGI for various income ranges: 0.2% for AGIs below $25k, 0.2% for AGIs $25k-50k, 1.4% for AGIs $50k-75k, 1.5% for AGIs $75k-100k, 2.3% for AGIs $100k-200k, 17.9% for AGIs over 200k)
Profit/loss from business: +$16,055 (reported on 19.3% of returns)
Here:
+$16,055
State:
+$10,862
(% of AGI for various income ranges: 7.4% for AGIs below $25k, 3.3% for AGIs $25k-50k, 2.9% for AGIs $50k-75k, 3.3% for AGIs $75k-100k, 4.3% for AGIs $100k-200k, 2.9% for AGIs over 200k)
Taxable individual retirement arrangement distribution: $18,296 (reported on 11.0% of returns)
40067:
$18,296
Kentucky:
$14,296
(% of AGI for various income ranges: 2.7% for AGIs below $25k, 2.2% for AGIs $25k-50k, 2.8% for AGIs $50k-75k, 2.4% for AGIs $75k-100k, 3.1% for AGIs $100k-200k, 1.7% for AGIs over 200k)
Self-employment retirement plans: $16,733 (reported on 1.3% of returns)
40067:
$16,733
Kentucky:
$20,768
Total itemized deductions: $32,468 (20% of AGI, reported on 46.1% of returns)
Here:
$32,468
State:
$21,160
Here:
20.5% of AGI
State:
20.0% of AGI
(% of AGI for various income ranges: 15.5% for AGIs below $25k, 11.8% for AGIs $25k-50k, 17.1% for AGIs $50k-75k, 17.4% for AGIs $75k-100k, 16.6% for AGIs $100k-200k, 17.3% for AGIs over 200k)
Charity contributions: $5,045 (reported on 39.9% of returns)
Here:
$5,045
State:
$4,303
(% of AGI for various income ranges: 1.1% for AGIs below $25k, 1.4% for AGIs $25k-50k, 2.2% for AGIs $50k-75k, 2.1% for AGIs $75k-100k, 2.4% for AGIs $100k-200k, 2.4% for AGIs over 200k)
Taxes paid: $12,516 (reported on 45.6% of returns)
40067:
$12,516
State:
$8,496
(% of AGI for various income ranges: 2.8% for AGIs below $25k, 3.4% for AGIs $25k-50k, 5.5% for AGIs $50k-75k, 6.9% for AGIs $75k-100k, 7.6% for AGIs $100k-200k, 6.7% for AGIs over 200k)
Earned income credit: $2,021 (reported on 12.3% of returns)
Here:
$2,021
State:
$2,273
(% of AGI for various income ranges: 4.8% for AGIs below $25k, 0.9% for AGIs $25k-50k)
Percentage of individuals using paid preparers for their 2012 taxes: 60.1%
Here:
60%
State:
60%
(% for various income ranges: 56.0% for AGIs below $25k, 58.7% for AGIs $25k-50k, 58.1% for AGIs $50k-75k, 62.5% for AGIs $75k-100k, 59.4% for AGIs $100k-200k, 80.0% for AGIs over 200k)
Averages for the 2004 tax year for zip code 40067, filed in 2005:
Average Adjusted Gross Income (AGI) in 2004: $75,364 (Individual Income Tax Returns)
Here:
$75,364
State:
$41,540
Salary/wage: $54,344 (reported on 86.3% of returns)
Here:
$54,344
State:
$36,432
(% of AGI for various income ranges: 75.8% for AGIs $10k-25k, 79.0% for AGIs $25k-50k, 82.7% for AGIs $50k-75k, 82.6% for AGIs $75k-100k, 48.2% for AGIs over 100k)
Taxable interest for individuals: $2,496 (reported on 51.5% of returns)
This zip code:
$2,496
Kentucky:
$1,571
(% of AGI for various income ranges: 3.3% for AGIs $10k-25k, 2.0% for AGIs $25k-50k, 1.0% for AGIs $50k-75k, 0.4% for AGIs $75k-100k, 1.8% for AGIs over 100k)
Taxable dividends: $6,511 (reported on 30.4% of returns)
Here:
$6,511
State:
$3,453
(% of AGI for various income ranges: 2.2% for AGIs $10k-25k, 1.1% for AGIs $25k-50k, 0.8% for AGIs $50k-75k, 0.8% for AGIs $75k-100k, 3.5% for AGIs over 100k)
Net capital gain/loss: +$39,729 (reported on 26.6% of returns)
Here:
+$39,729
State:
+$9,663
(% of AGI for various income ranges: 0.6% for AGIs $10k-25k, 1.1% for AGIs $25k-50k, 0.5% for AGIs $50k-75k, 0.9% for AGIs $75k-100k, 21.9% for AGIs over 100k)
Profit/loss from business: +$15,368 (reported on 17.6% of returns)
Here:
+$15,368
State:
+$9,233
(% of AGI for various income ranges: 4.8% for AGIs $10k-25k, 5.9% for AGIs $25k-50k, 2.8% for AGIs $50k-75k, 3.1% for AGIs $75k-100k, 3.1% for AGIs over 100k)
IRA payment deduction: $3,500 (reported on 3.3% of returns)
40067:
$3,500
Kentucky:
$2,955
(% of AGI for various income ranges: 0.3% for AGIs $25k-50k, 0.2% for AGIs $50k-75k, 0.3% for AGIs $75k-100k, 0.1% for AGIs over 100k)
Self-employed pension: $14,741 (reported on 1.4% of returns)
Here:
$14,741
Kentucky:
$14,996
Total itemized deductions: $25,252 (20% of AGI, reported on 49.9% of returns)
Here:
$25,252
State:
$17,474
Here:
19.8% of AGI
State:
21.0% of AGI
(% of AGI for various income ranges: 10.9% for AGIs $10k-25k, 15.2% for AGIs $25k-50k, 19.7% for AGIs $50k-75k, 20.3% for AGIs $75k-100k, 15.6% for AGIs over 100k)
Charity contributions deductions: $4,235 (3% of AGI, reported on 45.0% of returns)
Here:
$4,235
State:
$3,494
Here:
3.3% of AGI
State:
4.0% of AGI
(% of AGI for various income ranges: 0.8% for AGIs $10k-25k, 2.1% for AGIs $25k-50k, 2.4% for AGIs $50k-75k, 2.5% for AGIs $75k-100k, 2.7% for AGIs over 100k)
Total tax: $13,666 (reported on 79.7% of returns)
40067:
$13,666
State:
$6,162
(% of AGI for various income ranges: 4.5% for AGIs $10k-25k, 6.8% for AGIs $25k-50k, 8.7% for AGIs $50k-75k, 9.7% for AGIs $75k-100k, 18.2% for AGIs over 100k)
Earned income credit: $1,543 (reported on 9.7% of returns)
Here:
$1,543
State:
$1,723
Percentage of individuals using paid preparers for their 2004 taxes: 63.7%
Here:
64%
State:
66%
(% for various income ranges: 59.0% for AGIs below $10k, 63.1% for AGIs $10k-25k, 66.8% for AGIs $25k-50k, 62.0% for AGIs $50k-75k, 61.8% for AGIs $75k-100k, 68.7% for AGIs over 100k)
Household received Food Stamps/SNAP in the past 12 months: 63 Household did not receive Food Stamps/SNAP in the past 12 months: 2,324
Women who had a birth in the past 12 months: 65 (64 now married, 0 unmarried) Women who did not have a birth in the past 12 months: 1,258 (761 now married, 501 unmarried)
Housing units in zip code 40067 with a mortgage: 1,358 (130 second mortgage, 4 home equity loan, 106 both second mortgage and home equity loan) Houses without a mortgage: 40
Median monthly owner costs for units with a mortgage: $1,712 Median monthly owner costs for units without a mortgage: $606
Residents with income below the poverty level in 2022:
This zip code:
6.8%
Whole state:
16.5%
Residents with income below 50% of the poverty level in 2022:
This zip code:
1.5%
Whole state:
9.0%
Median number of rooms in houses and condos:
Here:
7.0
State:
6.4
Median number of rooms in apartments:
Here:
5.1
State:
4.4
Notable locations in this zip code not listed on our city pages
In group quarters: 233 (-1 institutionalized population)
Size of family households: 706 2-persons, 658 3-persons, 222 4-persons, 130 5-persons, 39 6-persons, 30 7-or-more-persons
Size of nonfamily households: 534 1-person, 60 2-persons, 9 3-persons
1,155 married couples with children.
151 single-parent households (8 men, 143 women).
93.6% of residents of 40067 zip code speak English at home.
5.2% of residents speak Spanish at home (62% very well, 22% well, 16% not well).
0.5% of residents speak other Indo-European language at home (80% very well, 20% not well).
0.2% of residents speak Asian or Pacific Island language at home (100% not well).
0.3% of residents speak other language at home (14% well, 86% not well).
Foreign born population: 249 (3.9%) (25.3% of them are naturalized citizens)
This zip code:
3.9%
Whole state:
4.0%
45%Honduras
11%El Salvador
6%Cameroon
5%Malaysia
4%Peru
3%Bhutan
3%Haiti
19%American
16%English
15%German
8%Irish
6%European
3%Scottish
2%Italian
Year of entry for the foreign-born population
1302010 or later
302000 to 2009
661990 to 1999
68Before 1990
Facilities with environmental interests located in this zip code:
LEGGETT AND PLATT INCORPORATED (211 MAIN STREET in SIMPSONVILLE, KY)
AIR MAJOR (AIRS/AFS) (Integrated Compliance Information System) - ICIS-04-2000-0896, FORMAL ENFORCEMENT ACTION COMPLIANCE ACTIVITY (Tracking inspections of insecticide, fungicide, and rodenticide, and toxic substances) CRITERIA AND HAZARDOUS AIR POLLUTANT INVENTORY (Inventory of air pollution sources) National Pollutant Discharge Elimination System NON-MAJOR (Tracking pollutant discharge elimination systems) - permit (Resource Conservation and Recovery Act (tracking hazardous waste)) TRI REPORTER (Tracking of toxic chemicals releasing facilities) Business SIC classification: METAL HOUSEHOLD FURNITURE; HARDWARE Business NAICS classification: METAL HOUSEHOLD FURNITURE MANUFACTURING.; METAL HOUSEHOLD FURNITURE MANUFACTURING. Organizations: LEGGETT & PLATT SIMPSONVILLE (CONTACT/OWNER)
, LEGGETT & PLATT INCORPORATED (CONTACT/OWNER)
Alternative names: LEGGETT & PLATT SIMPSONVILLE, LEGGETT PARTNERS L P, LEGGETT PARTNERS LP
CARDINAL TOWNHOMES/OAKS GARDEN (CHAMPIONS WAY in SIMPSONVILLE, KY)
National Pollutant Discharge Elimination System NON-MAJOR (Tracking pollutant discharge elimination systems) - permit Business SIC classification: MANAGEMENT SERVICES
PILOT TRAVEL CENTER #354 (819 BUCK CREEK RD in SIMPSONVILLE, KY)
National Pollutant Discharge Elimination System NON-MAJOR (Tracking pollutant discharge elimination systems) - permit Business SIC classification: GASOLINE SERVICE STATIONS
KINGBROOK COMMERCE PARK SECT 1 (HWY 1848 VEECHDALE RD BETWEEN in SIMPSONVILLE, KY)
National Pollutant Discharge Elimination System NON-MAJOR (Tracking pollutant discharge elimination systems) - permit Business SIC classification: HIGHWAY AND STREET CONSTRUCTION, EXCEPT ELEVATED HIGHWAYS
Housing units lacking complete plumbing facilities: 0.3% Housing units lacking complete kitchen facilities: 0.7%
45.1%Utility gas
31.7%Electricity
18.3%Bottled, tank, or LP gas
3.8%Wood
Population in 1990: 2,443. Population change in the 1990s: +1,935 (+79.2%).
Place of birth for U.S.-born residents:
This state: 3,938
Northeast: 291
Midwest: 883
South: 594
West: 449
54% of the 40067 zip code residents lived in the same house 5 years ago. Out of people who lived in different houses, 26% lived in this county. Out of people who lived in different counties, 50% lived in Kentucky.
95% of the 40067 zip code residents lived in the same house 1 year ago. Out of people who lived in different houses, 9% moved from this county. Out of people who lived in different houses, 30% moved from different county within same state. Out of people who lived in different houses, 66% moved from different state. Out of people who lived in different houses, 7% moved from abroad.
Private vs. public school enrollment:
Students in private schools in grades 1 to 8 (elementary and middle school): 200
Here:
31.8%
Kentucky:
17.2%
Students in private schools in grades 9 to 12 (high school): 145
Here:
39.9%
Kentucky:
15.2%
Students in private undergraduate colleges: 38
Here:
24.1%
Kentucky:
19.6%
Occupation by median earnings in the past 12 months ($)
119,045Computer and mathematical occupations
115,361Architecture and engineering occupations
110,017Life, physical, and social science occupations
75,744Health diagnosing and treating practitioners and other technical occupations
68,370Business and financial operations occupations
62,156Management occupations
Companies with federal contracts located in this zip code:
F B PURNELL SAUSAGE CO , INC (6931 SHELBYVILLE RD in SIMPSONVILLE, KY; small business) : $67,633 in 5 contractsfrom 2004 to 2005
Contracts for Food Items For Resale by Defense Commissary Agency Signed by year:2000: $0; 2001: $0; 2002: $0; 2003: $0; 2004: $27,460; 2005: $40,173; 2006: $0.
Biggest contracts:
$27,329 with Defense Commissary Agency for Food Items For Resale. Signed on 2005-04-01. Completion date: 2005-08-31.
$13,730, same as above.Signed on 2004-10-01. Completion date: 2005-02-28.
$13,730, same as above.Signed on 2004-10-01. Completion date: 2005-02-28.
$7,126, same as above.Signed on 2005-09-01. Completion date: 2005-09-30.
AERO FORCE BALLOONS, LLC (963 POUNDS RD in SIMPSONVILLE, KY; small business)
$11,950 with Army for Signs, Advertising Displays, and Identification Plates. Signed on 2006-05-10. Completion date: 2006-06-01.
CENTAURUS TECHNOLOGY INC (MIKE GROLMES in SIMPSONVILLE, KY; small business) : $5,654 in 2 contractsin 2003
$2,828 with Office of the Assistant Secretary for Administration and Management for . Taking place in IL. Signed on 2003-10-28. Effective on 2003-11-03. Completion date: 2003-11-07.
$2,826, same as above.Signed on 2003-11-04. Effective on 2003-11-18. Completion date: 2003-11-21.
Top industries in this zip code by the number of employees in 2005:
Health Care and Social Assistance: Vocational Rehabilitation Services (50-99 employees: 1 establishment, 1-4 employees: 1 establishment)
Wholesale Trade: Industrial and Personal Service Paper Merchant Wholesalers (50-99: 1)
Arts, Entertainment, and Recreation: Golf Courses and Country Clubs (50-99: 1)
Detailed PMIC statistics for the following Tracts:0405.00
2002 - 2018 National Fire Incident Reporting System (NFIRS) incidents
Based on the data from the years 2002 - 2018 the average number of fires per year is 37. The highest number of fire incidents - 69 took place in 2006, and the least - 18 in 2013. The data has a growing trend.
When looking into fire subcategories, the most incidents belonged to: Outside Fires (41.4%), and Structure Fires (29.0%).
Fire incident types reported to NFIRS in Zip Code 40067


 Nearest zip codes: 40022, 40023, 40245, 40014, 40056, 40065.


 Based on the data from the years 2002 - 2018 the average number of fires per year is 37. The highest number of fire incidents - 69 took place in 2006, and the least - 18 in 2013. The data has a growing trend.
 When looking into fire subcategories, the most incidents belonged to: Outside Fires (41.4%), and Structure Fires (29.0%).