Estimated zip code population in 2022: 2,776 Zip code population in 2010: 2,864 Zip code population in 2000: 2,644
Houses and condos: 1,229 Renter-occupied apartments: 101
% of renters here:
9%
State:
31%
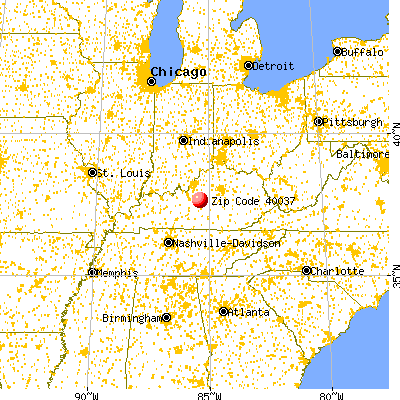
March 2022 cost of living index in zip code 40037: 82.0 (low, U.S. average is 100)
Land area: 49.1 sq. mi. Water area: 0.6 sq. mi.
Population density: 57 people per square mile
(very low).
OSM Map
General Map
Google Map
MSN Map
OSM Map
General Map
Google Map
MSN Map
OSM Map
General Map
Google Map
MSN Map
OSM Map
General Map
Google Map
MSN Map
Please wait while loading the map...
Real estate property taxes paid for housing units in 2022:
This zip code:
0.5% ($951)
Kentucky:
0.7% ($1,456)
Median real estate property taxes paid for housing units with mortgages in 2022: $1,254 (0.6%) Median real estate property taxes paid for housing units with no mortgage in 2022: $687 (0.4%)
Estimated median house/condo value in 2022: $203,952
40037:
$203,952
Kentucky:
$196,300
According to our research of Kentucky and other state lists, there were 3 registered sex offenders living in 40037 zip code as of July 06, 2024. The ratio of all residents to sex offenders in zip code 40037 is 903 to 1. The ratio of registered sex offenders to all residents in this zip code is lower than the state average.
Median resident age:
This zip code:
38.0 years
Kentucky median age:
39.4 years
Average household size:
This zip code:
2.4 people
Kentucky:
2.4 people
Averages for the 2020 tax year for zip code 40037, filed in 2021:
Average Adjusted Gross Income (AGI) in 2020: $51,759 (Individual Income Tax Returns)
Here:
$51,759
State:
$61,342
Salary/wage: $48,139 (reported on 85.0% of returns)
Here:
$48,139
State:
$50,827
(% of AGI for various income ranges: 1211.5% for AGIs below $25k, 3613.8% for AGIs $25k-50k, 6284.3% for AGIs $50k-75k, 9198.3% for AGIs $75k-100k, 15029.1% for AGIs $100k-200k)
Taxable interest for individuals: $1,077 (reported on 22.6% of returns)
This zip code:
$1,077
Kentucky:
$1,441
(% of AGI for various income ranges: 26.2% for AGIs below $25k, 25.9% for AGIs $25k-50k, 23.3% for AGIs $50k-75k, 60.8% for AGIs $75k-100k, 52.7% for AGIs $100k-200k)
Ordinary dividends: $1,675 (reported on 9.0% of returns)
Here:
$1,675
State:
$7,388
(% of AGI for various income ranges: 19.3% for AGIs $25k-50k, 7.1% for AGIs $50k-75k, 118.2% for AGIs $100k-200k)
Net capital gain/loss in AGI: +$10,486 (reported on 10.5% of returns)
Here:
+$10,486
State:
+$19,475
(% of AGI for various income ranges: 19.3% for AGIs $25k-50k, 54.3% for AGIs $50k-75k, 371.7% for AGIs $75k-100k, 774.5% for AGIs $100k-200k)
Profit/loss from business: +$3,977 (reported on 9.8% of returns)
Here:
+$3,977
State:
+$11,386
(% of AGI for various income ranges: 73.8% for AGIs below $25k, 43.8% for AGIs $25k-50k, 32.9% for AGIs $50k-75k, 117.3% for AGIs $100k-200k)
Taxable individual retirement arrangement distribution: $10,190 (reported on 7.5% of returns)
40037:
$10,190
Kentucky:
$18,941
(% of AGI for various income ranges: 66.2% for AGIs below $25k, 153.1% for AGIs $25k-50k, 335.8% for AGIs $75k-100k)
Total itemized deductions: $22,000 (reported on 1.5% of returns)
Here:
$22,000
State:
$32,473
(% of AGI for various income ranges: 209.5% for AGIs $50k-75k)
Taxes paid: $6,100 (reported on 1.5% of returns)
40037:
$6,100
State:
$7,830
(% of AGI for various income ranges: 58.1% for AGIs $50k-75k)
Earned income credit: $2,138 (reported on 15.8% of returns)
Here:
$2,138
State:
$2,336
(% of AGI for various income ranges: 89.2% for AGIs below $25k, 74.8% for AGIs $25k-50k)
Percentage of individuals using paid preparers for their 2020 taxes: 95.5%
Here:
95%
State:
94%
(% for various income ranges: 95.0% for AGIs below $25k, 94.4% for AGIs $25k-50k, 96.0% for AGIs $50k-75k, 100.0% for AGIs $75k-100k, 93.8% for AGIs $100k-200k)
Averages for the 2012 tax year for zip code 40037, filed in 2013:
Average Adjusted Gross Income (AGI) in 2012: $39,255 (Individual Income Tax Returns)
Here:
$39,255
State:
$50,814
Salary/wage: $36,245 (reported on 86.8% of returns)
Here:
$36,245
State:
$42,723
(% of AGI for various income ranges: 74.3% for AGIs below $25k, 84.2% for AGIs $25k-50k, 84.3% for AGIs $50k-75k, 82.6% for AGIs $75k-100k, 65.3% for AGIs $100k-200k)
Taxable interest for individuals: $1,263 (reported on 28.9% of returns)
This zip code:
$1,263
Kentucky:
$1,381
(% of AGI for various income ranges: 2.2% for AGIs below $25k, 0.6% for AGIs $25k-50k, 0.6% for AGIs $50k-75k, 1.1% for AGIs $75k-100k, 0.4% for AGIs $100k-200k)
Ordinary dividends: $1,940 (reported on 12.4% of returns)
Here:
$1,940
State:
$6,239
(% of AGI for various income ranges: 1.2% for AGIs below $25k, 0.4% for AGIs $25k-50k, 0.1% for AGIs $50k-75k, 1.5% for AGIs $75k-100k)
Net capital gain/loss in AGI: +$2,012 (reported on 14.0% of returns)
Here:
+$2,012
State:
+$11,336
(% of AGI for various income ranges: 0.5% for AGIs $25k-50k, 1.4% for AGIs $50k-75k, 1.4% for AGIs $75k-100k)
Profit/loss from business: +$5,719 (reported on 13.2% of returns)
Here:
+$5,719
State:
+$10,862
(% of AGI for various income ranges: 8.2% for AGIs below $25k, 1.7% for AGIs $25k-50k, 0.9% for AGIs $50k-75k, 0.6% for AGIs $75k-100k)
Taxable individual retirement arrangement distribution: $9,836 (reported on 9.1% of returns)
40037:
$9,836
Kentucky:
$14,296
(% of AGI for various income ranges: 2.7% for AGIs below $25k, 2.4% for AGIs $25k-50k, 1.9% for AGIs $50k-75k, 3.8% for AGIs $75k-100k)
Total itemized deductions: $15,336 (23% of AGI, reported on 18.2% of returns)
Here:
$15,336
State:
$21,160
Here:
22.9% of AGI
State:
20.0% of AGI
(% of AGI for various income ranges: 3.4% for AGIs below $25k, 4.6% for AGIs $25k-50k, 8.3% for AGIs $50k-75k, 8.9% for AGIs $75k-100k, 11.2% for AGIs $100k-200k)
Charity contributions: $1,800 (reported on 13.2% of returns)
Here:
$1,800
State:
$4,303
(% of AGI for various income ranges: 0.6% for AGIs $25k-50k, 0.5% for AGIs $50k-75k, 0.9% for AGIs $75k-100k, 1.1% for AGIs $100k-200k)
Taxes paid: $5,218 (reported on 18.2% of returns)
40037:
$5,218
State:
$8,496
(% of AGI for various income ranges: 1.7% for AGIs $25k-50k, 2.5% for AGIs $50k-75k, 3.6% for AGIs $75k-100k, 4.5% for AGIs $100k-200k)
Earned income credit: $2,421 (reported on 23.1% of returns)
Here:
$2,421
State:
$2,273
(% of AGI for various income ranges: 8.1% for AGIs below $25k, 1.1% for AGIs $25k-50k)
Percentage of individuals using paid preparers for their 2012 taxes: 75.2%
Here:
75%
State:
60%
(% for various income ranges: 70.0% for AGIs below $25k, 74.3% for AGIs $25k-50k, 85.0% for AGIs $50k-75k, 81.8% for AGIs $75k-100k, 80.0% for AGIs $100k-200k)
Averages for the 2004 tax year for zip code 40037, filed in 2005:
Average Adjusted Gross Income (AGI) in 2004: $31,646 (Individual Income Tax Returns)
Here:
$31,646
State:
$41,540
Salary/wage: $29,867 (reported on 86.8% of returns)
Here:
$29,867
State:
$36,432
(% of AGI for various income ranges: 87.6% for AGIs below $10k, 81.3% for AGIs $10k-25k, 87.8% for AGIs $25k-50k, 88.7% for AGIs $50k-75k, 80.1% for AGIs $75k-100k, 37.7% for AGIs over 100k)
Taxable interest for individuals: $1,372 (reported on 41.8% of returns)
This zip code:
$1,372
Kentucky:
$1,571
(% of AGI for various income ranges: 4.7% for AGIs below $10k, 4.5% for AGIs $10k-25k, 1.5% for AGIs $25k-50k, 1.4% for AGIs $50k-75k, 0.3% for AGIs $75k-100k, 1.2% for AGIs over 100k)
Taxable dividends: $877 (reported on 14.4% of returns)
Here:
$877
State:
$3,453
(% of AGI for various income ranges: 2.5% for AGIs below $10k, 0.7% for AGIs $10k-25k, 0.4% for AGIs $25k-50k, 0.0% for AGIs $50k-75k, 0.6% for AGIs $75k-100k)
Net capital gain/loss: +$4,623 (reported on 13.0% of returns)
Here:
+$4,623
State:
+$9,663
(% of AGI for various income ranges: 0.6% for AGIs below $10k, 0.2% for AGIs $10k-25k, 1.6% for AGIs $25k-50k, 1.0% for AGIs $50k-75k, 1.4% for AGIs $75k-100k, 9.4% for AGIs over 100k)
Profit/loss from business: +$3,297 (reported on 13.9% of returns)
Here:
+$3,297
State:
+$9,233
(% of AGI for various income ranges: 12.0% for AGIs below $10k, 5.6% for AGIs $10k-25k, -0.1% for AGIs $25k-50k, 1.2% for AGIs $50k-75k)
IRA payment deduction: $2,812 (reported on 2.7% of returns)
40037:
$2,812
Kentucky:
$2,955
Total itemized deductions: $11,760 (20% of AGI, reported on 17.5% of returns)
Here:
$11,760
State:
$17,474
Here:
20.3% of AGI
State:
21.0% of AGI
(% of AGI for various income ranges: 3.4% for AGIs $10k-25k, 6.1% for AGIs $25k-50k, 8.2% for AGIs $50k-75k, 9.9% for AGIs $75k-100k, 6.2% for AGIs over 100k)
Charity contributions deductions: $1,396 (2% of AGI, reported on 15.3% of returns)
Here:
$1,396
State:
$3,494
Here:
2.4% of AGI
State:
4.0% of AGI
(% of AGI for various income ranges: 0.4% for AGIs $10k-25k, 0.7% for AGIs $25k-50k, 0.6% for AGIs $50k-75k, 1.3% for AGIs $75k-100k, 0.6% for AGIs over 100k)
Total tax: $3,218 (reported on 74.6% of returns)
40037:
$3,218
State:
$6,162
(% of AGI for various income ranges: 3.4% for AGIs below $10k, 4.1% for AGIs $10k-25k, 6.2% for AGIs $25k-50k, 7.4% for AGIs $50k-75k, 9.5% for AGIs $75k-100k, 18.8% for AGIs over 100k)
Earned income credit: $1,805 (reported on 19.0% of returns)
Here:
$1,805
State:
$1,723
Percentage of individuals using paid preparers for their 2004 taxes: 76.5%
Here:
76%
State:
66%
(% for various income ranges: 65.8% for AGIs below $10k, 80.3% for AGIs $10k-25k, 77.3% for AGIs $25k-50k, 81.4% for AGIs $50k-75k, 78.7% for AGIs $75k-100k, 95.2% for AGIs over 100k)
Household received Food Stamps/SNAP in the past 12 months: 145 Household did not receive Food Stamps/SNAP in the past 12 months: 1,009
Women who had a birth in the past 12 months: 8 (7 now married, 1 unmarried) Women who did not have a birth in the past 12 months: 588 (338 now married, 252 unmarried)
Housing units in zip code 40037 with a mortgage: 589 (32 second mortgage, 30 both second mortgage and home equity loan) Houses without a mortgage: 57
Median monthly owner costs for units with a mortgage: $1,118 Median monthly owner costs for units without a mortgage: $448
Residents with income below the poverty level in 2022:
This zip code:
11.8%
Whole state:
16.5%
Residents with income below 50% of the poverty level in 2022:
This zip code:
8.7%
Whole state:
9.0%
Median number of rooms in houses and condos:
Here:
6.3
State:
6.4
Median number of rooms in apartments:
Here:
4.5
State:
4.4
Notable locations in this zip code not listed on our city pages
Streams, rivers, and creeks: Big Terrapin Run (A), Crab Run (B), Coleman Run (C), Logan Branch (D), Little Terrapin Run (E), Hickory Camp Run (F), Monick Branch (G). Display/hide their locations on the map
Size of family households: 326 2-persons, 148 3-persons, 242 4-persons, 41 5-persons, 12 6-persons
Size of nonfamily households: 283 1-person, 96 2-persons, 1 3-persons
431 married couples with children.
241 single-parent households (183 men, 58 women).
99.9% of residents of 40037 zip code speak English at home.
Foreign born population: 0 (0.0%)
:
0.0%
Whole state:
4.0%
44%English
20%American
18%Irish
2%French Canadian
2%German
1%Dutch
1%Polish
Year of entry for the foreign-born population
02010 or later
22000 to 2009
01990 to 1999
0Before 1990
Facilities with environmental interests located in this zip code:
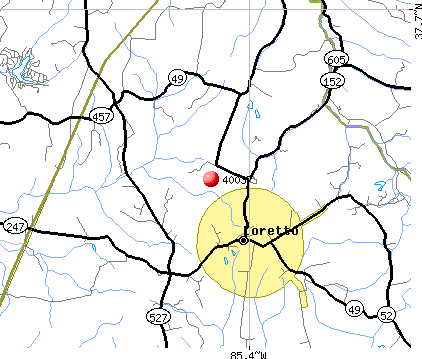
MAKER'S MARK DISTILLERY (3350 BURKS SPRINGS ROAD in LORETTO, KY)
AIR MAJOR (AIRS/AFS) COMPLIANCE ACTIVITY (Tracking inspections of insecticide, fungicide, and rodenticide, and toxic substances) CRITERIA AND HAZARDOUS AIR POLLUTANT INVENTORY (Inventory of air pollution sources) National Pollutant Discharge Elimination System NON-MAJOR (Tracking pollutant discharge elimination systems) - permit Business SIC classification: DISTILLED AND BLENDED LIQUORS Organizations: MAKERS MARK DISTILLERY (CONTACT/OWNER)
LORETTO PLAZA (9340 LORETTO RD in LORETTO, KY)
(Resource Conservation and Recovery Act (tracking hazardous waste))
CORNER FOOD MART (HIGHWAY 49 in LORETTO, KY)
(Resource Conservation and Recovery Act (tracking hazardous waste)) Organizations: TOMMY MATTINGLY (CONTACT/OWNER)
LORETTO, CITY OF (SCHOOL DR in LORETTO, KY)
National Pollutant Discharge Elimination System NON-MAJOR (Tracking pollutant discharge elimination systems) - permit Business SIC classification: SEWERAGE SYSTEMS
MATTINGLY GAS STATION (HIGHWAY 49 in LORETTO, KY)
(Resource Conservation and Recovery Act (tracking hazardous waste)) Organizations: THOMAS MATTINGLY (CONTACT/OWNER)
Housing units lacking complete plumbing facilities: 1.8% Housing units lacking complete kitchen facilities: 1.5%
61.3%Electricity
13.8%Utility gas
13.5%Bottled, tank, or LP gas
9.8%Wood
1.7%Solar energy
Population in 1990: 2,586. Population change in the 1990s: +58 (+2.2%).
Place of birth for U.S.-born residents:
This state: 2,608
Northeast: 13
Midwest: 63
South: 26
West: 30
71% of the 40037 zip code residents lived in the same house 5 years ago. Out of people who lived in different houses, 66% lived in this county. Out of people who lived in different counties, 50% lived in Kentucky.
96% of the 40037 zip code residents lived in the same house 1 year ago. Out of people who lived in different houses, 22% moved from this county. Out of people who lived in different houses, 79% moved from different county within same state. Out of people who lived in different houses, 3% moved from abroad.
Private vs. public school enrollment:
Students in private schools in grades 1 to 8 (elementary and middle school): 3
Here:
1.1%
Kentucky:
17.2%
Students in private schools in grades 9 to 12 (high school): 47
Here:
26.1%
Kentucky:
15.2%
Students in private undergraduate colleges:
Here:
0.0%
Kentucky:
19.6%
Occupation by median earnings in the past 12 months ($)
84,932Construction and extraction occupations
72,672Installation, maintenance, and repair occupations
64,740Education, training, and library occupations
57,243Material moving occupations
57,161Production occupations
53,102Architecture and engineering occupations
Top industries in this zip code by the number of employees in 2005:
Health Care and Social Assistance: Nursing Care Facilities (20-49 employees: 1 establishment)
Health Care and Social Assistance: Child Day Care Services (10-19: 1)
Accommodation and Food Services: Full-Service Restaurants (10-19: 1)
Accommodation and Food Services: Drinking Places (Alcoholic Beverages) (5-9: 1)
Finance and Insurance: Commercial Banking (5-9: 1)
People in group quarters in 2000:
85 people in nursing homes
33 people in religious group quarters
Fatal accident statistics in 2014:
Fatal accident count: 1
Vehicles involved in fatal accidents: 2
Fatal accidents caused by drunken drivers: 0
Fatalities: 1
Persons involved in fatal accidents: 2
Pedestrians involved in fatal accidents: 0
Fatal accident statistics in 2013:
Fatal accident count: 1
Vehicles involved in fatal accidents: 1
Fatal accidents caused by drunken drivers: 0
Fatalities: 1
Persons involved in fatal accidents: 1
Pedestrians involved in fatal accidents: 0
2004 - 2018 National Fire Incident Reporting System (NFIRS) incidents
Based on the data from the years 2004 - 2018 the average number of fire incidents per year is 10. The highest number of reported fires - 21 took place in 2008, and the least - 1 in 2004. The data has a rising trend.
When looking into fire subcategories, the most incidents belonged to: Structure Fires (44.2%), and Outside Fires (40.1%).
Fire incident types reported to NFIRS in Zip Code 40037


 Nearest zip codes: 40049, 40062, 40052, 40063, 40060, 40051.


 Based on the data from the years 2004 - 2018 the average number of fire incidents per year is 10. The highest number of reported fires - 21 took place in 2008, and the least - 1 in 2004. The data has a rising trend.
 When looking into fire subcategories, the most incidents belonged to: Structure Fires (44.2%), and Outside Fires (40.1%).