Estimated zip code population in 2022: 1,482 Zip code population in 2010: 2,039 Zip code population in 2000: 1,997
Houses and condos: 800 Renter-occupied apartments: 25
% of renters here:
4%
State:
30%
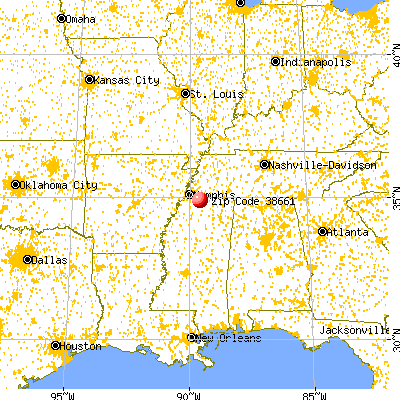
March 2022 cost of living index in zip code 38661: 77.2 (low, U.S. average is 100)
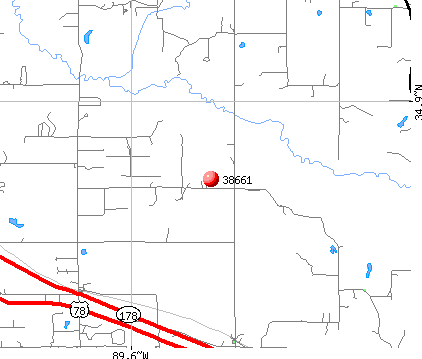
Land area: 31.8 sq. mi. Water area: 0.0 sq. mi.
Population density: 47 people per square mile
(very low).
OSM Map
General Map
Google Map
MSN Map
OSM Map
General Map
Google Map
MSN Map
OSM Map
General Map
Google Map
MSN Map
OSM Map
General Map
Google Map
MSN Map
Please wait while loading the map...
Real estate property taxes paid for housing units in 2022:
This zip code:
0.4% ($861)
Mississippi:
0.7% ($1,161)
Median real estate property taxes paid for housing units with mortgages in 2022: $2,078 Median real estate property taxes paid for housing units with no mortgage in 2022: $256
Business Search- 14 Million verified businesses
Males: 695
(46.9%)
Females: 787
(53.1%)
For population 25 years and over in 38661:
High school or higher: 90.3%
Bachelor's degree or higher: 11.9%
Graduate or professional degree: 2.9%
Unemployed: 0.4%
Mean travel time to work (commute): 37.9 minutes
For population 15 years and over in 38661:
Never married: 4.7%
Now married: 84.9%
Separated: 1.0%
Widowed: 3.6%
Divorced: 5.8%
Zip code 38661 compared to state average:
Unemployed percentage significantly below state average.
Hispanic race population percentage significantly below state average.
Median age significantly above state average.
Foreign-born population percentage significantly below state average.
Renting percentage significantly below state average.
Length of stay since moving in significantly above state average.
Percentage of population with a bachelor's degree or higher below state average.
Estimated median house/condo value in 2022: $197,798
38661:
$197,798
Mississippi:
$162,500
According to our research of Mississippi and other state lists, there were 5 registered sex offenders living in 38661 zip code as of July 06, 2024. The ratio of all residents to sex offenders in zip code 38661 is 404 to 1. The ratio of registered sex offenders to all residents in this zip code is lower than the state average.
Median resident age:
This zip code:
72.0 years
Mississippi median age:
38.9 years
Average household size:
This zip code:
2.1 people
Mississippi:
2.5 people
Averages for the 2020 tax year for zip code 38661, filed in 2021:
Average Adjusted Gross Income (AGI) in 2020: $45,462 (Individual Income Tax Returns)
Here:
$45,462
State:
$54,084
Salary/wage: $43,514 (reported on 78.9% of returns)
Here:
$43,514
State:
$45,187
(% of AGI for various income ranges: 1191.2% for AGIs below $25k, 3959.0% for AGIs $25k-50k, 6284.4% for AGIs $50k-75k, 10522.5% for AGIs $75k-100k, 24642.5% for AGIs $100k-200k)
Taxable interest for individuals: $433 (reported on 20.0% of returns)
This zip code:
$433
Mississippi:
$1,434
(% of AGI for various income ranges: 5.4% for AGIs below $25k, 5.7% for AGIs $25k-50k, 42.2% for AGIs $50k-75k, 5.0% for AGIs $75k-100k, 32.5% for AGIs $100k-200k)
Ordinary dividends: $867 (reported on 6.7% of returns)
Here:
$867
State:
$6,661
(% of AGI for various income ranges: 14.3% for AGIs $25k-50k, 55.0% for AGIs $100k-200k)
Net capital gain/loss in AGI: +$3,160 (reported on 5.6% of returns)
Here:
+$3,160
State:
+$16,833
(% of AGI for various income ranges: 37.1% for AGIs $25k-50k, 200.0% for AGIs $75k-100k)
Profit/loss from business: +$8,700 (reported on 25.6% of returns)
Here:
+$8,700
State:
+$7,724
(% of AGI for various income ranges: 219.6% for AGIs below $25k, 174.3% for AGIs $25k-50k, 960.0% for AGIs $75k-100k, 1810.0% for AGIs $100k-200k)
Taxable individual retirement arrangement distribution: $13,750 (reported on 4.4% of returns)
38661:
$13,750
Mississippi:
$17,717
(% of AGI for various income ranges: 611.1% for AGIs $50k-75k)
Total itemized deductions: $25,650 (reported on 6.7% of returns)
Here:
$25,650
State:
$34,027
(% of AGI for various income ranges: 385.7% for AGIs $25k-50k, 1822.5% for AGIs $75k-100k)
Charity contributions: $10,820 (reported on 5.6% of returns)
Here:
$10,820
State:
$14,997
(% of AGI for various income ranges: 134.3% for AGIs $25k-50k, 647.5% for AGIs $75k-100k)
Taxes paid: $5,433 (reported on 6.7% of returns)
38661:
$5,433
State:
$6,353
(% of AGI for various income ranges: 71.0% for AGIs $25k-50k, 442.5% for AGIs $75k-100k)
Earned income credit: $2,582 (reported on 24.4% of returns)
Here:
$2,582
State:
$2,689
(% of AGI for various income ranges: 150.4% for AGIs below $25k, 98.6% for AGIs $25k-50k)
Percentage of individuals using paid preparers for their 2020 taxes: 91.1%
Here:
91%
State:
94%
(% for various income ranges: 91.2% for AGIs below $25k, 92.6% for AGIs $25k-50k, 92.3% for AGIs $50k-75k, 85.7% for AGIs $75k-100k, 88.9% for AGIs $100k-200k)
Averages for the 2012 tax year for zip code 38661, filed in 2013:
Average Adjusted Gross Income (AGI) in 2012: $37,347 (Individual Income Tax Returns)
Here:
$37,347
State:
$46,197
Salary/wage: $34,355 (reported on 85.5% of returns)
Here:
$34,355
State:
$38,549
(% of AGI for various income ranges: 71.6% for AGIs below $25k, 82.6% for AGIs $25k-50k, 79.8% for AGIs $50k-75k, 80.3% for AGIs $75k-100k, 77.0% for AGIs $100k-200k)
Taxable interest for individuals: $453 (reported on 19.7% of returns)
This zip code:
$453
Mississippi:
$1,482
(% of AGI for various income ranges: 0.5% for AGIs below $25k, 0.3% for AGIs $25k-50k, 0.3% for AGIs $50k-75k)
Ordinary dividends: $375 (reported on 5.3% of returns)
Here:
$375
State:
$5,401
Profit/loss from business: +$6,388 (reported on 21.1% of returns)
Here:
+$6,388
State:
+$10,220
(% of AGI for various income ranges: 10.3% for AGIs below $25k, 4.2% for AGIs $25k-50k, 3.5% for AGIs $50k-75k)
Taxable individual retirement arrangement distribution: $10,900 (reported on 5.3% of returns)
38661:
$10,900
Mississippi:
$13,665
Total itemized deductions: $17,574 (25% of AGI, reported on 25.0% of returns)
Here:
$17,574
State:
$22,078
Here:
25.0% of AGI
State:
21.8% of AGI
(% of AGI for various income ranges: 13.6% for AGIs $25k-50k, 14.0% for AGIs $50k-75k, 15.1% for AGIs $75k-100k, 14.2% for AGIs $100k-200k)
Charity contributions: $4,514 (reported on 18.4% of returns)
Here:
$4,514
State:
$6,081
(% of AGI for various income ranges: 2.6% for AGIs $25k-50k, 2.0% for AGIs $50k-75k, 3.7% for AGIs $75k-100k, 2.9% for AGIs $100k-200k)
Taxes paid: $4,442 (reported on 25.0% of returns)
38661:
$4,442
State:
$5,794
(% of AGI for various income ranges: 2.3% for AGIs $25k-50k, 3.1% for AGIs $50k-75k, 3.9% for AGIs $75k-100k, 5.4% for AGIs $100k-200k)
Earned income credit: $2,625 (reported on 36.8% of returns)
Here:
$2,625
State:
$2,710
(% of AGI for various income ranges: 12.5% for AGIs below $25k, 1.8% for AGIs $25k-50k)
Percentage of individuals using paid preparers for their 2012 taxes: 64.5%
Here:
64%
State:
60%
(% for various income ranges: 63.9% for AGIs below $25k, 65.2% for AGIs $25k-50k, 66.7% for AGIs $50k-75k, 75.0% for AGIs $75k-100k, 50.0% for AGIs $100k-200k)
Averages for the 2004 tax year for zip code 38661, filed in 2005:
Average Adjusted Gross Income (AGI) in 2004: $31,615 (Individual Income Tax Returns)
Here:
$31,615
State:
$36,110
Salary/wage: $30,094 (reported on 85.7% of returns)
Here:
$30,094
State:
$31,757
(% of AGI for various income ranges: 93.6% for AGIs below $10k, 80.2% for AGIs $10k-25k, 85.6% for AGIs $25k-50k, 84.7% for AGIs $50k-75k, 80.3% for AGIs $75k-100k, 65.8% for AGIs over 100k)
Taxable interest for individuals: $674 (reported on 24.2% of returns)
This zip code:
$674
Mississippi:
$1,649
(% of AGI for various income ranges: 1.1% for AGIs below $10k, 0.7% for AGIs $10k-25k, 0.9% for AGIs $25k-50k, 0.2% for AGIs $50k-75k, 0.0% for AGIs $75k-100k, 0.1% for AGIs over 100k)
Taxable dividends: $480 (reported on 7.0% of returns)
Here:
$480
State:
$3,089
Net capital gain/loss: +$3,914 (reported on 4.9% of returns)
Here:
+$3,914
State:
+$8,427
(% of AGI for various income ranges: 1.1% for AGIs below $10k, 0.2% for AGIs $50k-75k, 4.1% for AGIs over 100k)
Profit/loss from business: +$6,887 (reported on 16.2% of returns)
Here:
+$6,887
State:
+$8,818
(% of AGI for various income ranges: 13.5% for AGIs below $10k, 7.0% for AGIs $10k-25k, 3.8% for AGIs $25k-50k, 1.0% for AGIs $50k-75k, 3.9% for AGIs $75k-100k)
Total itemized deductions: $16,581 (27% of AGI, reported on 25.2% of returns)
Here:
$16,581
State:
$17,896
Here:
26.9% of AGI
State:
22.5% of AGI
(% of AGI for various income ranges: 5.0% for AGIs $10k-25k, 15.2% for AGIs $25k-50k, 15.0% for AGIs $50k-75k, 19.0% for AGIs $75k-100k, 13.5% for AGIs over 100k)
Charity contributions deductions: $3,969 (7% of AGI, reported on 22.4% of returns)
Here:
$3,969
State:
$4,735
Here:
6.5% of AGI
State:
5.7% of AGI
(% of AGI for various income ranges: 1.4% for AGIs $10k-25k, 2.6% for AGIs $25k-50k, 3.4% for AGIs $50k-75k, 4.3% for AGIs $75k-100k, 3.4% for AGIs over 100k)
Total tax: $3,980 (reported on 63.9% of returns)
38661:
$3,980
State:
$5,562
(% of AGI for various income ranges: 3.4% for AGIs below $10k, 3.5% for AGIs $10k-25k, 5.0% for AGIs $25k-50k, 8.6% for AGIs $50k-75k, 10.0% for AGIs $75k-100k, 19.2% for AGIs over 100k)
Earned income credit: $1,865 (reported on 32.2% of returns)
Here:
$1,865
State:
$2,107
Percentage of individuals using paid preparers for their 2004 taxes: 70.3%
Here:
70%
State:
65%
(% for various income ranges: 66.2% for AGIs below $10k, 75.9% for AGIs $10k-25k, 71.3% for AGIs $25k-50k, 63.5% for AGIs $50k-75k, 57.6% for AGIs $75k-100k, 83.3% for AGIs over 100k)
Household received Food Stamps/SNAP in the past 12 months: 14 Household did not receive Food Stamps/SNAP in the past 12 months: 697
Women who had a birth in the past 12 months: 1 (1 now married, 0 unmarried) Women who did not have a birth in the past 12 months: 145 (144 now married, 0 unmarried)
Housing units in zip code 38661 with a mortgage: 426 Houses without a mortgage: 3
Median monthly owner costs for units with a mortgage: $1,738 Median monthly owner costs for units without a mortgage: $526
Residents with income below the poverty level in 2022:
This zip code:
12.2%
Whole state:
19.1%
Residents with income below 50% of the poverty level in 2022:
This zip code:
0.3%
Whole state:
10.3%
Median number of rooms in houses and condos:
Here:
6.6
State:
6.3
Notable locations in this zip code not listed on our city pages
Churches in zip code 38661 include: Victoria Heights Baptist Church (A), Mount Newell Missionary Baptist Church (B), Mount Pleasant Church (C), Mount Zion Church (D). Display/hide their locations on the map
Size of family households: 412 2-persons, 139 3-persons, 29 4-persons
Size of nonfamily households: 132 1-person, 1 2-persons
91 married couples with children.
0 single-parent households ().
102.3% of residents of 38661 zip code speak English at home.
0.1% of residents speak other Indo-European language at home (100% very well).
Foreign born population: 2 (0.1%) (0.0% of them are naturalized citizens)
:
0.1%
Whole state:
2.2%
100%Netherlands
28%English
10%American
3%Polish
1%Irish
0%Swiss
Year of entry for the foreign-born population
02010 or later
02000 to 2009
01990 to 1999
1Before 1990
Facilities with environmental interests located in this zip code:
E D WEST SWINE FACILITY (HIGHWAY 72 in RED BANKS, MS)
STATE MASTER (Mississippi compliance, permits, activity tracking ) - ENSITE-MSU002028, WASTEWATER FACILITY National Pollutant Discharge Elimination System NON-MAJOR (Tracking pollutant discharge elimination systems) - permit Business SIC classification: HOGS Alternative names: E D WEST JR SWINE, WEST, E D SWINE FACILITY
Housing units lacking complete plumbing facilities: 6.2%
67.0%Bottled, tank, or LP gas
26.0%Electricity
5.6%Wood
1.6%Utility gas
Population in 1990: 4,860.
Place of birth for U.S.-born residents:
This state: 512
Midwest: 75
South: 902
68% of the 38661 zip code residents lived in the same house 5 years ago. Out of people who lived in different houses, 46% lived in this county. Out of people who lived in different counties, 50% lived in Mississippi.
87% of the 38661 zip code residents lived in the same house 1 year ago. Out of people who lived in different houses, 66% moved from this county. Out of people who lived in different houses, 23% moved from different state. Out of people who lived in different houses, 11% moved from abroad.
Private vs. public school enrollment:
Students in private schools in grades 1 to 8 (elementary and middle school): 84
Here:
84.9%
Mississippi:
16.1%
Students in private undergraduate colleges:
Here:
0.0%
Mississippi:
12.8%
Top industries in this zip code by the number of employees in 2005:
Construction: Site Preparation Contractors (20-49 employees: 1 establishment)
Other Services (except Public Administration): Religious Organizations (5-9: 1, 1-4: 1)
Construction: Electrical Contractors (1-4: 2)
Fatal accident statistics in 2014:
Fatal accident count: 1
Vehicles involved in fatal accidents: 1
Fatal accidents caused by drunken drivers: 0
Fatalities: 1
Persons involved in fatal accidents: 1
Pedestrians involved in fatal accidents: 0
Fatal accident statistics in 2013:
Fatal accident count: 3
Vehicles involved in fatal accidents: 3
Fatal accidents caused by drunken drivers: 0
Fatalities: 3
Persons involved in fatal accidents: 6
Pedestrians involved in fatal accidents: 1
Home Mortgage Disclosure Act Aggregated Statistics For Year 2009 (Based on 4 partial tracts)
A) FHA, FSA/RHS & VA Home Purchase Loans
B) Conventional Home Purchase Loans
C) Refinancings
D) Home Improvement Loans
F) Non-occupant Loans on < 5 Family Dwellings (A B C & D)
G) Loans On Manufactured Home Dwelling (A B C & D)
Number
Average Value
Number
Average Value
Number
Average Value
Number
Average Value
Number
Average Value
Number
Average Value
LOANS ORIGINATED
13
$122,540
13
$73,460
46
$108,090
7
$26,407
11
$68,040
14
$40,334
APPLICATIONS APPROVED, NOT ACCEPTED
0
$0
0
$0
1
$182,200
0
$0
0
$0
0
$0
APPLICATIONS DENIED
2
$121,590
5
$49,980
13
$121,903
2
$17,400
0
$0
4
$61,408
APPLICATIONS WITHDRAWN
1
$176,940
1
$79,300
10
$158,916
0
$0
0
$0
0
$0
FILES CLOSED FOR INCOMPLETENESS
0
$0
0
$0
1
$90,760
0
$0
0
$0
0
$0
Aggregated Statistics For Year 2008 (Based on 4 partial tracts)
A) FHA, FSA/RHS & VA Home Purchase Loans
B) Conventional Home Purchase Loans
C) Refinancings
D) Home Improvement Loans
F) Non-occupant Loans on < 5 Family Dwellings (A B C & D)
G) Loans On Manufactured Home Dwelling (A B C & D)
Number
Average Value
Number
Average Value
Number
Average Value
Number
Average Value
Number
Average Value
Number
Average Value
LOANS ORIGINATED
9
$124,191
12
$95,782
39
$106,713
10
$22,687
11
$89,621
14
$40,655
APPLICATIONS APPROVED, NOT ACCEPTED
0
$0
2
$57,930
3
$109,970
0
$0
0
$0
2
$60,525
APPLICATIONS DENIED
1
$131,740
8
$70,878
21
$141,234
8
$48,754
2
$93,225
7
$56,971
APPLICATIONS WITHDRAWN
0
$0
1
$139,510
7
$136,021
0
$0
0
$0
1
$79,590
FILES CLOSED FOR INCOMPLETENESS
0
$0
0
$0
1
$217,430
0
$0
0
$0
0
$0
Aggregated Statistics For Year 2007 (Based on 4 partial tracts)
A) FHA, FSA/RHS & VA Home Purchase Loans
B) Conventional Home Purchase Loans
C) Refinancings
D) Home Improvement Loans
F) Non-occupant Loans on < 5 Family Dwellings (A B C & D)
G) Loans On Manufactured Home Dwelling (A B C & D)
Number
Average Value
Number
Average Value
Number
Average Value
Number
Average Value
Number
Average Value
Number
Average Value
LOANS ORIGINATED
5
$124,148
24
$96,247
37
$106,056
13
$24,553
9
$59,860
14
$48,639
APPLICATIONS APPROVED, NOT ACCEPTED
1
$61,110
3
$97,570
4
$111,530
2
$39,190
0
$0
4
$59,158
APPLICATIONS DENIED
1
$96,170
14
$102,073
28
$110,521
8
$57,149
3
$73,693
12
$55,229
APPLICATIONS WITHDRAWN
1
$35,040
2
$106,000
11
$132,319
1
$29,830
1
$33,020
2
$46,760
FILES CLOSED FOR INCOMPLETENESS
0
$0
1
$82,290
4
$124,450
0
$0
0
$0
0
$0
Aggregated Statistics For Year 2006 (Based on 4 partial tracts)
A) FHA, FSA/RHS & VA Home Purchase Loans
B) Conventional Home Purchase Loans
C) Refinancings
D) Home Improvement Loans
F) Non-occupant Loans on < 5 Family Dwellings (A B C & D)
G) Loans On Manufactured Home Dwelling (A B C & D)
Number
Average Value
Number
Average Value
Number
Average Value
Number
Average Value
Number
Average Value
Number
Average Value
LOANS ORIGINATED
3
$110,547
34
$95,467
36
$88,474
9
$26,509
8
$46,221
16
$49,097
APPLICATIONS APPROVED, NOT ACCEPTED
1
$48,170
4
$106,452
7
$111,460
1
$25,350
0
$0
1
$90,270
APPLICATIONS DENIED
2
$57,410
19
$74,229
28
$91,599
7
$47,217
2
$42,535
16
$58,984
APPLICATIONS WITHDRAWN
0
$0
3
$93,877
10
$111,585
1
$115,430
0
$0
0
$0
FILES CLOSED FOR INCOMPLETENESS
0
$0
2
$91,085
9
$118,643
0
$0
0
$0
0
$0
Aggregated Statistics For Year 2005 (Based on 4 partial tracts)
A) FHA, FSA/RHS & VA Home Purchase Loans
B) Conventional Home Purchase Loans
C) Refinancings
D) Home Improvement Loans
F) Non-occupant Loans on < 5 Family Dwellings (A B C & D)
G) Loans On Manufactured Home Dwelling (A B C & D)
Number
Average Value
Number
Average Value
Number
Average Value
Number
Average Value
Number
Average Value
Number
Average Value
LOANS ORIGINATED
3
$89,260
30
$92,876
46
$88,141
10
$24,631
11
$48,597
14
$51,295
APPLICATIONS APPROVED, NOT ACCEPTED
1
$72,700
6
$68,730
10
$85,863
1
$14,240
0
$0
5
$49,766
APPLICATIONS DENIED
1
$93,720
20
$77,227
34
$94,769
8
$25,740
1
$43,180
14
$54,848
APPLICATIONS WITHDRAWN
1
$80,280
6
$93,180
9
$112,221
2
$160,100
1
$108,070
1
$96,370
FILES CLOSED FOR INCOMPLETENESS
0
$0
1
$89,010
5
$102,784
0
$0
0
$0
1
$77,040
Aggregated Statistics For Year 2004 (Based on 4 partial tracts)
A) FHA, FSA/RHS & VA Home Purchase Loans
B) Conventional Home Purchase Loans
C) Refinancings
D) Home Improvement Loans
F) Non-occupant Loans on < 5 Family Dwellings (A B C & D)
G) Loans On Manufactured Home Dwelling (A B C & D)
Detailed PMIC statistics for the following Tracts:9501.00
, 9503.00
2003 - 2018 National Fire Incident Reporting System (NFIRS) incidents
According to the data from the years 2003 - 2018 the average number of fires per year is 20. The highest number of fire incidents - 33 took place in 2010, and the least - 9 in 2003. The data has an increasing trend.
When looking into fire subcategories, the most incidents belonged to: Outside Fires (41.1%), and Structure Fires (38.3%).
Fire incident types reported to NFIRS in Zip Code 38661


 Nearest zip codes: 38611, 38635, 38066, 38017, 38642, 38057.


 According to the data from the years 2003 - 2018 the average number of fires per year is 20. The highest number of fire incidents - 33 took place in 2010, and the least - 9 in 2003. The data has an increasing trend.
 When looking into fire subcategories, the most incidents belonged to: Outside Fires (41.1%), and Structure Fires (38.3%).