Estimated zip code population in 2022: 2,667 Zip code population in 2010: 2,345 Zip code population in 2000: 2,272
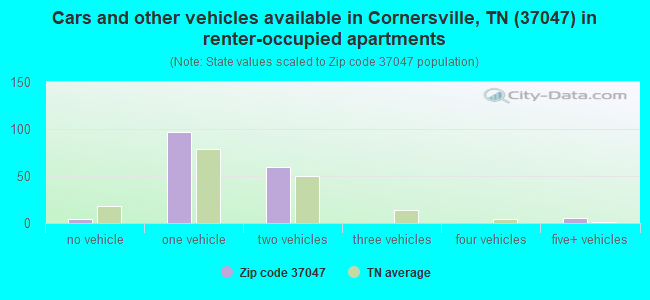
Houses and condos: 1,001 Renter-occupied apartments: 164
% of renters here:
18%
State:
33%
March 2022 cost of living index in zip code 37047: 79.7 (low, U.S. average is 100)
Land area: 60.8 sq. mi. Water area: 0.0 sq. mi.
Population density: 44 people per square mile
(very low).
OSM Map
General Map
Google Map
MSN Map
OSM Map
General Map
Google Map
MSN Map
OSM Map
General Map
Google Map
MSN Map
OSM Map
General Map
Google Map
MSN Map
Please wait while loading the map...
Real estate property taxes paid for housing units in 2022:
This zip code:
0.5% ($1,171)
Tennessee:
0.5% ($1,376)
Median real estate property taxes paid for housing units with mortgages in 2022: $1,286 (0.5%) Median real estate property taxes paid for housing units with no mortgage in 2022: $1,052 (0.5%)
Business Search- 14 Million verified businesses
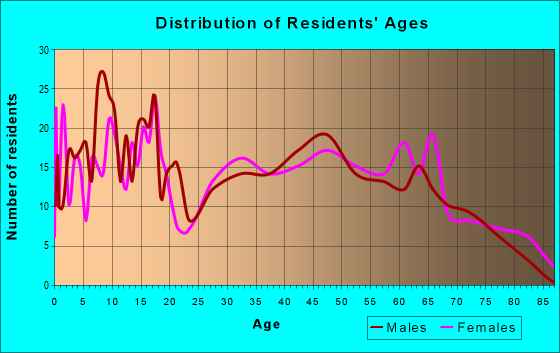
Males: 1,481
(55.5%)
Females: 1,185
(44.5%)
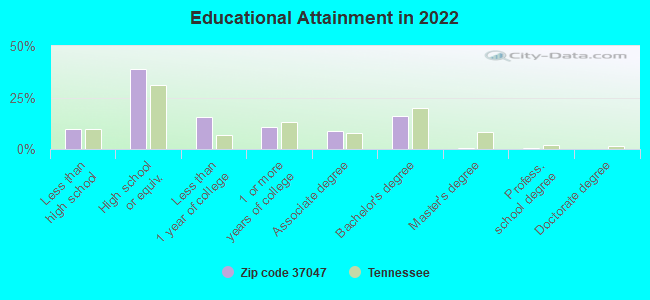
For population 25 years and over in 37047:
High school or higher: 90.3%
Bachelor's degree or higher: 16.9%
Graduate or professional degree: 1.1%
Unemployed: 4.1%
Mean travel time to work (commute): 32.8 minutes
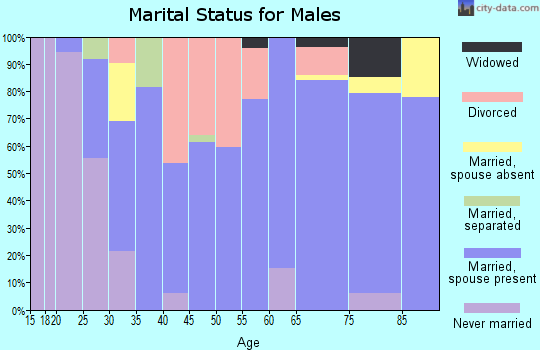
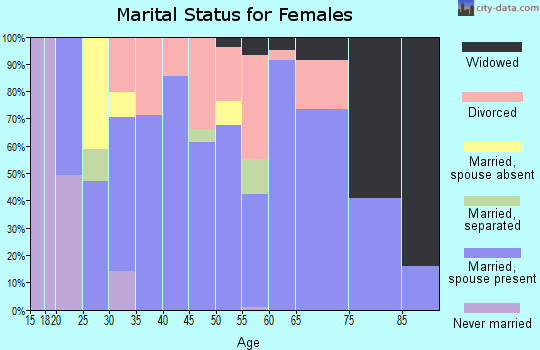
For population 15 years and over in 37047:
Never married: 33.5%
Now married: 46.6%
Separated: 2.3%
Widowed: 7.8%
Divorced: 9.7%
Zip code 37047 compared to state average:
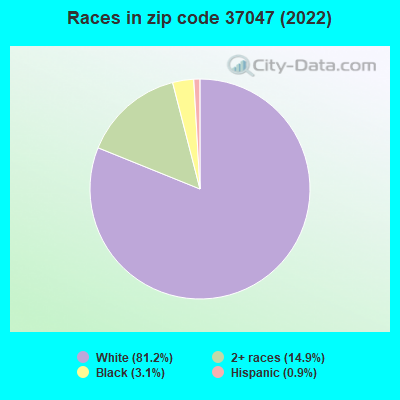
Black race population percentage significantly below state average.
Hispanic race population percentage significantly below state average.
Foreign-born population percentage significantly below state average.
Renting percentage below state average.
Length of stay since moving in above state average.
Number of college students below state average.
Percentage of population with a bachelor's degree or higher below state average.
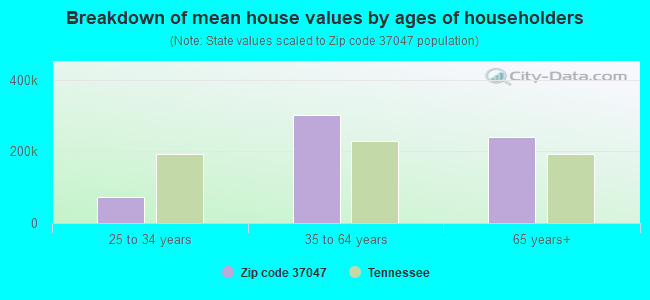
Estimated median house/condo value in 2022: $235,718
37047:
$235,718
Tennessee:
$284,800
According to our research of Tennessee and other state lists, there were 7 registered sex offenders living in 37047 zip code as of July 05, 2024. The ratio of all residents to sex offenders in zip code 37047 is 374 to 1. The ratio of registered sex offenders to all residents in this zip code is near the state average.
Median resident age:
This zip code:
39.0 years
Tennessee median age:
39.2 years
Average household size:
This zip code:
2.9 people
Tennessee:
2.4 people
Averages for the 2020 tax year for zip code 37047, filed in 2021:
Average Adjusted Gross Income (AGI) in 2020: $57,702 (Individual Income Tax Returns)
Here:
$57,702
State:
$69,014
Salary/wage: $48,626 (reported on 82.0% of returns)
Here:
$48,626
State:
$55,872
(% of AGI for various income ranges: 1255.5% for AGIs below $25k, 3506.9% for AGIs $25k-50k, 6162.9% for AGIs $50k-75k, 9292.2% for AGIs $75k-100k, 12735.0% for AGIs $100k-200k)
Taxable interest for individuals: $1,413 (reported on 24.6% of returns)
This zip code:
$1,413
Tennessee:
$1,945
(% of AGI for various income ranges: 17.2% for AGIs below $25k, 47.2% for AGIs $25k-50k, 8.8% for AGIs $50k-75k, 61.1% for AGIs $75k-100k, 208.8% for AGIs $100k-200k)
Ordinary dividends: $2,682 (reported on 9.0% of returns)
Here:
$2,682
State:
$8,105
(% of AGI for various income ranges: 47.2% for AGIs $25k-50k, 28.9% for AGIs $75k-100k, 165.0% for AGIs $100k-200k)
Net capital gain/loss in AGI: +$17,009 (reported on 9.0% of returns)
Here:
+$17,009
State:
+$33,664
(% of AGI for various income ranges: 26.2% for AGIs $25k-50k, 95.3% for AGIs $50k-75k, 2041.3% for AGIs $100k-200k)
Profit/loss from business: +$18,450 (reported on 16.4% of returns)
Here:
+$18,450
State:
+$18,991
(% of AGI for various income ranges: 137.9% for AGIs below $25k, 96.2% for AGIs $25k-50k, 249.4% for AGIs $50k-75k, 561.1% for AGIs $75k-100k, 2602.5% for AGIs $100k-200k)
Taxable individual retirement arrangement distribution: $16,311 (reported on 7.4% of returns)
37047:
$16,311
Tennessee:
$20,036
(% of AGI for various income ranges: 44.5% for AGIs below $25k, 154.1% for AGIs $25k-50k, 991.1% for AGIs $75k-100k)
Total itemized deductions: $38,800 (reported on 1.6% of returns)
Here:
$38,800
State:
$40,136
(% of AGI for various income ranges: 456.5% for AGIs $50k-75k)
Taxes paid: $5,900 (reported on 1.6% of returns)
37047:
$5,900
State:
$6,038
(% of AGI for various income ranges: 69.4% for AGIs $50k-75k)
Earned income credit: $2,415 (reported on 16.4% of returns)
Here:
$2,415
State:
$2,391
(% of AGI for various income ranges: 101.7% for AGIs below $25k, 64.8% for AGIs $25k-50k)
Percentage of individuals using paid preparers for their 2020 taxes: 95.1%
Here:
95%
State:
93%
(% for various income ranges: 95.0% for AGIs below $25k, 94.3% for AGIs $25k-50k, 100.0% for AGIs $50k-75k, 100.0% for AGIs $75k-100k, 90.9% for AGIs $100k-200k, 66.7% for AGIs over 200k)
Averages for the 2012 tax year for zip code 37047, filed in 2013:
Average Adjusted Gross Income (AGI) in 2012: $43,581 (Individual Income Tax Returns)
Here:
$43,581
State:
$53,767
Salary/wage: $36,092 (reported on 84.9% of returns)
Here:
$36,092
State:
$45,421
(% of AGI for various income ranges: 73.9% for AGIs below $25k, 81.0% for AGIs $25k-50k, 80.7% for AGIs $50k-75k, 83.9% for AGIs $75k-100k, 48.1% for AGIs $100k-200k)
Taxable interest for individuals: $1,497 (reported on 28.3% of returns)
This zip code:
$1,497
Tennessee:
$1,732
(% of AGI for various income ranges: 1.1% for AGIs below $25k, 0.8% for AGIs $25k-50k, 1.9% for AGIs $50k-75k, 0.1% for AGIs $75k-100k, 0.8% for AGIs $100k-200k)
Ordinary dividends: $1,911 (reported on 8.5% of returns)
Here:
$1,911
State:
$6,739
(% of AGI for various income ranges: 0.3% for AGIs $25k-50k, 0.7% for AGIs $50k-75k, 1.1% for AGIs $75k-100k)
Net capital gain/loss in AGI: +$3,280 (reported on 9.4% of returns)
Here:
+$3,280
State:
+$19,082
(% of AGI for various income ranges: 0.1% for AGIs below $25k, 0.7% for AGIs $25k-50k, 0.1% for AGIs $50k-75k, 3.7% for AGIs $75k-100k)
Profit/loss from business: +$10,071 (reported on 13.2% of returns)
Here:
+$10,071
State:
+$15,240
(% of AGI for various income ranges: 9.4% for AGIs below $25k, 2.7% for AGIs $25k-50k, 6.2% for AGIs $50k-75k)
Taxable individual retirement arrangement distribution: $10,260 (reported on 9.4% of returns)
37047:
$10,260
Tennessee:
$15,505
(% of AGI for various income ranges: 3.4% for AGIs below $25k, 1.9% for AGIs $25k-50k, 6.8% for AGIs $50k-75k)
Total itemized deductions: $17,900 (20% of AGI, reported on 13.2% of returns)
Here:
$17,900
State:
$21,976
Here:
19.5% of AGI
State:
17.8% of AGI
(% of AGI for various income ranges: 6.5% for AGIs $25k-50k, 6.5% for AGIs $50k-75k, 6.4% for AGIs $75k-100k, 5.8% for AGIs $100k-200k)
Charity contributions: $3,400 (reported on 10.4% of returns)
Here:
$3,400
State:
$6,709
(% of AGI for various income ranges: 1.5% for AGIs below $25k, 1.0% for AGIs $50k-75k, 1.4% for AGIs $100k-200k)
Taxes paid: $3,393 (reported on 13.2% of returns)
37047:
$3,393
State:
$4,829
(% of AGI for various income ranges: 0.9% for AGIs $25k-50k, 0.9% for AGIs $50k-75k, 1.2% for AGIs $75k-100k, 1.5% for AGIs $100k-200k)
Earned income credit: $2,446 (reported on 22.6% of returns)
Here:
$2,446
State:
$2,404
(% of AGI for various income ranges: 7.7% for AGIs below $25k, 1.2% for AGIs $25k-50k)
Percentage of individuals using paid preparers for their 2012 taxes: 61.3%
Here:
61%
State:
52%
(% for various income ranges: 53.2% for AGIs below $25k, 63.3% for AGIs $25k-50k, 73.3% for AGIs $50k-75k, 71.4% for AGIs $75k-100k, 71.4% for AGIs $100k-200k)
Averages for the 2004 tax year for zip code 37047, filed in 2005:
Average Adjusted Gross Income (AGI) in 2004: $35,849 (Individual Income Tax Returns)
Here:
$35,849
State:
$44,088
Salary/wage: $33,845 (reported on 85.3% of returns)
Here:
$33,845
State:
$38,825
(% of AGI for various income ranges: 99.2% for AGIs below $10k, 77.1% for AGIs $10k-25k, 86.2% for AGIs $25k-50k, 94.0% for AGIs $50k-75k, 87.9% for AGIs $75k-100k, 44.3% for AGIs over 100k)
Taxable interest for individuals: $1,839 (reported on 36.2% of returns)
This zip code:
$1,839
Tennessee:
$1,802
(% of AGI for various income ranges: 11.4% for AGIs below $10k, 4.6% for AGIs $10k-25k, 1.4% for AGIs $25k-50k, 1.2% for AGIs $50k-75k, 0.6% for AGIs $75k-100k, 1.3% for AGIs over 100k)
Taxable dividends: $803 (reported on 13.7% of returns)
Here:
$803
State:
$3,727
(% of AGI for various income ranges: 1.4% for AGIs below $10k, 0.7% for AGIs $10k-25k, 0.2% for AGIs $25k-50k, 0.1% for AGIs $50k-75k, 0.1% for AGIs $75k-100k, 0.5% for AGIs over 100k)
Net capital gain/loss: +$7,191 (reported on 11.5% of returns)
Here:
+$7,191
State:
+$15,776
(% of AGI for various income ranges: 4.5% for AGIs below $10k, 0.6% for AGIs $10k-25k, 0.5% for AGIs $25k-50k, 0.5% for AGIs $50k-75k, 1.7% for AGIs $75k-100k, 9.8% for AGIs over 100k)
Profit/loss from business: +$8,792 (reported on 14.9% of returns)
Here:
+$8,792
State:
+$12,882
(% of AGI for various income ranges: 14.6% for AGIs below $10k, 5.2% for AGIs $10k-25k, 4.2% for AGIs $25k-50k, 0.2% for AGIs $50k-75k, 9.8% for AGIs $75k-100k)
Total itemized deductions: $13,552 (20% of AGI, reported on 12.5% of returns)
Here:
$13,552
State:
$18,035
Here:
20.4% of AGI
State:
19.9% of AGI
(% of AGI for various income ranges: 2.7% for AGIs $10k-25k, 4.0% for AGIs $25k-50k, 6.0% for AGIs $50k-75k, 6.9% for AGIs $75k-100k, 4.6% for AGIs over 100k)
Charity contributions deductions: $2,929 (4% of AGI, reported on 9.8% of returns)
Here:
$2,929
State:
$5,167
Here:
3.9% of AGI
State:
5.3% of AGI
(% of AGI for various income ranges: 0.5% for AGIs $25k-50k, 1.0% for AGIs $50k-75k, 1.6% for AGIs $75k-100k, 1.2% for AGIs over 100k)
Total tax: $3,910 (reported on 71.2% of returns)
37047:
$3,910
State:
$7,482
(% of AGI for various income ranges: 3.1% for AGIs below $10k, 4.0% for AGIs $10k-25k, 5.9% for AGIs $25k-50k, 8.0% for AGIs $50k-75k, 10.7% for AGIs $75k-100k, 12.1% for AGIs over 100k)
Earned income credit: $1,723 (reported on 18.8% of returns)
Here:
$1,723
State:
$1,826
Percentage of individuals using paid preparers for their 2004 taxes: 65.1%
Here:
65%
State:
60%
(% for various income ranges: 57.2% for AGIs below $10k, 64.5% for AGIs $10k-25k, 67.0% for AGIs $25k-50k, 66.0% for AGIs $50k-75k, 74.6% for AGIs $75k-100k, 78.1% for AGIs over 100k)
Household received Food Stamps/SNAP in the past 12 months: 85 Household did not receive Food Stamps/SNAP in the past 12 months: 829
Women who had a birth in the past 12 months: 40 (38 now married, 2 unmarried) Women who did not have a birth in the past 12 months: 375 (179 now married, 196 unmarried)
Housing units in zip code 37047 with a mortgage: 390 (13 second mortgage) Houses without a mortgage: 7
Median monthly owner costs for units with a mortgage: $1,226 Median monthly owner costs for units without a mortgage: $437
Residents with income below the poverty level in 2022:
This zip code:
22.1%
Whole state:
13.3%
Residents with income below 50% of the poverty level in 2022:
This zip code:
17.9%
Whole state:
7.1%
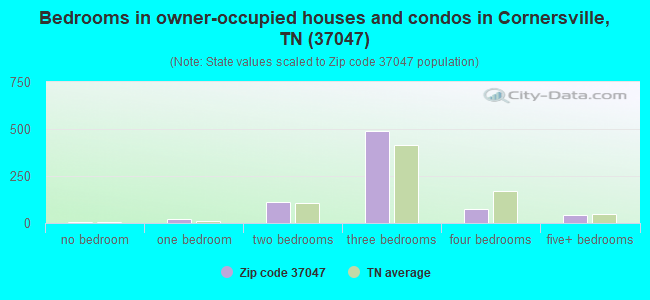
Median number of rooms in houses and condos:
Here:
6.8
State:
6.5
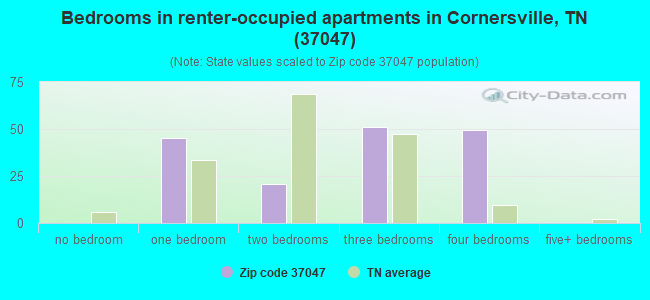
Median number of rooms in apartments:
Here:
5.8
State:
4.4
Notable locations in this zip code not listed on our city pages
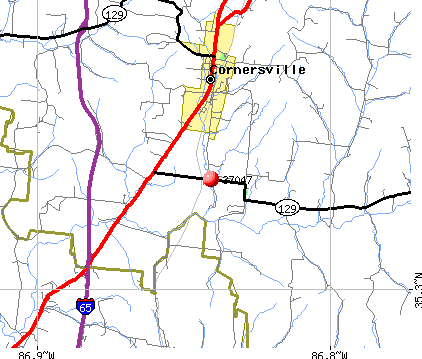
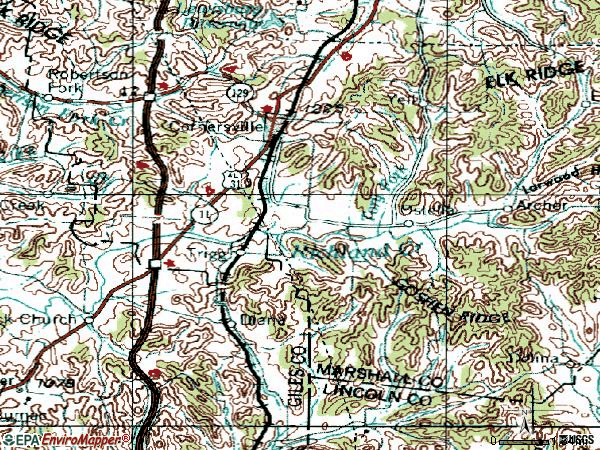
Notable locations in zip code 37047: Star Lane Farm (A), Mars Hill (B), Cherry Corner (C), Five Points Volunteer Fire Department (D), South Marshall Rural Volunteer Fire Department (E), Cornersville Fire Department (F). Display/hide their locations on the map
Churches in zip code 37047 include: Ostella Church of Christ (A), Brick Church (B), Mars Hill Presbyterian Church (C). Display/hide their locations on the map
Cemeteries: Horton Cemetery (1), Sumner Cemetery (2), Roden Cemetery (3), Old Mars Hill Cemetery (4), Mars Hill Cemetery (5), Beech Cliff Church (6), Brick Church Cemetery (7). Display/hide their locations on the map
Size of family households: 242 2-persons, 141 3-persons, 107 4-persons, 73 5-persons, 26 6-persons, 20 7-or-more-persons
Size of nonfamily households: 254 1-person, 30 2-persons, 17 4-persons
235 married couples with children.
224 single-parent households (185 men, 39 women).
97.4% of residents of 37047 zip code speak English at home.
0.4% of residents speak Spanish at home (100% very well).
1.5% of residents speak other Indo-European language at home (100% well).
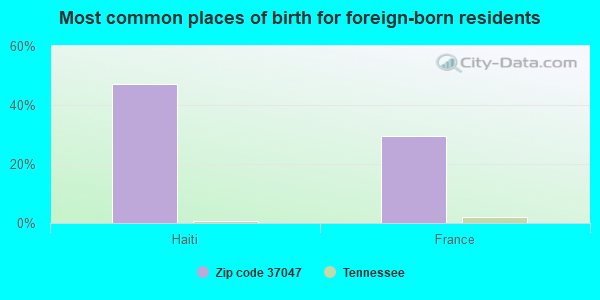
Foreign born population: 17 (0.7%) (82.1% of them are naturalized citizens)
This zip code:
0.7%
Whole state:
5.6%
47%Haiti
29%France
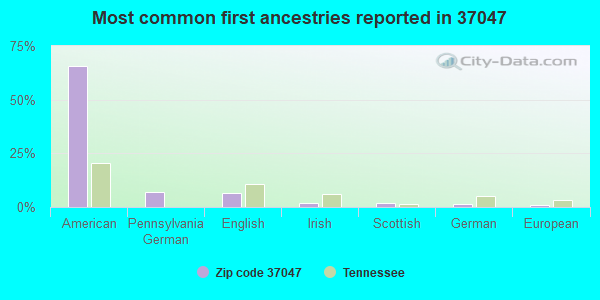
66%American
7%Pennsylvania German
6%English
2%Irish
2%Scottish
1%German
1%European
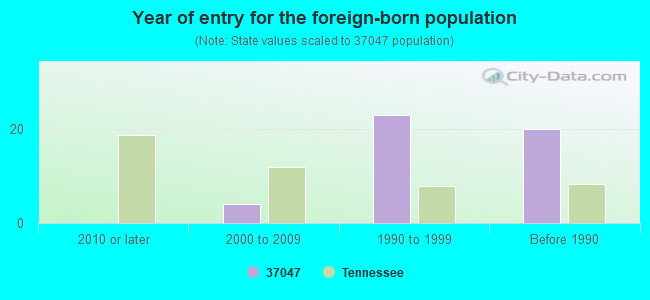
Year of entry for the foreign-born population
02010 or later
42000 to 2009
231990 to 1999
20Before 1990
Facilities with environmental interests located in this zip code:
CORNERSVILLE SCHOOL (323 S MAIN ST in CORNERSVILLE, TN)
(Geographic Names Information System) (National Center for Education Statistics) - STATE ID-0020 Organizations: MARSHALL COUNTY SCHOOL DISTRCT (SCHOOL DISTRICT)
CORNERSVILLE ELEMENTARY SCHOOL (485 NORTH MAIN ST in CORNERSVILLE, TN)
(National Center for Education Statistics) - STATE ID-0018 Organizations: MARSHALL COUNTY SCHOOL DISTRCT (SCHOOL DISTRICT)
CORNERSVILLE STP (1880 NEW OSTELLA ROAD in CORNERSVILLE, TN)
National Pollutant Discharge Elimination System NON-MAJOR (Tracking pollutant discharge elimination systems) - permit Business SIC classification: SEWERAGE SYSTEMS Organizations: MARY ANN PETERS (CONTACT/OWNER)
Alternative names: CORNERSVILLE WWTP
CUSTOM CONTROLS (126 S MAIN ST in CORNERSVILLE, TN)
AIR MINOR (AIRS/AFS) Business SIC classification: NONCLASSIFIABLE ESTABLISHMENTS
Housing units lacking complete plumbing facilities: 3.0% Housing units lacking complete kitchen facilities: 1.1%
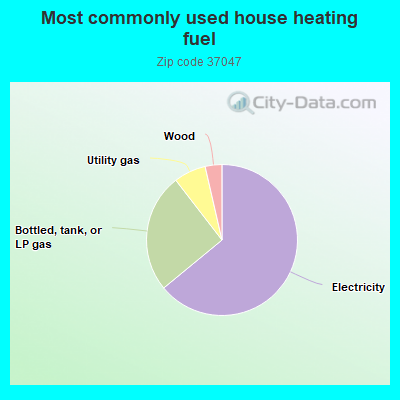
64.3%Electricity
25.6%Bottled, tank, or LP gas
6.9%Utility gas
3.6%Wood
Population in 1990: 1,631. Population change in the 1990s: +641 (+39.3%).
Place of birth for U.S.-born residents:
This state: 1,707
Northeast: 105
Midwest: 340
South: 350
West: 98
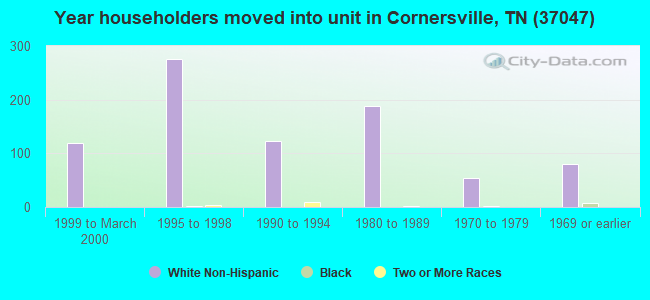
58% of the 37047 zip code residents lived in the same house 5 years ago. Out of people who lived in different houses, 53% lived in this county. Out of people who lived in different counties, 50% lived in Tennessee.
94% of the 37047 zip code residents lived in the same house 1 year ago. Out of people who lived in different houses, 41% moved from this county. Out of people who lived in different houses, 51% moved from different county within same state. Out of people who lived in different houses, 11% moved from different state.
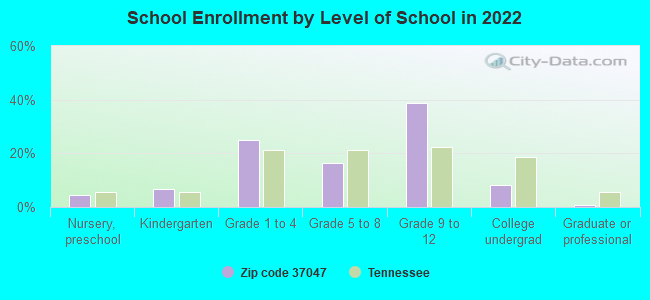
Private vs. public school enrollment:
Students in private schools in grades 1 to 8 (elementary and middle school): 41
Here:
14.5%
Tennessee:
15.0%
Students in private schools in grades 9 to 12 (high school): 21
Here:
8.3%
Tennessee:
16.2%
Students in private undergraduate colleges: 12
Here:
21.1%
Tennessee:
23.5%
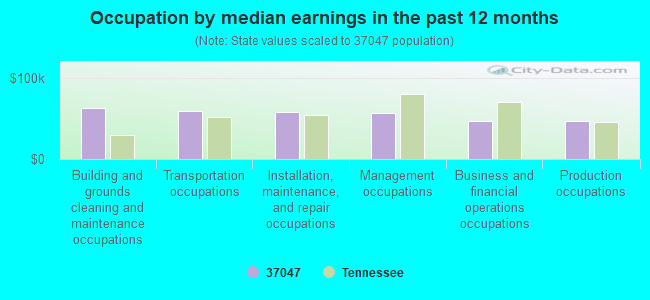
Occupation by median earnings in the past 12 months ($)
62,263Building and grounds cleaning and maintenance occupations
58,977Transportation occupations
58,167Installation, maintenance, and repair occupations
56,952Management occupations
46,892Business and financial operations occupations
46,783Production occupations
Companies with federal contracts located in this zip code:
IMMOBILIARE DELFINO - S.N.C. D (CORSO VENEZIA 87 in SAN BONIFACIO, In) : $197,000 in 3 contractsin 2002
$100,000 with Centers for Disease Control and Prevention for ADP Components. Taking place in GA. Signed on 2002-03-15. Completion date: 2002-04-15.
$50,000, same as above.Signed on 2002-08-15. Completion date: 2002-09-15.
$47,000 with Centers for Disease Control and Prevention for ADP Software. Taking place in GA. Signed on 2002-09-15. Completion date: 2002-10-15.
Top industries in this zip code by the number of employees in 2005:
Finance and Insurance: Commercial Banking (20-49: 1)
Wholesale Trade: Metal Service Centers and Other Metal Merchant Wholesalers (10-19: 1, 5-9: 1)
Arts, Entertainment, and Recreation: All Other Amusement and Recreation Industries (5-9: 1)
Arts, Entertainment, and Recreation: Golf Courses and Country Clubs (5-9: 1)
Accommodation and Food Services: Hotels (except Casino Hotels) and Motels (5-9: 1)
People in group quarters in 2000:
16 people in nursing homes
Fatal accident statistics in 2011:
Fatal accident count: 1
Vehicles involved in fatal accidents: 1
Fatal accidents caused by drunken drivers: 1
Fatalities: 1
Persons involved in fatal accidents: 1
Pedestrians involved in fatal accidents: 0
Fatal accident statistics in 2010:
Fatal accident count: 1
Vehicles involved in fatal accidents: 1
Fatal accidents caused by drunken drivers: 0
Fatalities: 1
Persons involved in fatal accidents: 1
Pedestrians involved in fatal accidents: 0
2002 - 2018 National Fire Incident Reporting System (NFIRS) incidents
According to the data from the years 2002 - 2018 the average number of fires per year is 24. The highest number of reported fires - 68 took place in 2007, and the least - 3 in 2002. The data has a growing trend.
When looking into fire subcategories, the most incidents belonged to: Outside Fires (41.5%), and Structure Fires (35.0%).
Fire incident types reported to NFIRS in Zip Code 37047


 Nearest zip codes: 38459, 37019, 37144, 37091, 38478, 38453.


 According to the data from the years 2002 - 2018 the average number of fires per year is 24. The highest number of reported fires - 68 took place in 2007, and the least - 3 in 2002. The data has a growing trend.
 When looking into fire subcategories, the most incidents belonged to: Outside Fires (41.5%), and Structure Fires (35.0%).