Estimated zip code population in 2022: 5,929 Zip code population in 2010: 4,493 Zip code population in 2000: 3,271
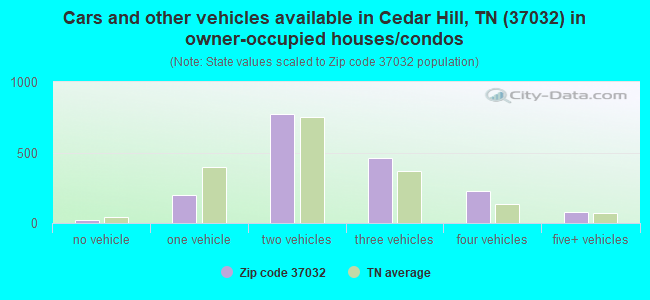
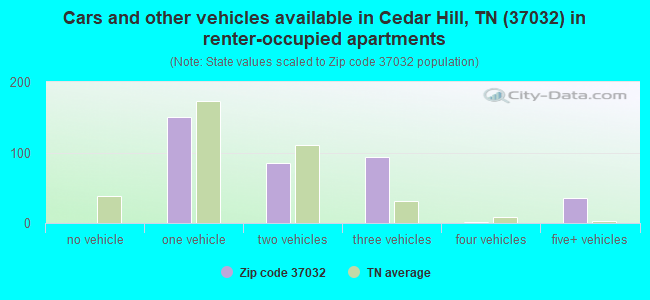
Houses and condos: 2,271 Renter-occupied apartments: 356
% of renters here:
17%
State:
33%
March 2022 cost of living index in zip code 37032: 79.1 (low, U.S. average is 100)
Land area: 80.7 sq. mi. Water area: 0.0 sq. mi.
Population density: 73 people per square mile
(very low).
OSM Map
General Map
Google Map
MSN Map
OSM Map
General Map
Google Map
MSN Map
OSM Map
General Map
Google Map
MSN Map
OSM Map
General Map
Google Map
MSN Map
Please wait while loading the map...
Real estate property taxes paid for housing units in 2022:
This zip code:
0.5% ($1,349)
Tennessee:
0.5% ($1,376)
Median real estate property taxes paid for housing units with mortgages in 2022: $1,308 (0.4%) Median real estate property taxes paid for housing units with no mortgage in 2022: $1,685 (0.6%)
Business Search- 14 Million verified businesses
Males: 3,013
(50.8%)
Females: 2,915
(49.2%)
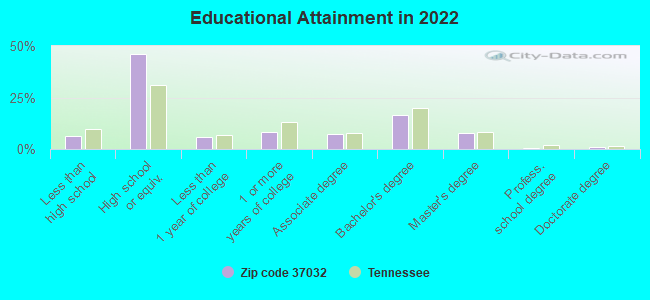
For population 25 years and over in 37032:
High school or higher: 93.2%
Bachelor's degree or higher: 25.8%
Graduate or professional degree: 9.1%
Unemployed: 5.0%
Mean travel time to work (commute): 34.5 minutes
For population 15 years and over in 37032:
Never married: 20.5%
Now married: 61.7%
Separated: 2.0%
Widowed: 6.0%
Divorced: 9.9%
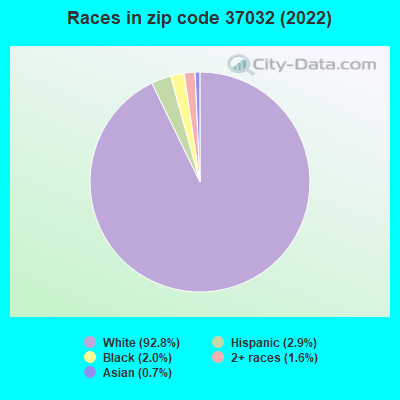
Zip code 37032 compared to state average:
Black race population percentage significantly below state average.
Hispanic race population percentage below state average.
Foreign-born population percentage significantly below state average.
Renting percentage below state average.
Length of stay since moving in significantly above state average.
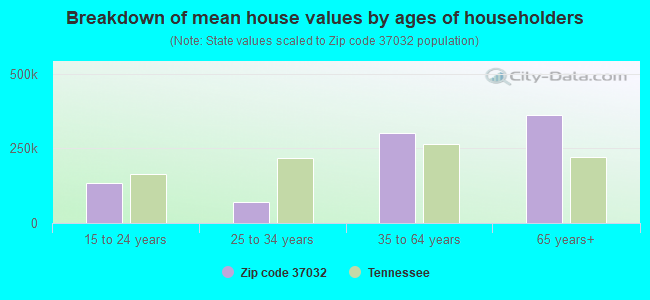
Estimated median house/condo value in 2022: $293,267
37032:
$293,267
Tennessee:
$284,800
According to our research of Tennessee and other state lists, there were 13 registered sex offenders living in 37032 zip code as of July 03, 2024. The ratio of all residents to sex offenders in zip code 37032 is 340 to 1. The ratio of registered sex offenders to all residents in this zip code is near the state average.
Median resident age:
This zip code:
36.0 years
Tennessee median age:
39.2 years
Average household size:
This zip code:
2.8 people
Tennessee:
2.4 people
Averages for the 2020 tax year for zip code 37032, filed in 2021:
Average Adjusted Gross Income (AGI) in 2020: $60,918 (Individual Income Tax Returns)
Here:
$60,918
State:
$69,014
Salary/wage: $54,416 (reported on 85.5% of returns)
Here:
$54,416
State:
$55,872
(% of AGI for various income ranges: 1487.9% for AGIs below $25k, 3722.9% for AGIs $25k-50k, 6486.7% for AGIs $50k-75k, 9037.4% for AGIs $75k-100k, 17168.1% for AGIs $100k-200k, 67125.0% for AGIs over 200k)
Taxable interest for individuals: $1,066 (reported on 25.9% of returns)
This zip code:
$1,066
Tennessee:
$1,945
(% of AGI for various income ranges: 10.2% for AGIs below $25k, 12.9% for AGIs $25k-50k, 32.9% for AGIs $50k-75k, 40.0% for AGIs $75k-100k, 118.6% for AGIs $100k-200k, 590.0% for AGIs over 200k)
Ordinary dividends: $2,269 (reported on 11.4% of returns)
Here:
$2,269
State:
$8,105
(% of AGI for various income ranges: 5.0% for AGIs below $25k, 10.2% for AGIs $25k-50k, 50.0% for AGIs $50k-75k, 17.4% for AGIs $75k-100k, 110.5% for AGIs $100k-200k, 675.0% for AGIs over 200k)
Net capital gain/loss in AGI: +$19,225 (reported on 12.3% of returns)
Here:
+$19,225
State:
+$33,664
(% of AGI for various income ranges: 7.3% for AGIs below $25k, 22.2% for AGIs $25k-50k, 128.8% for AGIs $50k-75k, 190.0% for AGIs $75k-100k, 634.3% for AGIs $100k-200k, 16230.0% for AGIs over 200k)
Profit/loss from business: +$11,544 (reported on 17.1% of returns)
Here:
+$11,544
State:
+$18,991
(% of AGI for various income ranges: 133.1% for AGIs below $25k, 163.6% for AGIs $25k-50k, 276.7% for AGIs $50k-75k, 386.8% for AGIs $75k-100k, 822.9% for AGIs $100k-200k)
Taxable individual retirement arrangement distribution: $14,986 (reported on 6.1% of returns)
37032:
$14,986
Tennessee:
$20,036
(% of AGI for various income ranges: 61.5% for AGIs below $25k, 56.4% for AGIs $25k-50k, 216.2% for AGIs $50k-75k, 162.6% for AGIs $75k-100k, 343.3% for AGIs $100k-200k)
Total itemized deductions: $35,567 (reported on 3.9% of returns)
Here:
$35,567
State:
$40,136
(% of AGI for various income ranges: 415.8% for AGIs $50k-75k, 497.1% for AGIs $100k-200k, 5795.0% for AGIs over 200k)
Charity contributions: $18,625 (reported on 3.5% of returns)
Here:
$18,625
State:
$19,852
(% of AGI for various income ranges: 44.9% for AGIs $25k-50k, 270.0% for AGIs $100k-200k, 3605.0% for AGIs over 200k)
Taxes paid: $4,800 (reported on 3.9% of returns)
37032:
$4,800
State:
$6,038
(% of AGI for various income ranges: 52.1% for AGIs $50k-75k, 68.6% for AGIs $100k-200k, 815.0% for AGIs over 200k)
Earned income credit: $2,334 (reported on 14.0% of returns)
Here:
$2,334
State:
$2,391
(% of AGI for various income ranges: 89.6% for AGIs below $25k, 70.4% for AGIs $25k-50k)
Percentage of individuals using paid preparers for their 2020 taxes: 91.2%
Here:
91%
State:
93%
(% for various income ranges: 87.7% for AGIs below $25k, 92.9% for AGIs $25k-50k, 93.8% for AGIs $50k-75k, 92.3% for AGIs $75k-100k, 91.4% for AGIs $100k-200k, 100.0% for AGIs over 200k)
Averages for the 2012 tax year for zip code 37032, filed in 2013:
Average Adjusted Gross Income (AGI) in 2012: $48,562 (Individual Income Tax Returns)
Here:
$48,562
State:
$53,767
Salary/wage: $43,627 (reported on 86.2% of returns)
Here:
$43,627
State:
$45,421
(% of AGI for various income ranges: 77.1% for AGIs below $25k, 83.9% for AGIs $25k-50k, 78.6% for AGIs $50k-75k, 81.8% for AGIs $75k-100k, 79.0% for AGIs $100k-200k, 55.9% for AGIs over 200k)
Taxable interest for individuals: $916 (reported on 29.2% of returns)
This zip code:
$916
Tennessee:
$1,732
(% of AGI for various income ranges: 1.0% for AGIs below $25k, 0.3% for AGIs $25k-50k, 0.9% for AGIs $50k-75k, 0.4% for AGIs $75k-100k, 0.2% for AGIs $100k-200k, 0.8% for AGIs over 200k)
Ordinary dividends: $1,390 (reported on 10.3% of returns)
Here:
$1,390
State:
$6,739
(% of AGI for various income ranges: 0.4% for AGIs below $25k, 0.3% for AGIs $25k-50k, 0.4% for AGIs $50k-75k, 0.2% for AGIs $75k-100k, 0.3% for AGIs $100k-200k)
Net capital gain/loss in AGI: +$8,942 (reported on 12.3% of returns)
Here:
+$8,942
State:
+$19,082
(% of AGI for various income ranges: 0.6% for AGIs below $25k, 0.8% for AGIs $25k-50k, 1.1% for AGIs $50k-75k, 1.5% for AGIs $75k-100k, 7.2% for AGIs $100k-200k)
Profit/loss from business: +$9,522 (reported on 16.4% of returns)
Here:
+$9,522
State:
+$15,240
(% of AGI for various income ranges: 9.3% for AGIs below $25k, 3.7% for AGIs $25k-50k, 2.4% for AGIs $50k-75k, 3.7% for AGIs $75k-100k, 2.3% for AGIs $100k-200k)
Taxable individual retirement arrangement distribution: $12,450 (reported on 7.2% of returns)
37032:
$12,450
Tennessee:
$15,505
(% of AGI for various income ranges: 3.2% for AGIs below $25k, 1.6% for AGIs $25k-50k, 2.8% for AGIs $50k-75k, 3.0% for AGIs $100k-200k)
Total itemized deductions: $19,305 (21% of AGI, reported on 22.6% of returns)
Here:
$19,305
State:
$21,976
Here:
20.8% of AGI
State:
17.8% of AGI
(% of AGI for various income ranges: 7.4% for AGIs below $25k, 7.1% for AGIs $25k-50k, 10.0% for AGIs $50k-75k, 8.8% for AGIs $75k-100k, 11.8% for AGIs $100k-200k, 6.7% for AGIs over 200k)
Charity contributions: $4,542 (reported on 16.9% of returns)
Here:
$4,542
State:
$6,709
(% of AGI for various income ranges: 0.7% for AGIs below $25k, 0.7% for AGIs $25k-50k, 1.3% for AGIs $50k-75k, 1.5% for AGIs $75k-100k, 2.5% for AGIs $100k-200k, 2.5% for AGIs over 200k)
Taxes paid: $3,795 (reported on 22.6% of returns)
37032:
$3,795
State:
$4,829
(% of AGI for various income ranges: 1.1% for AGIs below $25k, 1.2% for AGIs $25k-50k, 1.7% for AGIs $50k-75k, 1.8% for AGIs $75k-100k, 2.9% for AGIs $100k-200k, 1.3% for AGIs over 200k)
Earned income credit: $2,466 (reported on 19.5% of returns)
Here:
$2,466
State:
$2,404
(% of AGI for various income ranges: 6.9% for AGIs below $25k, 1.6% for AGIs $25k-50k)
Percentage of individuals using paid preparers for their 2012 taxes: 55.4%
Here:
55%
State:
52%
(% for various income ranges: 52.6% for AGIs below $25k, 55.8% for AGIs $25k-50k, 53.3% for AGIs $50k-75k, 66.7% for AGIs $75k-100k, 56.2% for AGIs $100k-200k, 66.7% for AGIs over 200k)
Averages for the 2004 tax year for zip code 37032, filed in 2005:
Average Adjusted Gross Income (AGI) in 2004: $38,052 (Individual Income Tax Returns)
Here:
$38,052
State:
$44,088
Salary/wage: $36,350 (reported on 85.1% of returns)
Here:
$36,350
State:
$38,825
(% of AGI for various income ranges: 186.9% for AGIs below $10k, 75.7% for AGIs $10k-25k, 85.4% for AGIs $25k-50k, 91.5% for AGIs $50k-75k, 89.8% for AGIs $75k-100k, 56.0% for AGIs over 100k)
Taxable interest for individuals: $1,219 (reported on 34.9% of returns)
This zip code:
$1,219
Tennessee:
$1,802
(% of AGI for various income ranges: 11.1% for AGIs below $10k, 2.6% for AGIs $10k-25k, 0.9% for AGIs $25k-50k, 0.6% for AGIs $50k-75k, 0.2% for AGIs $75k-100k, 1.2% for AGIs over 100k)
Taxable dividends: $1,531 (reported on 13.0% of returns)
Here:
$1,531
State:
$3,727
(% of AGI for various income ranges: 2.4% for AGIs below $10k, 0.3% for AGIs $10k-25k, 0.3% for AGIs $25k-50k, 0.2% for AGIs $50k-75k, 0.0% for AGIs $75k-100k, 1.6% for AGIs over 100k)
Net capital gain/loss: +$11,493 (reported on 12.8% of returns)
Here:
+$11,493
State:
+$15,776
(% of AGI for various income ranges: 7.6% for AGIs below $10k, 1.0% for AGIs $10k-25k, 1.7% for AGIs $25k-50k, 0.6% for AGIs $50k-75k, 1.8% for AGIs $75k-100k, 13.4% for AGIs over 100k)
Profit/loss from business: +$7,642 (reported on 19.1% of returns)
Here:
+$7,642
State:
+$12,882
(% of AGI for various income ranges: 20.5% for AGIs below $10k, 9.1% for AGIs $10k-25k, 4.8% for AGIs $25k-50k, 0.6% for AGIs $50k-75k, 1.1% for AGIs $75k-100k, 4.6% for AGIs over 100k)
IRA payment deduction: $2,500 (reported on 1.4% of returns)
37032:
$2,500
Tennessee:
$2,934
Total itemized deductions: $15,119 (23% of AGI, reported on 25.5% of returns)
Here:
$15,119
State:
$18,035
Here:
22.7% of AGI
State:
19.9% of AGI
(% of AGI for various income ranges: 10.6% for AGIs $10k-25k, 8.5% for AGIs $25k-50k, 11.2% for AGIs $50k-75k, 11.9% for AGIs $75k-100k, 10.0% for AGIs over 100k)
Charity contributions deductions: $3,802 (5% of AGI, reported on 20.2% of returns)
Here:
$3,802
State:
$5,167
Here:
5.2% of AGI
State:
5.3% of AGI
(% of AGI for various income ranges: 1.1% for AGIs $10k-25k, 1.3% for AGIs $25k-50k, 1.8% for AGIs $50k-75k, 2.5% for AGIs $75k-100k, 3.6% for AGIs over 100k)
Total tax: $4,774 (reported on 76.4% of returns)
37032:
$4,774
State:
$7,482
(% of AGI for various income ranges: 8.6% for AGIs below $10k, 5.1% for AGIs $10k-25k, 6.3% for AGIs $25k-50k, 8.1% for AGIs $50k-75k, 10.4% for AGIs $75k-100k, 17.5% for AGIs over 100k)
Earned income credit: $1,873 (reported on 17.5% of returns)
Here:
$1,873
State:
$1,826
Percentage of individuals using paid preparers for their 2004 taxes: 64.7%
Here:
65%
State:
60%
(% for various income ranges: 60.7% for AGIs below $10k, 67.4% for AGIs $10k-25k, 63.3% for AGIs $25k-50k, 64.6% for AGIs $50k-75k, 67.3% for AGIs $75k-100k, 71.6% for AGIs over 100k)
Household received Food Stamps/SNAP in the past 12 months: 118 Household did not receive Food Stamps/SNAP in the past 12 months: 2,003
Women who had a birth in the past 12 months: 214 (206 now married, 11 unmarried) Women who did not have a birth in the past 12 months: 1,113 (565 now married, 548 unmarried)
Housing units in zip code 37032 with a mortgage: 1,223 (35 second mortgage, 35 both second mortgage and home equity loan) Houses without a mortgage: 14
Median monthly owner costs for units with a mortgage: $1,512 Median monthly owner costs for units without a mortgage: $491
Residents with income below the poverty level in 2022:
This zip code:
6.4%
Whole state:
13.3%
Residents with income below 50% of the poverty level in 2022:
This zip code:
3.2%
Whole state:
7.1%
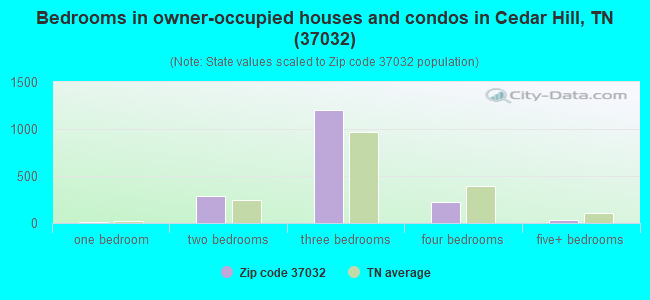
Median number of rooms in houses and condos:
Here:
6.0
State:
6.5
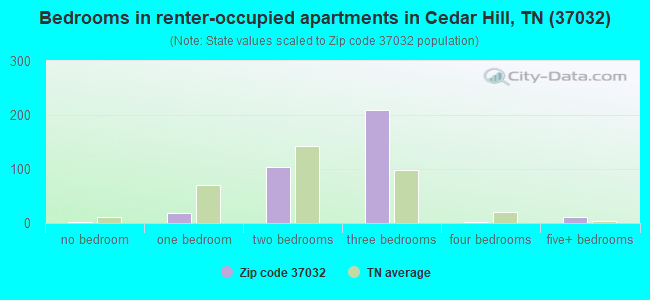
Median number of rooms in apartments:
Here:
5.8
State:
4.4
Notable locations in this zip code not listed on our city pages
Notable locations in zip code 37032: Pleasant View Volunteer Fire Department Station 3 (A), Robertson County Rescue Squad and Fire Department (B). Display/hide their locations on the map
Churches in zip code 37032 include: Porters Chapel (A), Fykes Grove Church (B), Saint Michaels Church (C), Jones Chapel (D), Heads Church (E), Oakwood Church (F), Mount Herman Church (G), Flewellyn Baptist Church (H), Cedar Hill Baptist Church (I). Display/hide their locations on the map
Cemeteries: Billy Cothron Cemetery (1), Kane-David Cemetery (2), Bartlett Cemetery (3), Woodard Cemetery (4), Whitehead Cemetery (5), Winn Cemetery (6), Washington Cemetery (7). Display/hide their locations on the map
In group quarters: 2 (-1 institutionalized population)
Size of family households: 707 2-persons, 245 3-persons, 433 4-persons, 129 5-persons, 128 6-persons, 16 7-or-more-persons
Size of nonfamily households: 348 1-person, 98 2-persons
1,224 married couples with children.
74 single-parent households (8 men, 66 women).
99.3% of residents of 37032 zip code speak English at home.
0.2% of residents speak other Indo-European language at home (100% very well).
Foreign born population: 32 (0.5%) (100.0% of them are naturalized citizens)
This zip code:
0.5%
Whole state:
5.6%
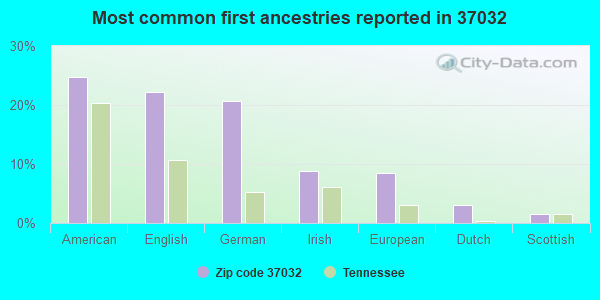
25%American
22%English
21%German
9%Irish
9%European
3%Dutch
2%Scottish
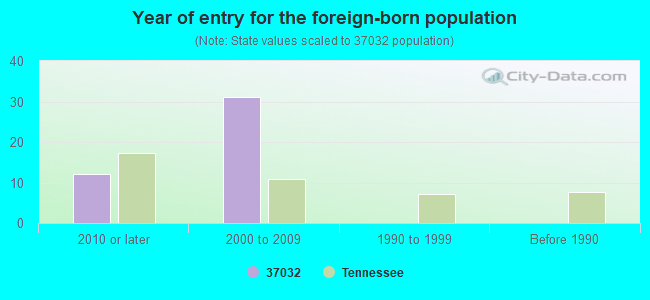
Year of entry for the foreign-born population
122010 or later
312000 to 2009
01990 to 1999
0Before 1990
Housing units lacking complete plumbing facilities: 3.1% Housing units lacking complete kitchen facilities: 3.3%
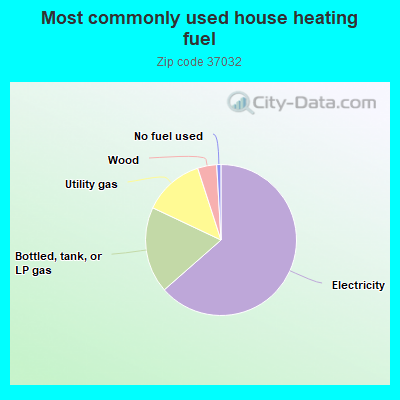
63.6%Electricity
18.5%Bottled, tank, or LP gas
13.0%Utility gas
4.1%Wood
0.9%No fuel used
Population in 1990: 2,527. Population change in the 1990s: +744 (+29.4%).
Place of birth for U.S.-born residents:
This state: 4,354
Northeast: 104
Midwest: 446
South: 806
West: 119
63% of the 37032 zip code residents lived in the same house 5 years ago. Out of people who lived in different houses, 53% lived in this county. Out of people who lived in different counties, 50% lived in Tennessee.
94% of the 37032 zip code residents lived in the same house 1 year ago. Out of people who lived in different houses, 29% moved from this county. Out of people who lived in different houses, 39% moved from different county within same state. Out of people who lived in different houses, 41% moved from different state.
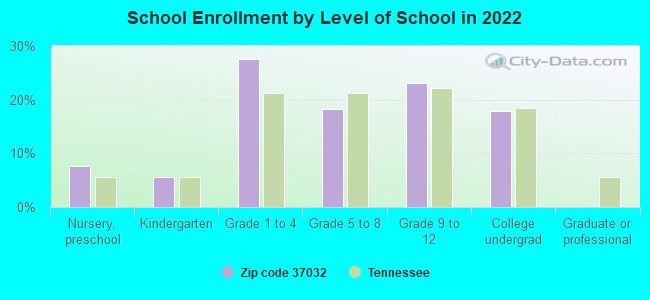
Private vs. public school enrollment:
Students in private schools in grades 1 to 8 (elementary and middle school): 50
Here:
9.3%
Tennessee:
15.0%
Students in private schools in grades 9 to 12 (high school): 16
Here:
6.1%
Tennessee:
16.2%
Students in private undergraduate colleges: 21
Here:
9.6%
Tennessee:
23.5%
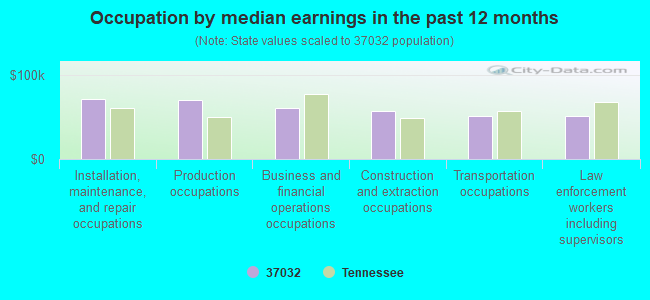
Occupation by median earnings in the past 12 months ($)
71,729Installation, maintenance, and repair occupations
69,973Production occupations
60,661Business and financial operations occupations
57,177Construction and extraction occupations
51,157Transportation occupations
50,695Law enforcement workers including supervisors
Top industries in this zip code by the number of employees in 2005:
Other Services (except Public Administration): Religious Organizations (5-9 employees: 1 establishment, 1-4 employees: 3 establishments)
Construction: New Single-Family Housing Construction (except Operative Builders) (5-9: 1, 1-4: 1)
Health Care and Social Assistance: Homes for the Elderly (5-9: 1, 1-4: 1)
Construction: Plumbing, Heating, and Air-Conditioning Contractors (1-4: 4)
Fatal accident statistics in 2013:
Fatal accident count: 2
Vehicles involved in fatal accidents: 3
Fatal accidents caused by drunken drivers: 0
Fatalities: 3
Persons involved in fatal accidents: 4
Pedestrians involved in fatal accidents: 0
Fatal accident statistics in 2012:
Fatal accident count: 3
Vehicles involved in fatal accidents: 4
Fatal accidents caused by drunken drivers: 1
Fatalities: 3
Persons involved in fatal accidents: 4
Pedestrians involved in fatal accidents: 0
Home Mortgage Disclosure Act Aggregated Statistics For Year 2009 (Based on 6 partial tracts)
A) FHA, FSA/RHS & VA Home Purchase Loans
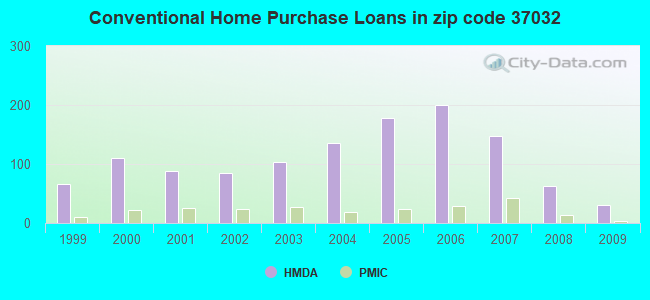
B) Conventional Home Purchase Loans
C) Refinancings
D) Home Improvement Loans
F) Non-occupant Loans on < 5 Family Dwellings (A B C & D)
G) Loans On Manufactured Home Dwelling (A B C & D)
Number
Average Value
Number
Average Value
Number
Average Value
Number
Average Value
Number
Average Value
Number
Average Value
LOANS ORIGINATED
56
$183,164
31
$148,358
279
$175,503
11
$73,001
12
$102,646
22
$73,047
APPLICATIONS APPROVED, NOT ACCEPTED
2
$170,480
2
$168,050
19
$150,772
3
$14,723
1
$76,330
2
$47,730
APPLICATIONS DENIED
7
$171,471
10
$104,193
97
$173,536
7
$25,679
5
$64,070
9
$87,747
APPLICATIONS WITHDRAWN
5
$151,686
4
$166,015
55
$165,409
2
$62,115
2
$60,975
1
$92,850
FILES CLOSED FOR INCOMPLETENESS
3
$139,030
0
$0
8
$174,142
1
$123,680
0
$0
0
$0
Aggregated Statistics For Year 2008 (Based on 6 partial tracts)
A) FHA, FSA/RHS & VA Home Purchase Loans
B) Conventional Home Purchase Loans
C) Refinancings
D) Home Improvement Loans
F) Non-occupant Loans on < 5 Family Dwellings (A B C & D)
G) Loans On Manufactured Home Dwelling (A B C & D)
Number
Average Value
Number
Average Value
Number
Average Value
Number
Average Value
Number
Average Value
Number
Average Value
LOANS ORIGINATED
41
$145,589
63
$179,049
188
$148,208
25
$81,608
26
$116,409
30
$68,687
APPLICATIONS APPROVED, NOT ACCEPTED
1
$191,570
7
$121,500
18
$209,003
2
$26,180
4
$209,665
3
$93,743
APPLICATIONS DENIED
9
$177,976
17
$148,073
96
$154,157
31
$49,717
4
$151,000
17
$86,834
APPLICATIONS WITHDRAWN
8
$162,725
10
$163,069
45
$173,328
3
$85,350
1
$55,940
4
$108,502
FILES CLOSED FOR INCOMPLETENESS
3
$122,673
1
$350,360
9
$166,311
1
$69,430
0
$0
2
$81,770
Aggregated Statistics For Year 2007 (Based on 6 partial tracts)
A) FHA, FSA/RHS & VA Home Purchase Loans
B) Conventional Home Purchase Loans
C) Refinancings
D) Home Improvement Loans
F) Non-occupant Loans on < 5 Family Dwellings (A B C & D)
G) Loans On Manufactured Home Dwelling (A B C & D)
Number
Average Value
Number
Average Value
Number
Average Value
Number
Average Value
Number
Average Value
Number
Average Value
LOANS ORIGINATED
40
$157,587
147
$161,904
176
$146,669
24
$49,887
20
$112,316
38
$99,391
APPLICATIONS APPROVED, NOT ACCEPTED
2
$136,280
16
$153,482
26
$153,132
9
$29,928
1
$82,420
4
$92,962
APPLICATIONS DENIED
12
$157,734
31
$142,872
110
$138,766
31
$49,765
5
$129,850
19
$90,901
APPLICATIONS WITHDRAWN
7
$115,754
20
$200,714
51
$133,413
2
$51,105
2
$175,670
9
$95,666
FILES CLOSED FOR INCOMPLETENESS
1
$164,150
8
$111,071
9
$179,438
0
$0
1
$88,710
0
$0
Aggregated Statistics For Year 2006 (Based on 6 partial tracts)
A) FHA, FSA/RHS & VA Home Purchase Loans
B) Conventional Home Purchase Loans
C) Refinancings
D) Home Improvement Loans
F) Non-occupant Loans on < 5 Family Dwellings (A B C & D)
G) Loans On Manufactured Home Dwelling (A B C & D)
Number
Average Value
Number
Average Value
Number
Average Value
Number
Average Value
Number
Average Value
Number
Average Value
LOANS ORIGINATED
34
$159,244
200
$138,892
158
$123,908
25
$29,986
21
$114,215
32
$83,774
APPLICATIONS APPROVED, NOT ACCEPTED
2
$158,255
19
$121,769
31
$108,205
4
$25,565
7
$73,557
11
$75,620
APPLICATIONS DENIED
4
$120,380
39
$128,091
111
$136,153
30
$46,425
11
$102,026
19
$90,656
APPLICATIONS WITHDRAWN
9
$123,343
30
$109,387
76
$147,375
6
$55,663
3
$102,480
7
$124,106
FILES CLOSED FOR INCOMPLETENESS
0
$0
5
$101,312
20
$140,399
0
$0
1
$43,620
0
$0
Aggregated Statistics For Year 2005 (Based on 6 partial tracts)
A) FHA, FSA/RHS & VA Home Purchase Loans
B) Conventional Home Purchase Loans
C) Refinancings
D) Home Improvement Loans
E) Loans on Dwellings For 5+ Families
F) Non-occupant Loans on < 5 Family Dwellings (A B C & D)
G) Loans On Manufactured Home Dwelling (A B C & D)
Number
Average Value
Number
Average Value
Number
Average Value
Number
Average Value
Number
Average Value
Number
Average Value
Number
Average Value
LOANS ORIGINATED
45
$142,099
178
$126,847
167
$127,000
32
$45,827
1
$189,880
21
$150,396
36
$109,260
APPLICATIONS APPROVED, NOT ACCEPTED
0
$0
16
$109,892
33
$102,427
4
$31,150
0
$0
2
$36,595
6
$79,237
APPLICATIONS DENIED
7
$142,149
45
$105,227
146
$114,883
24
$41,816
0
$0
4
$69,675
32
$77,327
APPLICATIONS WITHDRAWN
4
$143,558
21
$151,694
125
$135,735
7
$151,594
0
$0
5
$151,742
11
$102,822
FILES CLOSED FOR INCOMPLETENESS
1
$132,010
7
$115,944
15
$121,003
1
$77,140
0
$0
0
$0
2
$63,260
Aggregated Statistics For Year 2004 (Based on 6 partial tracts)
A) FHA, FSA/RHS & VA Home Purchase Loans
B) Conventional Home Purchase Loans
C) Refinancings
D) Home Improvement Loans
F) Non-occupant Loans on < 5 Family Dwellings (A B C & D)
G) Loans On Manufactured Home Dwelling (A B C & D)
Number
Average Value
Number
Average Value
Number
Average Value
Number
Average Value
Number
Average Value
Number
Average Value
LOANS ORIGINATED
32
$134,712
136
$114,203
183
$116,137
19
$54,719
17
$76,264
38
$71,239
APPLICATIONS APPROVED, NOT ACCEPTED
2
$143,300
20
$92,398
35
$116,311
5
$36,546
2
$48,600
11
$55,195
APPLICATIONS DENIED
7
$96,300
31
$91,618
181
$105,078
21
$33,319
7
$106,750
41
$73,782
APPLICATIONS WITHDRAWN
4
$118,815
19
$97,353
108
$119,834
3
$62,020
5
$71,278
18
$93,678
FILES CLOSED FOR INCOMPLETENESS
1
$75,600
7
$115,801
13
$131,447
2
$56,680
0
$0
0
$0
Aggregated Statistics For Year 2003 (Based on 6 partial tracts)
A) FHA, FSA/RHS & VA Home Purchase Loans
B) Conventional Home Purchase Loans
C) Refinancings
D) Home Improvement Loans
F) Non-occupant Loans on < 5 Family Dwellings (A B C & D)
Number
Average Value
Number
Average Value
Number
Average Value
Number
Average Value
Number
Average Value
LOANS ORIGINATED
41
$128,813
103
$119,773
417
$108,179
9
$33,798
18
$62,322
APPLICATIONS APPROVED, NOT ACCEPTED
0
$0
14
$88,569
56
$110,928
2
$17,560
1
$94,810
APPLICATIONS DENIED
9
$110,890
23
$88,091
166
$105,020
20
$27,942
8
$80,572
APPLICATIONS WITHDRAWN
6
$99,667
14
$106,540
116
$111,236
5
$74,126
2
$85,255
FILES CLOSED FOR INCOMPLETENESS
0
$0
5
$116,748
14
$123,237
2
$11,570
0
$0
Aggregated Statistics For Year 2002 (Based on 6 partial tracts)
A) FHA, FSA/RHS & VA Home Purchase Loans
B) Conventional Home Purchase Loans
C) Refinancings
D) Home Improvement Loans
F) Non-occupant Loans on < 5 Family Dwellings (A B C & D)
Number
Average Value
Number
Average Value
Number
Average Value
Number
Average Value
Number
Average Value
LOANS ORIGINATED
36
$124,603
85
$104,887
304
$109,864
14
$17,248
15
$71,893
APPLICATIONS APPROVED, NOT ACCEPTED
2
$73,330
13
$122,445
52
$95,483
4
$9,870
3
$82,930
APPLICATIONS DENIED
6
$114,238
35
$56,075
124
$105,243
12
$19,359
3
$30,400
APPLICATIONS WITHDRAWN
3
$137,403
6
$76,058
71
$109,224
2
$54,695
1
$59,140
FILES CLOSED FOR INCOMPLETENESS
2
$102,530
1
$40,880
22
$117,495
1
$20,260
1
$64,880
Aggregated Statistics For Year 2001 (Based on 6 partial tracts)
A) FHA, FSA/RHS & VA Home Purchase Loans
B) Conventional Home Purchase Loans
C) Refinancings
D) Home Improvement Loans
F) Non-occupant Loans on < 5 Family Dwellings (A B C & D)
Number
Average Value
Number
Average Value
Number
Average Value
Number
Average Value
Number
Average Value
LOANS ORIGINATED
38
$115,524
88
$98,422
261
$104,256
26
$30,244
17
$106,419
APPLICATIONS APPROVED, NOT ACCEPTED
0
$0
16
$87,761
49
$111,382
3
$17,240
2
$100,490
APPLICATIONS DENIED
5
$108,702
35
$75,327
134
$99,504
20
$26,448
1
$56,000
APPLICATIONS WITHDRAWN
6
$119,017
9
$91,506
83
$96,950
1
$61,100
2
$64,025
FILES CLOSED FOR INCOMPLETENESS
0
$0
1
$7,180
15
$116,497
0
$0
0
$0
Aggregated Statistics For Year 2000 (Based on 6 partial tracts)
A) FHA, FSA/RHS & VA Home Purchase Loans
B) Conventional Home Purchase Loans
C) Refinancings
D) Home Improvement Loans
F) Non-occupant Loans on < 5 Family Dwellings (A B C & D)
Number
Average Value
Number
Average Value
Number
Average Value
Number
Average Value
Number
Average Value
LOANS ORIGINATED
37
$112,862
110
$93,458
117
$86,404
23
$14,616
12
$66,501
APPLICATIONS APPROVED, NOT ACCEPTED
4
$64,590
20
$66,950
40
$85,632
7
$31,480
2
$62,685
APPLICATIONS DENIED
6
$96,595
68
$64,426
128
$80,271
20
$26,202
8
$69,312
APPLICATIONS WITHDRAWN
4
$80,972
15
$79,411
68
$71,530
1
$2,570
2
$47,440
FILES CLOSED FOR INCOMPLETENESS
0
$0
6
$73,367
22
$84,862
0
$0
0
$0
Aggregated Statistics For Year 1999 (Based on 3 partial tracts)
A) FHA, FSA/RHS & VA Home Purchase Loans
B) Conventional Home Purchase Loans
C) Refinancings
D) Home Improvement Loans
F) Non-occupant Loans on < 5 Family Dwellings (A B C & D)
2002 - 2018 National Fire Incident Reporting System (NFIRS) incidents
Based on the data from the years 2002 - 2018 the average number of fires per year is 16. The highest number of reported fires - 28 took place in 2017, and the least - 6 in 2012. The data has a rising trend.
When looking into fire subcategories, the most incidents belonged to: Outside Fires (39.3%), and Structure Fires (34.9%).
Fire incident types reported to NFIRS in Zip Code 37032


 Nearest zip codes: 37010, 37146, 37172, 42204, 37035, 42265.
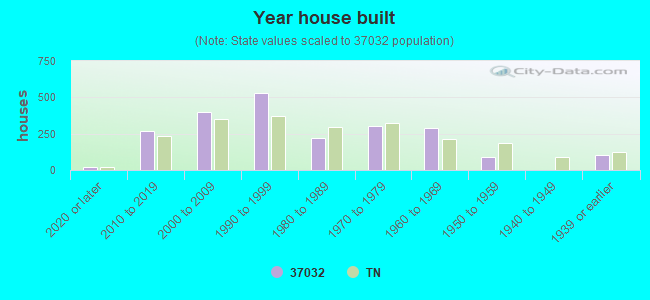


 Based on the data from the years 2002 - 2018 the average number of fires per year is 16. The highest number of reported fires - 28 took place in 2017, and the least - 6 in 2012. The data has a rising trend.
 When looking into fire subcategories, the most incidents belonged to: Outside Fires (39.3%), and Structure Fires (34.9%).