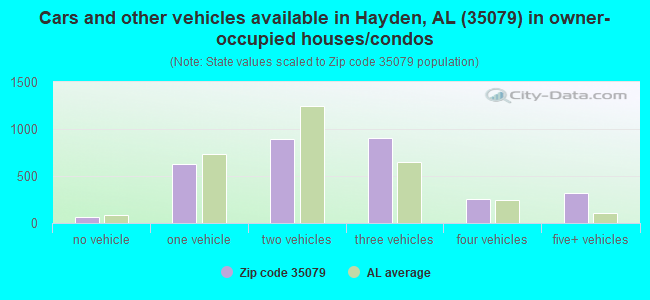
Estimated zip code population in 2022: 9,386 Zip code population in 2010: 8,810 Zip code population in 2000: 7,150
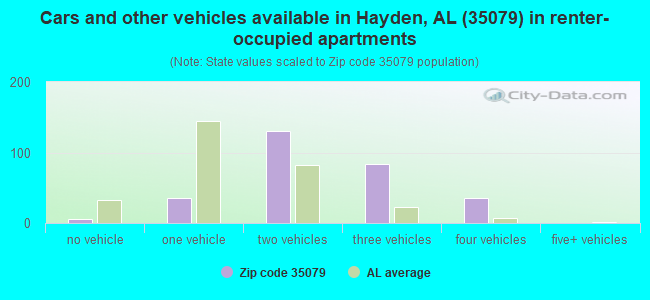
Houses and condos: 3,749 Renter-occupied apartments: 289
% of renters here:
9%
State:
30%
March 2022 cost of living index in zip code 35079: 81.6 (low, U.S. average is 100)
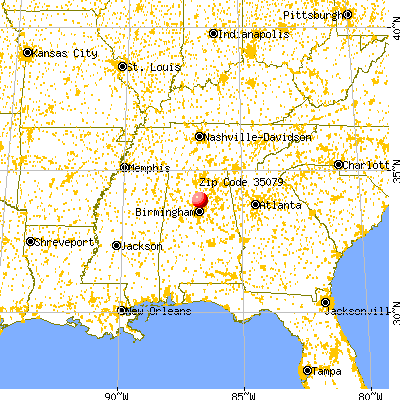
Land area: 106.1 sq. mi. Water area: 0.5 sq. mi.
Population density: 88 people per square mile
(very low).
OSM Map
General Map
Google Map
MSN Map
OSM Map
General Map
Google Map
MSN Map
OSM Map
General Map
Google Map
MSN Map
OSM Map
General Map
Google Map
MSN Map
Please wait while loading the map...
Real estate property taxes paid for housing units in 2022:
This zip code:
0.3% ($550)
Alabama:
0.4% ($718)
Median real estate property taxes paid for housing units with mortgages in 2022: $644 (0.3%) Median real estate property taxes paid for housing units with no mortgage in 2022: $349 (0.3%)
Business Search- 14 Million verified businesses
Males: 4,751
(50.6%)
Females: 4,633
(49.4%)
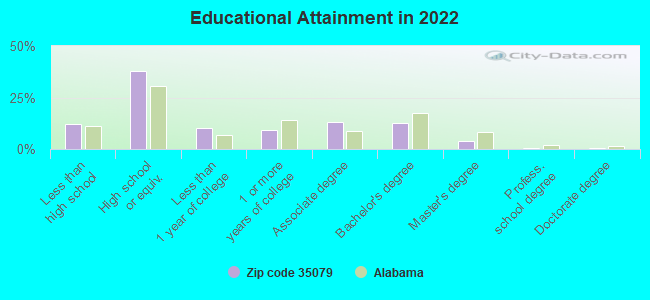
For population 25 years and over in 35079:
High school or higher: 87.6%
Bachelor's degree or higher: 17.5%
Graduate or professional degree: 4.9%
Unemployed: 5.6%
Mean travel time to work (commute): 38.5 minutes
For population 15 years and over in 35079:
Never married: 24.2%
Now married: 57.5%
Separated: 0.7%
Widowed: 4.4%
Divorced: 13.2%
Zip code 35079 compared to state average:
Black race population percentage significantly below state average.
Hispanic race population percentage below state average.
Foreign-born population percentage significantly below state average.
Renting percentage significantly below state average.
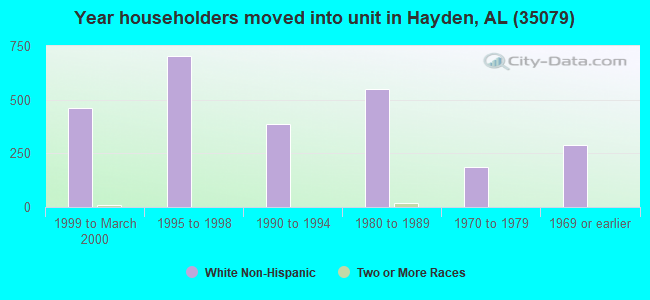
Length of stay since moving in significantly above state average.
House age below state average.
Percentage of population with a bachelor's degree or higher below state average.
Averages for the 2020 tax year for zip code 35079, filed in 2021:
Average Adjusted Gross Income (AGI) in 2020: $57,761 (Individual Income Tax Returns)
Here:
$57,761
State:
$63,984
Salary/wage: $52,335 (reported on 85.4% of returns)
Here:
$52,335
State:
$52,834
(% of AGI for various income ranges: 1254.0% for AGIs below $25k, 3581.1% for AGIs $25k-50k, 6569.2% for AGIs $50k-75k, 9653.6% for AGIs $75k-100k, 16764.1% for AGIs $100k-200k, 63510.0% for AGIs over 200k)
Taxable interest for individuals: $704 (reported on 22.9% of returns)
This zip code:
$704
Alabama:
$1,615
(% of AGI for various income ranges: 12.0% for AGIs below $25k, 15.9% for AGIs $25k-50k, 16.4% for AGIs $50k-75k, 24.2% for AGIs $75k-100k, 55.0% for AGIs $100k-200k, 265.0% for AGIs over 200k)
Ordinary dividends: $1,720 (reported on 7.6% of returns)
Here:
$1,720
State:
$7,660
(% of AGI for various income ranges: 8.7% for AGIs below $25k, 13.6% for AGIs $25k-50k, 9.4% for AGIs $50k-75k, 6.9% for AGIs $75k-100k, 41.2% for AGIs $100k-200k, 605.0% for AGIs over 200k)
Net capital gain/loss in AGI: +$9,363 (reported on 6.8% of returns)
Here:
+$9,363
State:
+$23,528
(% of AGI for various income ranges: 1.4% for AGIs below $25k, 14.5% for AGIs $25k-50k, 44.0% for AGIs $50k-75k, 33.9% for AGIs $75k-100k, 261.8% for AGIs $100k-200k, 5805.0% for AGIs over 200k)
Profit/loss from business: +$8,607 (reported on 14.6% of returns)
Here:
+$8,607
State:
+$9,534
(% of AGI for various income ranges: 101.0% for AGIs below $25k, 139.7% for AGIs $25k-50k, 114.2% for AGIs $50k-75k, 219.7% for AGIs $75k-100k, 482.1% for AGIs $100k-200k)
Taxable individual retirement arrangement distribution: $14,848 (reported on 6.8% of returns)
35079:
$14,848
Alabama:
$19,004
(% of AGI for various income ranges: 48.6% for AGIs below $25k, 89.6% for AGIs $25k-50k, 132.1% for AGIs $50k-75k, 131.1% for AGIs $75k-100k, 508.2% for AGIs $100k-200k)
Total itemized deductions: $31,282 (reported on 4.3% of returns)
Here:
$31,282
State:
$37,338
(% of AGI for various income ranges: 94.5% for AGIs $25k-50k, 144.2% for AGIs $50k-75k, 133.1% for AGIs $75k-100k, 509.4% for AGIs $100k-200k, 8170.0% for AGIs over 200k)
Charity contributions: $15,507 (reported on 3.5% of returns)
Here:
$15,507
State:
$18,005
(% of AGI for various income ranges: 13.0% for AGIs below $25k, 65.7% for AGIs $50k-75k, 182.9% for AGIs $100k-200k, 5420.0% for AGIs over 200k)
Taxes paid: $6,250 (reported on 4.0% of returns)
35079:
$6,250
State:
$6,484
(% of AGI for various income ranges: 9.7% for AGIs $25k-50k, 23.4% for AGIs $50k-75k, 30.0% for AGIs $75k-100k, 112.6% for AGIs $100k-200k, 1560.0% for AGIs over 200k)
Earned income credit: $2,245 (reported on 16.4% of returns)
Here:
$2,245
State:
$2,628
(% of AGI for various income ranges: 100.0% for AGIs below $25k, 72.9% for AGIs $25k-50k, 2.3% for AGIs $50k-75k)
Percentage of individuals using paid preparers for their 2020 taxes: 94.7%
Here:
95%
State:
93%
(% for various income ranges: 93.8% for AGIs below $25k, 93.5% for AGIs $25k-50k, 95.6% for AGIs $50k-75k, 95.8% for AGIs $75k-100k, 96.2% for AGIs $100k-200k, 100.0% for AGIs over 200k)
Averages for the 2012 tax year for zip code 35079, filed in 2013:
Average Adjusted Gross Income (AGI) in 2012: $48,277 (Individual Income Tax Returns)
Here:
$48,277
State:
$52,001
Salary/wage: $45,343 (reported on 85.4% of returns)
Here:
$45,343
State:
$43,822
(% of AGI for various income ranges: 72.5% for AGIs below $25k, 81.8% for AGIs $25k-50k, 85.6% for AGIs $50k-75k, 86.2% for AGIs $75k-100k, 81.4% for AGIs $100k-200k, 48.1% for AGIs over 200k)
Taxable interest for individuals: $803 (reported on 25.9% of returns)
This zip code:
$803
Alabama:
$1,592
(% of AGI for various income ranges: 1.0% for AGIs below $25k, 0.6% for AGIs $25k-50k, 0.3% for AGIs $50k-75k, 0.2% for AGIs $75k-100k, 0.2% for AGIs $100k-200k, 1.0% for AGIs over 200k)
Ordinary dividends: $1,500 (reported on 8.5% of returns)
Here:
$1,500
State:
$5,697
(% of AGI for various income ranges: 0.6% for AGIs below $25k, 0.2% for AGIs $25k-50k, 0.2% for AGIs $50k-75k, 0.2% for AGIs $75k-100k, 0.4% for AGIs $100k-200k)
Net capital gain/loss in AGI: +$5,011 (reported on 5.5% of returns)
Here:
+$5,011
State:
+$13,286
(% of AGI for various income ranges: 0.1% for AGIs below $25k, 0.1% for AGIs $25k-50k, 2.7% for AGIs $100k-200k)
Profit/loss from business: +$7,762 (reported on 16.0% of returns)
Here:
+$7,762
State:
+$9,151
(% of AGI for various income ranges: 9.1% for AGIs below $25k, 2.6% for AGIs $25k-50k, 1.9% for AGIs $50k-75k, 2.0% for AGIs $75k-100k, 2.0% for AGIs $100k-200k)
Taxable individual retirement arrangement distribution: $13,232 (reported on 7.3% of returns)
35079:
$13,232
Alabama:
$14,992
(% of AGI for various income ranges: 2.8% for AGIs below $25k, 1.6% for AGIs $25k-50k, 1.3% for AGIs $50k-75k, 1.8% for AGIs $75k-100k, 3.7% for AGIs $100k-200k)
Total itemized deductions: $18,192 (23% of AGI, reported on 28.6% of returns)
Here:
$18,192
State:
$21,388
Here:
22.5% of AGI
State:
20.1% of AGI
(% of AGI for various income ranges: 7.9% for AGIs below $25k, 8.4% for AGIs $25k-50k, 10.7% for AGIs $50k-75k, 12.6% for AGIs $75k-100k, 12.7% for AGIs $100k-200k, 10.1% for AGIs over 200k)
Charity contributions: $4,209 (reported on 23.9% of returns)
Here:
$4,209
State:
$5,925
(% of AGI for various income ranges: 1.1% for AGIs below $25k, 1.4% for AGIs $25k-50k, 1.8% for AGIs $50k-75k, 2.3% for AGIs $75k-100k, 2.9% for AGIs $100k-200k, 3.3% for AGIs over 200k)
Taxes paid: $4,044 (reported on 28.3% of returns)
35079:
$4,044
State:
$5,272
(% of AGI for various income ranges: 0.8% for AGIs below $25k, 1.3% for AGIs $25k-50k, 2.0% for AGIs $50k-75k, 2.9% for AGIs $75k-100k, 3.4% for AGIs $100k-200k, 3.9% for AGIs over 200k)
Earned income credit: $2,381 (reported on 20.4% of returns)
Here:
$2,381
State:
$2,646
(% of AGI for various income ranges: 8.3% for AGIs below $25k, 1.3% for AGIs $25k-50k)
Percentage of individuals using paid preparers for their 2012 taxes: 63.3%
Here:
63%
State:
60%
(% for various income ranges: 61.0% for AGIs below $25k, 63.1% for AGIs $25k-50k, 66.2% for AGIs $50k-75k, 62.5% for AGIs $75k-100k, 66.7% for AGIs $100k-200k, 75.0% for AGIs over 200k)
Averages for the 2004 tax year for zip code 35079, filed in 2005:
Average Adjusted Gross Income (AGI) in 2004: $39,685 (Individual Income Tax Returns)
Here:
$39,685
State:
$42,302
Salary/wage: $37,950 (reported on 87.7% of returns)
Here:
$37,950
State:
$36,626
(% of AGI for various income ranges: 90.2% for AGIs below $10k, 77.7% for AGIs $10k-25k, 87.5% for AGIs $25k-50k, 90.5% for AGIs $50k-75k, 87.5% for AGIs $75k-100k, 64.4% for AGIs over 100k)
Taxable interest for individuals: $1,160 (reported on 33.7% of returns)
This zip code:
$1,160
Alabama:
$1,827
(% of AGI for various income ranges: 3.7% for AGIs below $10k, 2.4% for AGIs $10k-25k, 0.9% for AGIs $25k-50k, 0.6% for AGIs $50k-75k, 0.5% for AGIs $75k-100k, 1.0% for AGIs over 100k)
Taxable dividends: $710 (reported on 11.3% of returns)
Here:
$710
State:
$4,206
(% of AGI for various income ranges: 1.0% for AGIs below $10k, 0.3% for AGIs $10k-25k, 0.2% for AGIs $25k-50k, 0.1% for AGIs $50k-75k, 0.1% for AGIs $75k-100k, 0.2% for AGIs over 100k)
Net capital gain/loss: +$7,277 (reported on 8.4% of returns)
Here:
+$7,277
State:
+$13,031
(% of AGI for various income ranges: 0.7% for AGIs below $10k, 0.0% for AGIs $10k-25k, 0.8% for AGIs $25k-50k, 0.3% for AGIs $50k-75k, 0.2% for AGIs $75k-100k, 7.6% for AGIs over 100k)
Profit/loss from business: +$6,776 (reported on 16.1% of returns)
Here:
+$6,776
State:
+$8,302
(% of AGI for various income ranges: 4.1% for AGIs below $10k, 8.5% for AGIs $10k-25k, 2.3% for AGIs $25k-50k, 0.7% for AGIs $50k-75k, 2.7% for AGIs $75k-100k, 3.3% for AGIs over 100k)
IRA payment deduction: $3,180 (reported on 1.7% of returns)
35079:
$3,180
Alabama:
$3,006
Total itemized deductions: $15,378 (24% of AGI, reported on 30.8% of returns)
Here:
$15,378
State:
$17,623
Here:
23.8% of AGI
State:
20.8% of AGI
(% of AGI for various income ranges: 13.9% for AGIs below $10k, 8.6% for AGIs $10k-25k, 9.7% for AGIs $25k-50k, 12.9% for AGIs $50k-75k, 13.1% for AGIs $75k-100k, 14.6% for AGIs over 100k)
Charity contributions deductions: $3,331 (5% of AGI, reported on 27.1% of returns)
Here:
$3,331
State:
$4,768
Here:
5.0% of AGI
State:
5.4% of AGI
(% of AGI for various income ranges: 0.5% for AGIs below $10k, 1.4% for AGIs $10k-25k, 1.3% for AGIs $25k-50k, 2.6% for AGIs $50k-75k, 2.8% for AGIs $75k-100k, 3.6% for AGIs over 100k)
Total tax: $4,496 (reported on 74.9% of returns)
35079:
$4,496
State:
$6,905
(% of AGI for various income ranges: 3.3% for AGIs below $10k, 3.9% for AGIs $10k-25k, 5.8% for AGIs $25k-50k, 7.8% for AGIs $50k-75k, 10.3% for AGIs $75k-100k, 16.0% for AGIs over 100k)
Earned income credit: $1,837 (reported on 18.3% of returns)
Here:
$1,837
State:
$2,048
Percentage of individuals using paid preparers for their 2004 taxes: 67.7%
Here:
68%
State:
65%
(% for various income ranges: 63.2% for AGIs below $10k, 70.4% for AGIs $10k-25k, 67.7% for AGIs $25k-50k, 67.7% for AGIs $50k-75k, 66.2% for AGIs $75k-100k, 72.6% for AGIs over 100k)
Likely homosexual households (counted as self-reported same-sex unmarried-partner households)
Lesbian couples: 0.2% of all households
Gay men: 0.0% of all households
Household received Food Stamps/SNAP in the past 12 months: 257 Household did not receive Food Stamps/SNAP in the past 12 months: 3,084
Women who had a birth in the past 12 months: 79 (51 now married, 26 unmarried) Women who did not have a birth in the past 12 months: 2,007 (951 now married, 1,054 unmarried)
Housing units in zip code 35079 with a mortgage: 1,725 (182 second mortgage, 37 both second mortgage and home equity loan) Houses without a mortgage: 28
Median monthly owner costs for units with a mortgage: $1,279 Median monthly owner costs for units without a mortgage: $389
Residents with income below the poverty level in 2022:
This zip code:
11.2%
Whole state:
16.2%
Residents with income below 50% of the poverty level in 2022:
This zip code:
5.9%
Whole state:
8.6%
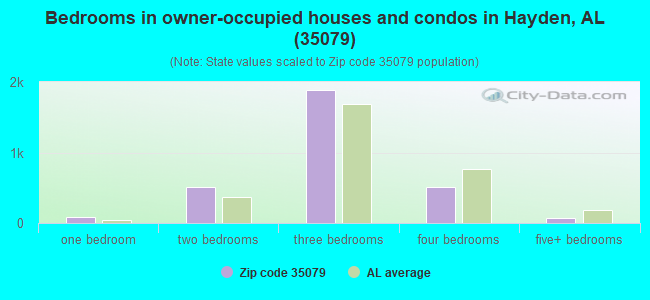
Median number of rooms in houses and condos:
Here:
6.7
State:
6.5
Median number of rooms in apartments:
Here:
4.9
State:
4.7
Notable locations in this zip code not listed on our city pages
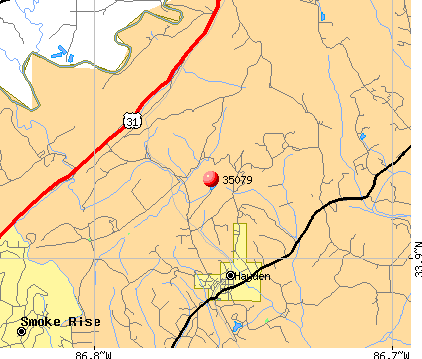
Notable locations in zip code 35079: Blount Springs Station (A), West Blount Fire Department Station 1 (B), West Blount Fire Department Station 3 (C), West Blount Fire Department Station 4 (D), Mountain High Volunteer Fire and Rescue Station 2 (E), Bangor Volunteer Fire Department (F), Ricetown Volunteer Fire and Rescue (G). Display/hide their locations on the map
Churches in zip code 35079 include: Nectar Heights Church (A), Oak Grove Church (B), Pleasant Hill Church (C), Providence Church (D), Sulphur Springs Church (E), Union Grove Baptist Church (F), Austin Creek Baptist Church (G), Ricetown Chapel (H), Red Hill Church (I). Display/hide their locations on the map
Cemeteries: Guinns Cove Cemetery (1), Curl Cemetery (2), Moore Cemetery (3), Union Grove Cemetery (4), Graves Gap Cemetery (5), Cedar Grove Cemetery (6). Display/hide their locations on the map
Creeks: Shoal Creek (A), Cox Creek (B), Rice Creek (C), Pannell Creek (D), Neeley Creek (E), Murphy Creek (F), Mill Creek (G), Matt Hollow Creek (H), Little Scirum Creek (I). Display/hide their locations on the map
1,414 married couples with children.
237 single-parent households (62 men, 175 women).
97.8% of residents of 35079 zip code speak English at home.
1.2% of residents speak Spanish at home (66% very well, 34% not well).
0.4% of residents speak other Indo-European language at home (49% very well, 51% well).
0.1% of residents speak other language at home (100% very well).
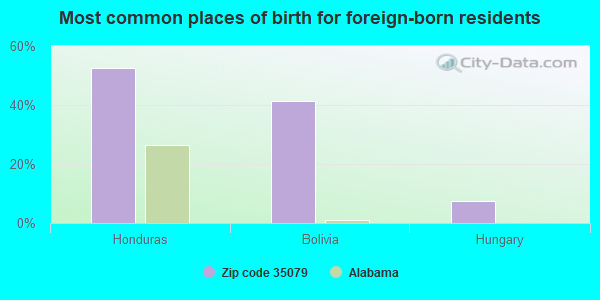
Foreign born population: 87 (0.9%) (7.3% of them are naturalized citizens)
This zip code:
0.9%
Whole state:
3.8%
52%Honduras
41%Bolivia
7%Hungary
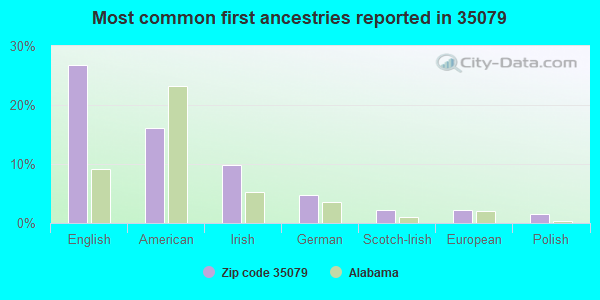
27%English
16%American
10%Irish
5%German
2%Scotch-Irish
2%European
1%Polish
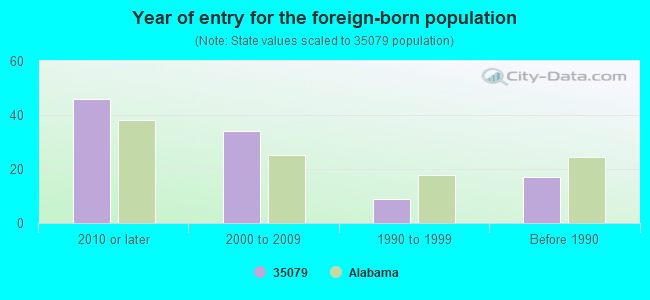
Year of entry for the foreign-born population
462010 or later
342000 to 2009
91990 to 1999
17Before 1990
Facilities with environmental interests located in this zip code:
ACTION RESOURCES DEVELOPMENT (ACTION RESOURCES INCORPORATION in BLOUNT SPRINGS, AL)
National Pollutant Discharge Elimination System NON-MAJOR (Tracking pollutant discharge elimination systems) - permit Business SIC classification: EXCAVATION WORK
ARKADELPHIA 5761 MINE (DRUMMOND COMPANY INCORPORATION in HAYDEN, AL)
National Pollutant Discharge Elimination System NON-MAJOR (Tracking pollutant discharge elimination systems) - permit Business SIC classification: BITUMINOUS COAL AND LIGNITE SURFACE MINING Alternative names: DRUMMOND COMPANY INCORPORATION, DRUMMOND ARKADELPHIA 5761 MINE
BLOUNT SPRINGS RECOLONIZATION (BSRP LP OPERATING in BLOUNT SPRINGS, AL)
National Pollutant Discharge Elimination System NON-MAJOR (Tracking pollutant discharge elimination systems) - permit Business SIC classification: LAND SUBDIVIDERS AND DEVELOPERS, EXCEPT CEMETERIES
BLOUNT COUNTY ENERGY, LLC - BMW (HALL ROAD in HAYDEN, AL)
AIR MAJOR (AIRS/AFS) AIR PROGRAM (Clean Air Markets Division Business System) AIR MAJOR ("Best Available" air pollution technologies tracking) Business SIC classification: ELECTRIC SERVICES Alternative names: BLOUNT COUNTY ENERGY LLC, BLOUNT MEGAWATT FACILITY, BLOUNT MEGAWATT FACILITY
ROTATING SPECIALISTS (2500 HIGHWAY 160 in HAYDEN, AL)
(Resource Conservation and Recovery Act (tracking hazardous waste))
MISTY ACRES (BRAKEFIELD AND SMITH INCORP in HAYDEN, AL)
National Pollutant Discharge Elimination System NON-MAJOR (Tracking pollutant discharge elimination systems) - permit Business SIC classification: GENERAL CONTRACTORS-SINGLE-FAMILY HOUSES Alternative names: BRAKEFIELD AND SMITH INC MISTY
Housing units lacking complete plumbing facilities: 5.8% Housing units lacking complete kitchen facilities: 3.7%
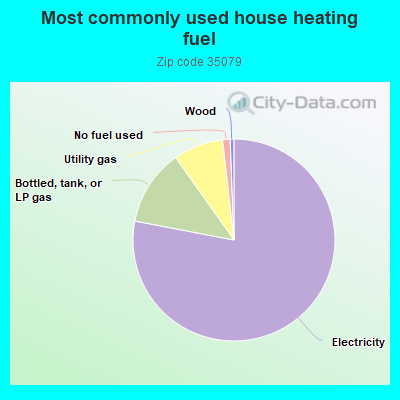
78.1%Electricity
12.2%Bottled, tank, or LP gas
8.0%Utility gas
1.2%No fuel used
0.6%Wood
Population in 1990: 6,533. Population change in the 1990s: +617 (+9.4%).
Place of birth for U.S.-born residents:
This state: 7,643
Northeast: 72
Midwest: 415
South: 993
West: 89
58% of the 35079 zip code residents lived in the same house 5 years ago. Out of people who lived in different houses, 51% lived in this county. Out of people who lived in different counties, 50% lived in Alabama.
94% of the 35079 zip code residents lived in the same house 1 year ago. Out of people who lived in different houses, 63% moved from this county. Out of people who lived in different houses, 34% moved from different county within same state. Out of people who lived in different houses, 1% moved from different state.
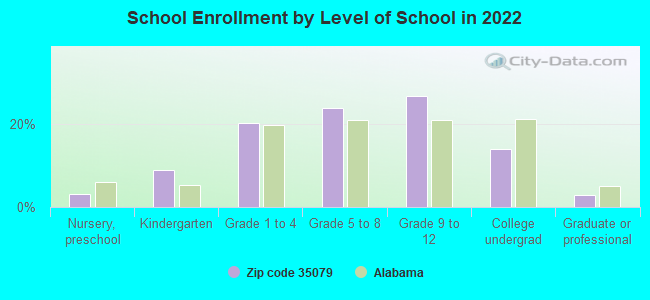
Private vs. public school enrollment:
Students in private schools in grades 1 to 8 (elementary and middle school): 72
Here:
8.2%
Alabama:
14.7%
Students in private schools in grades 9 to 12 (high school): 66
Here:
12.3%
Alabama:
16.3%
Students in private undergraduate colleges: 18
Here:
6.5%
Alabama:
14.6%
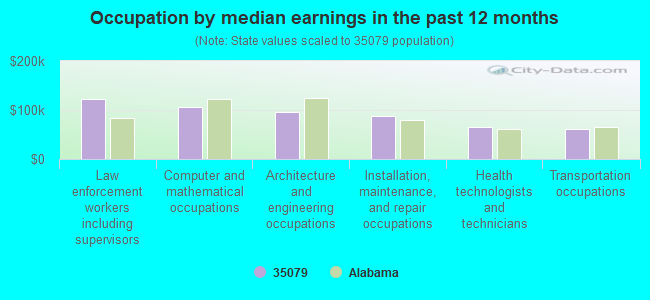
Occupation by median earnings in the past 12 months ($)
121,668Law enforcement workers including supervisors
105,454Computer and mathematical occupations
96,206Architecture and engineering occupations
86,847Installation, maintenance, and repair occupations
65,369Health technologists and technicians
61,120Transportation occupations
Companies with federal contracts located in this zip code:
ROTATING SPECIALISTS INC (2500 STATE HWY 160 in HAYDEN, AL; small business)
$25,000 with Tennessee Valley Authority for Motors, Electrical. Signed on 2000-09-15. Completion date: 2000-09-15.
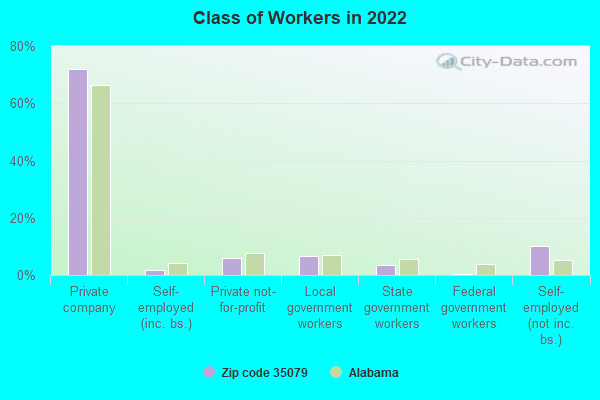
Top industries in this zip code by the number of employees in 2005:
Health Care and Social Assistance: Other Individual and Family Services (20-49 employees: 1 establishment)
Other Services (except Public Administration): Religious Organizations (5-9: 4, 1-4: 1)
Construction: Other Foundation, Structure, and Building Exterior Contractors (10-19: 1)
Administrative and Support and Waste Management and Remediation Services: Janitorial Services (10-19: 1)
Accommodation and Food Services: Full-Service Restaurants (5-9: 1, 1-4: 1)
Construction: New Single-Family Housing Construction (except Operative Builders) (5-9: 1, 1-4: 1)
Administrative and Support and Waste Management and Remediation Services: Solid Waste Collection (5-9: 1)
Finance and Insurance: Commercial Banking (5-9: 1)
People in group quarters in 2010:
23 people in residential treatment centers for adults
13 people in nursing facilities/skilled-nursing facilities
People in group quarters in 2000:
45 people in other noninstitutional group quarters
34 people in homes or halfway houses for drug/alcohol abuse
30 people in other types of correctional institutions
Fatal accident statistics in 2013:
Fatal accident count: 2
Vehicles involved in fatal accidents: 2
Fatal accidents caused by drunken drivers: 0
Fatalities: 2
Persons involved in fatal accidents: 3
Pedestrians involved in fatal accidents: 0
Fatal accident statistics in 2011:
Fatal accident count: 1
Vehicles involved in fatal accidents: 1
Fatal accidents caused by drunken drivers: 0
Fatalities: 1
Persons involved in fatal accidents: 1
Pedestrians involved in fatal accidents: 0
Home Mortgage Disclosure Act Aggregated Statistics For Year 2009 (Based on 2 partial tracts)
A) FHA, FSA/RHS & VA Home Purchase Loans
B) Conventional Home Purchase Loans
C) Refinancings
D) Home Improvement Loans
F) Non-occupant Loans on < 5 Family Dwellings (A B C & D)
G) Loans On Manufactured Home Dwelling (A B C & D)
Number
Average Value
Number
Average Value
Number
Average Value
Number
Average Value
Number
Average Value
Number
Average Value
LOANS ORIGINATED
74
$127,819
48
$93,308
191
$138,802
21
$18,697
10
$51,329
23
$37,807
APPLICATIONS APPROVED, NOT ACCEPTED
1
$218,450
5
$37,228
24
$119,896
1
$82,660
0
$0
5
$28,116
APPLICATIONS DENIED
14
$133,665
22
$71,570
96
$135,224
14
$56,363
4
$69,915
20
$49,484
APPLICATIONS WITHDRAWN
6
$128,422
5
$107,038
74
$151,453
2
$104,960
1
$208,610
1
$67,300
FILES CLOSED FOR INCOMPLETENESS
1
$120,050
1
$65,600
15
$135,498
1
$46,790
0
$0
0
$0
Aggregated Statistics For Year 2008 (Based on 2 partial tracts)
A) FHA, FSA/RHS & VA Home Purchase Loans
B) Conventional Home Purchase Loans
C) Refinancings
D) Home Improvement Loans
F) Non-occupant Loans on < 5 Family Dwellings (A B C & D)
G) Loans On Manufactured Home Dwelling (A B C & D)
Number
Average Value
Number
Average Value
Number
Average Value
Number
Average Value
Number
Average Value
Number
Average Value
LOANS ORIGINATED
61
$125,324
80
$106,828
178
$126,686
42
$29,806
20
$83,996
34
$49,594
APPLICATIONS APPROVED, NOT ACCEPTED
2
$110,750
11
$108,655
20
$130,201
2
$49,655
2
$111,345
7
$65,680
APPLICATIONS DENIED
13
$117,773
36
$78,411
132
$135,519
23
$67,743
9
$101,850
34
$57,561
APPLICATIONS WITHDRAWN
8
$146,429
6
$152,607
51
$155,634
4
$177,275
2
$105,615
2
$56,480
FILES CLOSED FOR INCOMPLETENESS
4
$103,975
5
$131,266
14
$131,139
3
$97,300
1
$140,000
1
$106,270
Aggregated Statistics For Year 2007 (Based on 2 partial tracts)
A) FHA, FSA/RHS & VA Home Purchase Loans
B) Conventional Home Purchase Loans
C) Refinancings
D) Home Improvement Loans
F) Non-occupant Loans on < 5 Family Dwellings (A B C & D)
G) Loans On Manufactured Home Dwelling (A B C & D)
Number
Average Value
Number
Average Value
Number
Average Value
Number
Average Value
Number
Average Value
Number
Average Value
LOANS ORIGINATED
15
$114,369
194
$116,035
159
$111,451
34
$41,439
21
$67,809
34
$48,147
APPLICATIONS APPROVED, NOT ACCEPTED
1
$31,490
23
$68,039
31
$100,260
3
$45,817
1
$24,930
12
$49,168
APPLICATIONS DENIED
3
$105,347
40
$84,789
111
$122,205
44
$64,564
5
$84,466
23
$55,736
APPLICATIONS WITHDRAWN
4
$126,280
16
$131,864
46
$112,068
10
$74,258
3
$115,167
4
$40,378
FILES CLOSED FOR INCOMPLETENESS
1
$62,980
9
$143,591
17
$135,074
3
$66,553
0
$0
1
$72,160
Aggregated Statistics For Year 2006 (Based on 2 partial tracts)
A) FHA, FSA/RHS & VA Home Purchase Loans
B) Conventional Home Purchase Loans
C) Refinancings
D) Home Improvement Loans
E) Loans on Dwellings For 5+ Families
F) Non-occupant Loans on < 5 Family Dwellings (A B C & D)
G) Loans On Manufactured Home Dwelling (A B C & D)
Number
Average Value
Number
Average Value
Number
Average Value
Number
Average Value
Number
Average Value
Number
Average Value
Number
Average Value
LOANS ORIGINATED
16
$100,932
237
$101,594
187
$117,759
38
$39,662
1
$55,620
20
$83,252
44
$51,092
APPLICATIONS APPROVED, NOT ACCEPTED
2
$38,645
39
$77,656
33
$99,983
4
$33,408
0
$0
1
$112,060
16
$43,124
APPLICATIONS DENIED
2
$106,270
49
$74,724
140
$112,915
40
$48,425
0
$0
7
$64,930
43
$50,512
APPLICATIONS WITHDRAWN
1
$116,350
33
$95,812
76
$112,382
11
$67,466
0
$0
1
$28,860
5
$51,922
FILES CLOSED FOR INCOMPLETENESS
0
$0
5
$113,436
28
$136,286
1
$6,560
0
$0
0
$0
0
$0
Aggregated Statistics For Year 2005 (Based on 2 partial tracts)
A) FHA, FSA/RHS & VA Home Purchase Loans
B) Conventional Home Purchase Loans
C) Refinancings
D) Home Improvement Loans
F) Non-occupant Loans on < 5 Family Dwellings (A B C & D)
G) Loans On Manufactured Home Dwelling (A B C & D)
Number
Average Value
Number
Average Value
Number
Average Value
Number
Average Value
Number
Average Value
Number
Average Value
LOANS ORIGINATED
11
$113,074
216
$92,744
193
$110,717
36
$33,309
23
$61,781
41
$45,909
APPLICATIONS APPROVED, NOT ACCEPTED
2
$59,630
28
$85,162
42
$98,337
5
$27,420
2
$36,965
14
$59,684
APPLICATIONS DENIED
3
$94,027
70
$65,189
129
$102,901
32
$47,878
6
$52,150
52
$53,477
APPLICATIONS WITHDRAWN
2
$78,240
20
$92,900
97
$121,259
11
$109,367
4
$108,805
11
$64,765
FILES CLOSED FOR INCOMPLETENESS
0
$0
3
$79,603
24
$130,832
2
$173,355
0
$0
1
$55,100
Aggregated Statistics For Year 2004 (Based on 2 partial tracts)
A) FHA, FSA/RHS & VA Home Purchase Loans
B) Conventional Home Purchase Loans
C) Refinancings
D) Home Improvement Loans
F) Non-occupant Loans on < 5 Family Dwellings (A B C & D)
G) Loans On Manufactured Home Dwelling (A B C & D)
Number
Average Value
Number
Average Value
Number
Average Value
Number
Average Value
Number
Average Value
Number
Average Value
LOANS ORIGINATED
14
$111,308
167
$96,868
198
$110,088
29
$41,057
12
$54,972
34
$47,816
APPLICATIONS APPROVED, NOT ACCEPTED
1
$147,600
25
$83,646
47
$114,921
7
$43,294
2
$77,595
12
$48,592
APPLICATIONS DENIED
4
$78,715
44
$64,947
142
$99,297
35
$43,955
4
$66,482
36
$50,532
APPLICATIONS WITHDRAWN
2
$127,570
17
$97,409
62
$109,204
11
$63,253
0
$0
6
$60,452
FILES CLOSED FOR INCOMPLETENESS
1
$83,970
4
$100,072
67
$109,960
2
$21,785
0
$0
5
$80,456
Aggregated Statistics For Year 2003 (Based on 2 partial tracts)
A) FHA, FSA/RHS & VA Home Purchase Loans
B) Conventional Home Purchase Loans
C) Refinancings
D) Home Improvement Loans
F) Non-occupant Loans on < 5 Family Dwellings (A B C & D)
Number
Average Value
Number
Average Value
Number
Average Value
Number
Average Value
Number
Average Value
LOANS ORIGINATED
24
$108,810
144
$92,308
356
$104,894
26
$38,207
18
$57,253
APPLICATIONS APPROVED, NOT ACCEPTED
1
$144,320
23
$69,623
59
$96,485
3
$48,183
1
$17,710
APPLICATIONS DENIED
7
$47,737
54
$56,741
171
$89,151
17
$29,932
4
$81,988
APPLICATIONS WITHDRAWN
1
$120,050
11
$87,215
81
$103,812
7
$60,384
0
$0
FILES CLOSED FOR INCOMPLETENESS
0
$0
5
$143,356
18
$83,734
1
$68,880
0
$0
Aggregated Statistics For Year 2002 (Based on 2 partial tracts)
A) FHA, FSA/RHS & VA Home Purchase Loans
B) Conventional Home Purchase Loans
C) Refinancings
D) Home Improvement Loans
F) Non-occupant Loans on < 5 Family Dwellings (A B C & D)
Number
Average Value
Number
Average Value
Number
Average Value
Number
Average Value
Number
Average Value
LOANS ORIGINATED
24
$99,335
117
$89,073
251
$99,926
22
$23,072
12
$67,560
APPLICATIONS APPROVED, NOT ACCEPTED
1
$49,200
21
$60,345
33
$81,906
1
$47,230
2
$30,085
APPLICATIONS DENIED
5
$85,192
62
$47,840
97
$103,165
20
$28,836
5
$27,394
APPLICATIONS WITHDRAWN
1
$127,260
9
$87,504
48
$109,541
3
$81,217
0
$0
FILES CLOSED FOR INCOMPLETENESS
0
$0
8
$76,470
30
$99,152
0
$0
1
$33,460
Aggregated Statistics For Year 2001 (Based on 2 partial tracts)
A) FHA, FSA/RHS & VA Home Purchase Loans
B) Conventional Home Purchase Loans
C) Refinancings
D) Home Improvement Loans
E) Loans on Dwellings For 5+ Families
F) Non-occupant Loans on < 5 Family Dwellings (A B C & D)
Number
Average Value
Number
Average Value
Number
Average Value
Number
Average Value
Number
Average Value
Number
Average Value
LOANS ORIGINATED
12
$94,858
125
$77,182
235
$97,775
19
$28,488
1
$32,140
9
$79,502
APPLICATIONS APPROVED, NOT ACCEPTED
0
$0
22
$63,194
41
$75,492
3
$28,377
0
$0
3
$50,963
APPLICATIONS DENIED
1
$107,150
86
$43,862
120
$77,375
13
$20,219
0
$0
9
$47,094
APPLICATIONS WITHDRAWN
1
$47,230
11
$75,148
55
$85,511
3
$30,613
0
$0
0
$0
FILES CLOSED FOR INCOMPLETENESS
0
$0
4
$101,680
15
$100,840
0
$0
0
$0
1
$36,740
Aggregated Statistics For Year 2000 (Based on 2 partial tracts)
A) FHA, FSA/RHS & VA Home Purchase Loans
B) Conventional Home Purchase Loans
C) Refinancings
D) Home Improvement Loans
F) Non-occupant Loans on < 5 Family Dwellings (A B C & D)
Number
Average Value
Number
Average Value
Number
Average Value
Number
Average Value
Number
Average Value
LOANS ORIGINATED
19
$91,475
154
$74,766
83
$77,859
33
$16,554
11
$36,131
APPLICATIONS APPROVED, NOT ACCEPTED
2
$56,365
35
$46,594
13
$64,091
5
$21,116
1
$62,230
APPLICATIONS DENIED
1
$87,250
132
$38,426
47
$73,172
15
$13,537
5
$44,414
APPLICATIONS WITHDRAWN
2
$89,185
10
$55,176
29
$53,896
1
$38,240
1
$31,490
FILES CLOSED FOR INCOMPLETENESS
0
$0
2
$105,845
16
$86,928
0
$0
0
$0
Aggregated Statistics For Year 1999 (Based on 2 partial tracts)
A) FHA, FSA/RHS & VA Home Purchase Loans
B) Conventional Home Purchase Loans
C) Refinancings
D) Home Improvement Loans
F) Non-occupant Loans on < 5 Family Dwellings (A B C & D)
Detailed PMIC statistics for the following Tracts:0505.00
, 0506.00
2003 - 2018 National Fire Incident Reporting System (NFIRS) incidents
According to the data from the years 2003 - 2018 the average number of fire incidents per year is 35. The highest number of reported fire incidents - 129 took place in 2014, and the least - 10 in 2017. The data has a rising trend.
When looking into fire subcategories, the most reports belonged to: Structure Fires (45.7%), and Outside Fires (40.7%).
Fire incident types reported to NFIRS in Zip Code 35079


 Nearest zip codes: 35070, 35172, 35077, 35097, 35180, 35049.
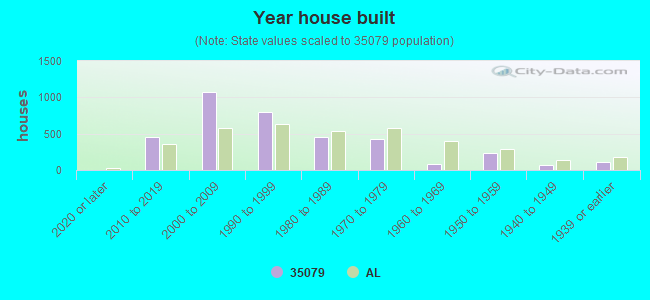


 According to the data from the years 2003 - 2018 the average number of fire incidents per year is 35. The highest number of reported fire incidents - 129 took place in 2014, and the least - 10 in 2017. The data has a rising trend.
 When looking into fire subcategories, the most reports belonged to: Structure Fires (45.7%), and Outside Fires (40.7%).