Estimated zip code population in 2022: 2,108 Zip code population in 2010: 2,082 Zip code population in 2000: 2,740
Houses and condos: 1,046 Renter-occupied apartments: 143
% of renters here:
16%
State:
30%
March 2022 cost of living index in zip code 35078: 81.5 (low, U.S. average is 100)
Land area: 43.5 sq. mi. Water area: 1.9 sq. mi.
Population density: 48 people per square mile
(very low).
OSM Map
General Map
Google Map
MSN Map
OSM Map
General Map
Google Map
MSN Map
OSM Map
General Map
Google Map
MSN Map
OSM Map
General Map
Google Map
MSN Map
Please wait while loading the map...
Real estate property taxes paid for housing units in 2022:
This zip code:
0.5% ($1,037)
Alabama:
0.4% ($718)
Median real estate property taxes paid for housing units with mortgages in 2022: $1,007 (0.4%) Median real estate property taxes paid for housing units with no mortgage in 2022: $1,188 (0.9%)
Business Search- 14 Million verified businesses
Males: 991
(47.0%)
Females: 1,117
(53.0%)
For population 25 years and over in 35078:
High school or higher: 89.1%
Bachelor's degree or higher: 20.1%
Graduate or professional degree: 6.2%
Unemployed: 4.4%
Mean travel time to work (commute): 36.1 minutes
For population 15 years and over in 35078:
Never married: 23.0%
Now married: 56.6%
Separated: 2.7%
Widowed: 5.1%
Divorced: 12.6%
Zip code 35078 compared to state average:
Foreign-born population percentage significantly below state average.
Estimated median house/condo value in 2022: $213,330
35078:
$213,330
Alabama:
$200,900
According to our research of Alabama and other state lists, there were 3 registered sex offenders living in 35078 zip code as of June 08, 2024. The ratio of all residents to sex offenders in zip code 35078 is 739 to 1. The ratio of registered sex offenders to all residents in this zip code is lower than the state average.
Median resident age:
This zip code:
40.3 years
Alabama median age:
39.6 years
Average household size:
This zip code:
2.4 people
Alabama:
2.5 people
Averages for the 2020 tax year for zip code 35078, filed in 2021:
Average Adjusted Gross Income (AGI) in 2020: $58,527 (Individual Income Tax Returns)
Here:
$58,527
State:
$63,984
Salary/wage: $50,682 (reported on 83.2% of returns)
Here:
$50,682
State:
$52,834
(% of AGI for various income ranges: 1284.6% for AGIs below $25k, 4056.5% for AGIs $25k-50k, 6820.0% for AGIs $50k-75k, 10984.0% for AGIs $75k-100k, 15638.6% for AGIs $100k-200k)
Taxable interest for individuals: $692 (reported on 26.3% of returns)
This zip code:
$692
Alabama:
$1,615
(% of AGI for various income ranges: 10.8% for AGIs below $25k, 17.0% for AGIs $25k-50k, 21.1% for AGIs $50k-75k, 14.0% for AGIs $75k-100k, 48.6% for AGIs $100k-200k)
Ordinary dividends: $4,427 (reported on 11.6% of returns)
Here:
$4,427
State:
$7,660
(% of AGI for various income ranges: 52.1% for AGIs below $25k, 137.8% for AGIs $50k-75k, 340.0% for AGIs $100k-200k)
Net capital gain/loss in AGI: +$5,890 (reported on 10.5% of returns)
Here:
+$5,890
State:
+$23,528
(% of AGI for various income ranges: 42.2% for AGIs $50k-75k, 792.9% for AGIs $100k-200k)
Profit/loss from business: +$11,333 (reported on 15.8% of returns)
Here:
+$11,333
State:
+$9,534
(% of AGI for various income ranges: 151.2% for AGIs below $25k, 131.0% for AGIs $25k-50k, 705.6% for AGIs $50k-75k, 628.6% for AGIs $100k-200k)
Taxable individual retirement arrangement distribution: $17,312 (reported on 8.4% of returns)
35078:
$17,312
Alabama:
$19,004
(% of AGI for various income ranges: 76.2% for AGIs below $25k, 142.0% for AGIs $25k-50k, 1836.0% for AGIs $75k-100k)
Total itemized deductions: $30,757 (reported on 7.4% of returns)
Here:
$30,757
State:
$37,338
(% of AGI for various income ranges: 838.9% for AGIs $50k-75k, 1997.1% for AGIs $100k-200k)
Charity contributions: $12,750 (reported on 6.3% of returns)
Here:
$12,750
State:
$18,005
(% of AGI for various income ranges: 84.5% for AGIs $25k-50k, 851.4% for AGIs $100k-200k)
Taxes paid: $6,443 (reported on 7.4% of returns)
35078:
$6,443
State:
$6,484
(% of AGI for various income ranges: 128.9% for AGIs $50k-75k, 478.6% for AGIs $100k-200k)
Earned income credit: $2,694 (reported on 18.9% of returns)
Here:
$2,694
State:
$2,628
(% of AGI for various income ranges: 131.7% for AGIs below $25k, 84.5% for AGIs $25k-50k)
Percentage of individuals using paid preparers for their 2020 taxes: 92.6%
Here:
93%
State:
93%
(% for various income ranges: 90.9% for AGIs below $25k, 92.3% for AGIs $25k-50k, 92.9% for AGIs $50k-75k, 100.0% for AGIs $75k-100k, 90.9% for AGIs $100k-200k, 100.0% for AGIs over 200k)
Averages for the 2012 tax year for zip code 35078, filed in 2013:
Average Adjusted Gross Income (AGI) in 2012: $47,453 (Individual Income Tax Returns)
Here:
$47,453
State:
$52,001
Salary/wage: $40,097 (reported on 85.1% of returns)
Here:
$40,097
State:
$43,822
(% of AGI for various income ranges: 73.2% for AGIs below $25k, 85.4% for AGIs $25k-50k, 75.0% for AGIs $50k-75k, 79.8% for AGIs $75k-100k, 60.4% for AGIs $100k-200k)
Taxable interest for individuals: $1,156 (reported on 28.7% of returns)
This zip code:
$1,156
Alabama:
$1,592
(% of AGI for various income ranges: 0.7% for AGIs below $25k, 1.1% for AGIs $25k-50k, 0.2% for AGIs $50k-75k, 0.5% for AGIs $75k-100k, 0.8% for AGIs $100k-200k)
Ordinary dividends: $4,120 (reported on 11.5% of returns)
Here:
$4,120
State:
$5,697
(% of AGI for various income ranges: 1.1% for AGIs below $25k, 0.5% for AGIs $50k-75k, 2.1% for AGIs $100k-200k)
Net capital gain/loss in AGI: +$240 (reported on 5.7% of returns)
Here:
+$240
State:
+$13,286
Profit/loss from business: +$5,833 (reported on 17.2% of returns)
Here:
+$5,833
State:
+$9,151
(% of AGI for various income ranges: 11.7% for AGIs below $25k, 1.4% for AGIs $25k-50k, 2.1% for AGIs $50k-75k)
Taxable individual retirement arrangement distribution: $10,125 (reported on 9.2% of returns)
35078:
$10,125
Alabama:
$14,992
(% of AGI for various income ranges: 1.7% for AGIs below $25k, 2.4% for AGIs $25k-50k, 7.3% for AGIs $50k-75k)
Total itemized deductions: $18,913 (20% of AGI, reported on 26.4% of returns)
Here:
$18,913
State:
$21,388
Here:
19.8% of AGI
State:
20.1% of AGI
(% of AGI for various income ranges: 6.3% for AGIs below $25k, 11.1% for AGIs $25k-50k, 12.5% for AGIs $50k-75k, 10.2% for AGIs $75k-100k, 10.9% for AGIs $100k-200k)
Charity contributions: $5,514 (reported on 24.1% of returns)
Here:
$5,514
State:
$5,925
(% of AGI for various income ranges: 1.0% for AGIs below $25k, 2.7% for AGIs $25k-50k, 3.3% for AGIs $50k-75k, 2.9% for AGIs $75k-100k, 3.2% for AGIs $100k-200k)
Taxes paid: $4,855 (reported on 25.3% of returns)
35078:
$4,855
State:
$5,272
(% of AGI for various income ranges: 0.7% for AGIs below $25k, 1.7% for AGIs $25k-50k, 2.7% for AGIs $50k-75k, 2.4% for AGIs $75k-100k, 3.7% for AGIs $100k-200k)
Earned income credit: $2,591 (reported on 26.4% of returns)
Here:
$2,591
State:
$2,646
(% of AGI for various income ranges: 9.2% for AGIs below $25k, 1.4% for AGIs $25k-50k)
Percentage of individuals using paid preparers for their 2012 taxes: 65.5%
Here:
66%
State:
60%
(% for various income ranges: 64.1% for AGIs below $25k, 63.6% for AGIs $25k-50k, 66.7% for AGIs $50k-75k, 66.7% for AGIs $75k-100k, 75.0% for AGIs $100k-200k)
Averages for the 2004 tax year for zip code 35078, filed in 2005:
Average Adjusted Gross Income (AGI) in 2004: $35,764 (Individual Income Tax Returns)
Here:
$35,764
State:
$42,302
Salary/wage: $33,626 (reported on 85.6% of returns)
Here:
$33,626
State:
$36,626
(% of AGI for various income ranges: 92.0% for AGIs below $10k, 80.1% for AGIs $10k-25k, 84.3% for AGIs $25k-50k, 82.0% for AGIs $50k-75k, 77.5% for AGIs $75k-100k, 76.4% for AGIs over 100k)
Taxable interest for individuals: $1,448 (reported on 31.3% of returns)
This zip code:
$1,448
Alabama:
$1,827
(% of AGI for various income ranges: 3.6% for AGIs below $10k, 1.3% for AGIs $10k-25k, 0.8% for AGIs $25k-50k, 0.1% for AGIs $50k-75k, 0.7% for AGIs $75k-100k, 2.7% for AGIs over 100k)
Taxable dividends: $1,606 (reported on 10.8% of returns)
Here:
$1,606
State:
$4,206
(% of AGI for various income ranges: 2.9% for AGIs below $10k, 0.1% for AGIs $10k-25k, 0.1% for AGIs $25k-50k, 0.4% for AGIs $50k-75k, 0.2% for AGIs $75k-100k, 1.1% for AGIs over 100k)
Net capital gain/loss: +$2,214 (reported on 8.3% of returns)
Here:
+$2,214
State:
+$13,031
(% of AGI for various income ranges: 0.8% for AGIs below $10k, -0.1% for AGIs $25k-50k, -0.1% for AGIs $50k-75k, 1.3% for AGIs $75k-100k, 1.5% for AGIs over 100k)
Profit/loss from business: +$5,955 (reported on 15.4% of returns)
Here:
+$5,955
State:
+$8,302
(% of AGI for various income ranges: 6.8% for AGIs below $10k, 7.5% for AGIs $10k-25k, 4.1% for AGIs $25k-50k, 0.5% for AGIs $50k-75k, 0.4% for AGIs over 100k)
Profit/loss from farming: +$1,077 (reported on 2.6% of returns)
Here:
+$1,077
State:
-$6,257
IRA payment deduction: $4,000 (reported on 1.0% of returns)
35078:
$4,000
Alabama:
$3,006
Total itemized deductions: $17,365 (24% of AGI, reported on 25.0% of returns)
Here:
$17,365
State:
$17,623
Here:
23.8% of AGI
State:
20.8% of AGI
(% of AGI for various income ranges: 7.9% for AGIs $10k-25k, 10.9% for AGIs $25k-50k, 14.2% for AGIs $50k-75k, 14.5% for AGIs $75k-100k, 14.5% for AGIs over 100k)
Charity contributions deductions: $5,527 (7% of AGI, reported on 21.8% of returns)
Here:
$5,527
State:
$4,768
Here:
7.1% of AGI
State:
5.4% of AGI
(% of AGI for various income ranges: 0.9% for AGIs $10k-25k, 2.8% for AGIs $25k-50k, 3.2% for AGIs $50k-75k, 4.3% for AGIs $75k-100k, 5.5% for AGIs over 100k)
Total tax: $5,036 (reported on 68.7% of returns)
35078:
$5,036
State:
$6,905
(% of AGI for various income ranges: 2.0% for AGIs below $10k, 3.6% for AGIs $10k-25k, 6.2% for AGIs $25k-50k, 8.4% for AGIs $50k-75k, 10.7% for AGIs $75k-100k, 18.3% for AGIs over 100k)
Earned income credit: $1,985 (reported on 27.2% of returns)
Here:
$1,985
State:
$2,048
Percentage of individuals using paid preparers for their 2004 taxes: 68.6%
Here:
69%
State:
65%
(% for various income ranges: 64.5% for AGIs below $10k, 66.5% for AGIs $10k-25k, 74.1% for AGIs $25k-50k, 65.5% for AGIs $50k-75k, 68.9% for AGIs $75k-100k, 80.4% for AGIs over 100k)
Household received Food Stamps/SNAP in the past 12 months: 85 Household did not receive Food Stamps/SNAP in the past 12 months: 781
Women who had a birth in the past 12 months: 27 (31 now married, 0 unmarried) Women who did not have a birth in the past 12 months: 409 (193 now married, 216 unmarried)
Housing units in zip code 35078 with a mortgage: 427 (13 second mortgage, 9 both second mortgage and home equity loan) Houses without a mortgage: 22
Median monthly owner costs for units with a mortgage: $1,478 Median monthly owner costs for units without a mortgage: $426
Residents with income below the poverty level in 2022:
This zip code:
8.6%
Whole state:
16.2%
Residents with income below 50% of the poverty level in 2022:
This zip code:
5.1%
Whole state:
8.6%
Median number of rooms in houses and condos:
Here:
6.0
State:
6.5
Median number of rooms in apartments:
Here:
5.6
State:
4.7
Notable locations in this zip code not listed on our city pages
Notable locations in zip code 35078: Shelby County Landfill Number 2 (A), Harpersville Volunteer Fire Department (B). Display/hide their locations on the map
Churches in zip code 35078 include: Mount Olive Church (A), Providence Church (B), The Old Country Church (C), Baker Grove Church (D), Klein Church (E). Display/hide their locations on the map
Cemeteries: Baker Grove Cemetery (1), Kidd Cemetery (2), Chancellor Cemetery (3), Wallace Cemeteries (4), Masters Cemetery (5), Garden of Memories Cemetery (6), Bradford Cemetery (7). Display/hide their locations on the map
Reservoirs and swamps: Harpersville Lake Number 1 (A), Harpersville Lake Number 2 (B), Moores Pond (C), Old Glade Swamp (D). Display/hide their locations on the map
Streams, rivers, and creeks: Tanyard Branch (A), Poplar Spring Branch (B), Morgan Creek (C), Moore Branch (D), Walthall Branch (E), Fourmile Creek (F), Deer Lick Branch (G), Clear Prong (H), Carter Branch (I). Display/hide their locations on the map
Size of family households: 232 2-persons, 175 3-persons, 81 4-persons, 19 5-persons, 4 6-persons, 40 7-or-more-persons
Size of nonfamily households: 308 1-person, 10 2-persons
385 married couples with children.
57 single-parent households (40 men, 17 women).
97.6% of residents of 35078 zip code speak English at home.
1.9% of residents speak Spanish at home (49% very well, 51% well).
0.1% of residents speak Asian or Pacific Island language at home (100% very well).
0.2% of residents speak other language at home (100% not well).
Foreign born population: 32 (1.5%) (53.0% of them are naturalized citizens)
This zip code:
1.5%
Whole state:
3.8%
50%Sweden
37%Honduras
3%Malaysia
20%English
17%American
8%Norwegian
7%German
3%Irish
2%Macedonian
2%French
Year of entry for the foreign-born population
112010 or later
252000 to 2009
101990 to 1999
18Before 1990
Facilities with environmental interests located in this zip code:
MASON TEXACO (HWY 280 & 231 in HARPERSVILLE, AL)
(Integrated Compliance Information System) - ICIS-04-1988-0022, FORMAL ENFORCEMENT ACTION
ENVIRO SYSTEMS LLC WWTP (HIGHWAY 280 EAST in HARPERSVILLE, AL)
National Pollutant Discharge Elimination System NON-MAJOR (Tracking pollutant discharge elimination systems) - permit Business SIC classification: SEWERAGE SYSTEMS Alternative names: CHEYENNE ENVIRONMENTAL, CHEYENNE ENVIRONMENTAL LLC
KIRKPATRICK CONCRETE INC (1280 WESTOVER ROAD in HARPERSVILLE, AL)
National Pollutant Discharge Elimination System NON-MAJOR (Tracking pollutant discharge elimination systems) - permit Business SIC classification: READY-MIXED CONCRETE Alternative names: KIRKPARTICK CONCRETE INC, KIRKPATRICK CONCRETE HARPERSVL
CHEYENNE SITE (ENVIRO SYSTEMS LLC in HARPERSVILLE, AL)
National Pollutant Discharge Elimination System NON-MAJOR (Tracking pollutant discharge elimination systems) - permit Business SIC classification: WATER, SEWER, PIPELINE, AND COMMUNICATIONS AND POWER LINE CONSTRUCTION Alternative names: CHEYENNA PROJECT, CHEYENNE PROJECT
Housing units lacking complete plumbing facilities: 4.0% Housing units lacking complete kitchen facilities: 3.3%
75.3%Electricity
17.9%Bottled, tank, or LP gas
7.0%Utility gas
Population in 1990: 4,905.
Place of birth for U.S.-born residents:
This state: 1,681
Northeast: 27
Midwest: 3
South: 299
West: 18
56% of the 35078 zip code residents lived in the same house 5 years ago. Out of people who lived in different houses, 57% lived in this county. Out of people who lived in different counties, 50% lived in Alabama.
93% of the 35078 zip code residents lived in the same house 1 year ago. Out of people who lived in different houses, 28% moved from this county. Out of people who lived in different houses, 59% moved from different county within same state. Out of people who lived in different houses, 15% moved from different state.
Private vs. public school enrollment:
Students in private schools in grades 1 to 8 (elementary and middle school): 157
Here:
49.1%
Alabama:
14.7%
Students in private schools in grades 9 to 12 (high school): 22
Here:
38.9%
Alabama:
16.3%
Students in private undergraduate colleges:
Here:
0.0%
Alabama:
14.6%
Occupation by median earnings in the past 12 months ($)
271,195Arts, design, entertainment, sports, and media occupations
123,108Computer and mathematical occupations
90,148Transportation occupations
81,040Management occupations
62,366Installation, maintenance, and repair occupations
55,522Production occupations
Top industries in this zip code by the number of employees in 2005:
Educational Services: Elementary and Secondary Schools (20-49 employees: 1 establishment)
Health Care and Social Assistance: Other Residential Care Facilities (10-19: 2)
Other Services (except Public Administration): General Automotive Repair (10-19: 1, 5-9: 1)
Accommodation and Food Services: Limited-Service Restaurants (10-19: 1, 1-4: 1)
Arts, Entertainment, and Recreation: Golf Courses and Country Clubs (10-19: 1)
People in group quarters in 2000:
16 people in nursing homes
10 people in training schools for juvenile delinquents
10 people in other noninstitutional group quarters
Fatal accident statistics in 2014:
Fatal accident count: 2
Vehicles involved in fatal accidents: 3
Fatal accidents caused by drunken drivers: 2
Fatalities: 2
Persons involved in fatal accidents: 3
Pedestrians involved in fatal accidents: 0
Fatal accident statistics in 2011:
Fatal accident count: 3
Vehicles involved in fatal accidents: 4
Fatal accidents caused by drunken drivers: 0
Fatalities: 5
Persons involved in fatal accidents: 7
Pedestrians involved in fatal accidents: 0
Home Mortgage Disclosure Act Aggregated Statistics For Year 2009 (Based on 1 partial tract)
A) FHA, FSA/RHS & VA Home Purchase Loans
B) Conventional Home Purchase Loans
C) Refinancings
D) Home Improvement Loans
F) Non-occupant Loans on < 5 Family Dwellings (A B C & D)
G) Loans On Manufactured Home Dwelling (A B C & D)
Number
Average Value
Number
Average Value
Number
Average Value
Number
Average Value
Number
Average Value
Number
Average Value
LOANS ORIGINATED
6
$112,065
6
$149,443
29
$157,245
5
$25,160
5
$212,476
6
$43,452
APPLICATIONS APPROVED, NOT ACCEPTED
0
$0
3
$82,567
3
$162,820
0
$0
0
$0
3
$47,717
APPLICATIONS DENIED
4
$128,080
7
$127,599
17
$129,068
3
$25,160
1
$302,360
7
$68,293
APPLICATIONS WITHDRAWN
0
$0
2
$116,260
13
$120,663
0
$0
0
$0
0
$0
FILES CLOSED FOR INCOMPLETENESS
1
$169,620
0
$0
2
$125,150
0
$0
0
$0
0
$0
Aggregated Statistics For Year 2008 (Based on 1 partial tract)
A) FHA, FSA/RHS & VA Home Purchase Loans
B) Conventional Home Purchase Loans
C) Refinancings
D) Home Improvement Loans
F) Non-occupant Loans on < 5 Family Dwellings (A B C & D)
G) Loans On Manufactured Home Dwelling (A B C & D)
Number
Average Value
Number
Average Value
Number
Average Value
Number
Average Value
Number
Average Value
Number
Average Value
LOANS ORIGINATED
7
$107,644
12
$120,524
27
$144,375
10
$39,823
6
$129,272
9
$42,416
APPLICATIONS APPROVED, NOT ACCEPTED
1
$76,350
5
$49,626
4
$199,658
1
$5,640
1
$41,640
6
$56,538
APPLICATIONS DENIED
2
$85,460
7
$65,194
21
$128,198
7
$32,039
0
$0
7
$60,546
APPLICATIONS WITHDRAWN
1
$117,560
2
$161,375
10
$154,173
0
$0
0
$0
1
$106,280
FILES CLOSED FOR INCOMPLETENESS
0
$0
1
$100,640
3
$172,220
0
$0
0
$0
0
$0
Aggregated Statistics For Year 2007 (Based on 1 partial tract)
A) FHA, FSA/RHS & VA Home Purchase Loans
B) Conventional Home Purchase Loans
C) Refinancings
D) Home Improvement Loans
F) Non-occupant Loans on < 5 Family Dwellings (A B C & D)
G) Loans On Manufactured Home Dwelling (A B C & D)
Number
Average Value
Number
Average Value
Number
Average Value
Number
Average Value
Number
Average Value
Number
Average Value
LOANS ORIGINATED
4
$110,402
23
$139,929
31
$150,389
10
$32,925
7
$165,401
7
$50,754
APPLICATIONS APPROVED, NOT ACCEPTED
0
$0
7
$71,453
5
$127,538
0
$0
2
$48,805
4
$58,672
APPLICATIONS DENIED
1
$146,190
14
$95,157
22
$105,926
8
$55,418
0
$0
15
$57,319
APPLICATIONS WITHDRAWN
1
$61,170
3
$171,783
9
$128,983
3
$71,143
1
$81,120
1
$101,080
FILES CLOSED FOR INCOMPLETENESS
0
$0
0
$0
3
$145,900
0
$0
1
$104,110
0
$0
Aggregated Statistics For Year 2006 (Based on 1 partial tract)
A) FHA, FSA/RHS & VA Home Purchase Loans
B) Conventional Home Purchase Loans
C) Refinancings
D) Home Improvement Loans
F) Non-occupant Loans on < 5 Family Dwellings (A B C & D)
G) Loans On Manufactured Home Dwelling (A B C & D)
Number
Average Value
Number
Average Value
Number
Average Value
Number
Average Value
Number
Average Value
Number
Average Value
LOANS ORIGINATED
3
$138,527
29
$106,745
29
$111,561
8
$32,589
5
$129,792
9
$60,588
APPLICATIONS APPROVED, NOT ACCEPTED
0
$0
4
$72,662
3
$131,440
1
$30,800
0
$0
2
$64,200
APPLICATIONS DENIED
0
$0
13
$73,212
22
$126,295
8
$35,192
2
$46,850
11
$55,605
APPLICATIONS WITHDRAWN
0
$0
6
$103,607
16
$97,009
2
$45,985
2
$56,610
2
$61,815
FILES CLOSED FOR INCOMPLETENESS
0
$0
1
$141,850
8
$149,010
0
$0
0
$0
0
$0
Aggregated Statistics For Year 2005 (Based on 1 partial tract)
A) FHA, FSA/RHS & VA Home Purchase Loans
B) Conventional Home Purchase Loans
C) Refinancings
D) Home Improvement Loans
F) Non-occupant Loans on < 5 Family Dwellings (A B C & D)
G) Loans On Manufactured Home Dwelling (A B C & D)
Number
Average Value
Number
Average Value
Number
Average Value
Number
Average Value
Number
Average Value
Number
Average Value
LOANS ORIGINATED
3
$100,930
33
$105,440
33
$99,012
9
$56,249
7
$131,813
7
$43,690
APPLICATIONS APPROVED, NOT ACCEPTED
1
$49,890
9
$51,670
10
$95,046
0
$0
0
$0
8
$43,868
APPLICATIONS DENIED
2
$34,485
15
$60,501
25
$108,086
10
$21,516
3
$58,420
16
$38,093
APPLICATIONS WITHDRAWN
1
$59,860
9
$84,543
17
$129,706
1
$205,620
0
$0
2
$42,730
FILES CLOSED FOR INCOMPLETENESS
0
$0
2
$84,375
7
$118,427
0
$0
0
$0
0
$0
Aggregated Statistics For Year 2004 (Based on 1 partial tract)
A) FHA, FSA/RHS & VA Home Purchase Loans
B) Conventional Home Purchase Loans
C) Refinancings
D) Home Improvement Loans
F) Non-occupant Loans on < 5 Family Dwellings (A B C & D)
G) Loans On Manufactured Home Dwelling (A B C & D)
Number
Average Value
Number
Average Value
Number
Average Value
Number
Average Value
Number
Average Value
Number
Average Value
LOANS ORIGINATED
2
$121,030
26
$102,160
40
$125,585
7
$35,447
7
$136,213
12
$38,066
APPLICATIONS APPROVED, NOT ACCEPTED
0
$0
6
$71,360
12
$103,678
1
$57,700
0
$0
7
$61,476
APPLICATIONS DENIED
1
$138,820
12
$57,117
35
$109,033
7
$56,331
1
$122,330
13
$51,789
APPLICATIONS WITHDRAWN
0
$0
4
$70,600
16
$107,176
0
$0
1
$110,620
1
$58,130
FILES CLOSED FOR INCOMPLETENESS
0
$0
0
$0
15
$110,706
0
$0
0
$0
1
$93,700
Aggregated Statistics For Year 2003 (Based on 1 partial tract)
A) FHA, FSA/RHS & VA Home Purchase Loans
B) Conventional Home Purchase Loans
C) Refinancings
D) Home Improvement Loans
F) Non-occupant Loans on < 5 Family Dwellings (A B C & D)
Number
Average Value
Number
Average Value
Number
Average Value
Number
Average Value
Number
Average Value
LOANS ORIGINATED
3
$87,483
31
$73,270
65
$105,941
3
$20,243
4
$200,415
APPLICATIONS APPROVED, NOT ACCEPTED
2
$25,595
6
$77,795
13
$106,982
0
$0
0
$0
APPLICATIONS DENIED
2
$38,825
23
$43,625
44
$126,857
6
$17,858
1
$38,610
APPLICATIONS WITHDRAWN
0
$0
1
$166,580
30
$123,156
0
$0
1
$266,790
FILES CLOSED FOR INCOMPLETENESS
0
$0
1
$103,240
15
$159,291
0
$0
1
$166,580
Aggregated Statistics For Year 2002 (Based on 1 partial tract)
A) FHA, FSA/RHS & VA Home Purchase Loans
B) Conventional Home Purchase Loans
C) Refinancings
D) Home Improvement Loans
F) Non-occupant Loans on < 5 Family Dwellings (A B C & D)
Number
Average Value
Number
Average Value
Number
Average Value
Number
Average Value
Number
Average Value
LOANS ORIGINATED
3
$81,553
26
$77,917
43
$110,226
4
$50,212
5
$167,274
APPLICATIONS APPROVED, NOT ACCEPTED
1
$32,100
6
$49,092
8
$91,911
0
$0
0
$0
APPLICATIONS DENIED
0
$0
31
$47,592
24
$83,850
8
$21,310
3
$68,830
APPLICATIONS WITHDRAWN
0
$0
4
$89,145
19
$119,318
0
$0
1
$57,700
FILES CLOSED FOR INCOMPLETENESS
0
$0
0
$0
7
$111,300
0
$0
0
$0
Aggregated Statistics For Year 2001 (Based on 1 partial tract)
A) FHA, FSA/RHS & VA Home Purchase Loans
B) Conventional Home Purchase Loans
C) Refinancings
D) Home Improvement Loans
F) Non-occupant Loans on < 5 Family Dwellings (A B C & D)
Number
Average Value
Number
Average Value
Number
Average Value
Number
Average Value
Number
Average Value
LOANS ORIGINATED
4
$98,255
29
$68,840
49
$89,478
10
$25,854
3
$141,853
APPLICATIONS APPROVED, NOT ACCEPTED
0
$0
5
$61,512
3
$62,467
1
$19,090
0
$0
APPLICATIONS DENIED
0
$0
46
$52,990
18
$76,469
5
$8,502
3
$70,277
APPLICATIONS WITHDRAWN
0
$0
2
$91,530
10
$77,563
1
$36,010
0
$0
FILES CLOSED FOR INCOMPLETENESS
0
$0
0
$0
7
$99,154
0
$0
0
$0
Aggregated Statistics For Year 2000 (Based on 1 partial tract)
A) FHA, FSA/RHS & VA Home Purchase Loans
B) Conventional Home Purchase Loans
C) Refinancings
D) Home Improvement Loans
F) Non-occupant Loans on < 5 Family Dwellings (A B C & D)
Number
Average Value
Number
Average Value
Number
Average Value
Number
Average Value
Number
Average Value
LOANS ORIGINATED
3
$56,973
44
$78,261
23
$82,460
11
$19,915
4
$55,960
APPLICATIONS APPROVED, NOT ACCEPTED
1
$28,630
14
$56,518
4
$49,995
3
$22,990
0
$0
APPLICATIONS DENIED
1
$56,390
68
$39,827
11
$49,572
2
$6,940
3
$37,307
APPLICATIONS WITHDRAWN
1
$77,220
5
$72,532
6
$74,468
0
$0
1
$68,540
FILES CLOSED FOR INCOMPLETENESS
0
$0
1
$155,730
4
$66,588
0
$0
0
$0
Aggregated Statistics For Year 1999 (Based on 1 partial tract)
A) FHA, FSA/RHS & VA Home Purchase Loans
B) Conventional Home Purchase Loans
C) Refinancings
D) Home Improvement Loans
F) Non-occupant Loans on < 5 Family Dwellings (A B C & D)


+$1,077
-$6,257
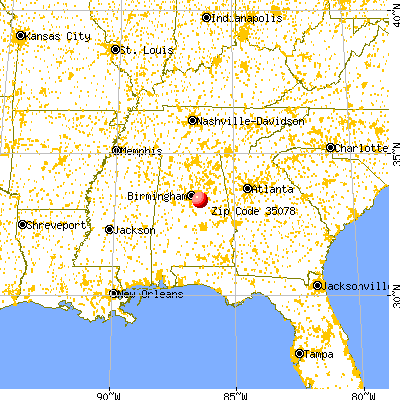
 Nearest zip codes: 35186, 35044, 35178, 35032, 35147, 35176.


