Estimated zip code population in 2022: 3,439 Zip code population in 2010: 3,866 Zip code population in 2000: 3,425
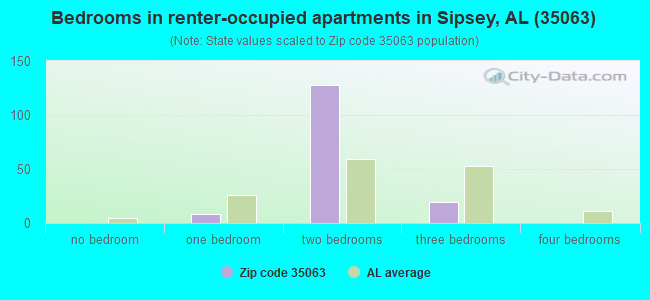
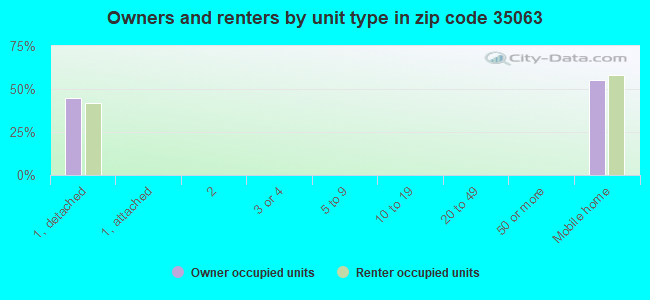
Houses and condos: 1,671 Renter-occupied apartments: 155
% of renters here:
12%
State:
30%
March 2022 cost of living index in zip code 35063: 80.7 (low, U.S. average is 100)
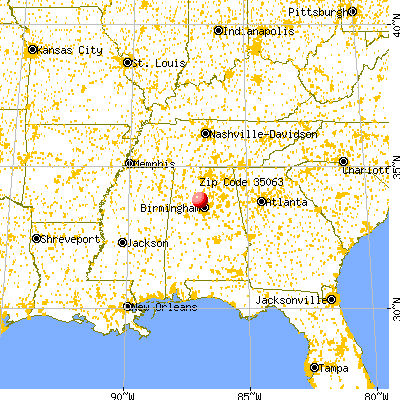
Land area: 39.2 sq. mi. Water area: 0.4 sq. mi.
Population density: 88 people per square mile
(very low).
OSM Map
General Map
Google Map
MSN Map
OSM Map
General Map
Google Map
MSN Map
OSM Map
General Map
Google Map
MSN Map
OSM Map
General Map
Google Map
MSN Map
Please wait while loading the map...
Real estate property taxes paid for housing units in 2022:
This zip code:
0.2% ($220)
Alabama:
0.4% ($718)
Median real estate property taxes paid for housing units with mortgages in 2022: $241 (0.2%) Median real estate property taxes paid for housing units with no mortgage in 2022: $214 (0.3%)
Business Search- 14 Million verified businesses
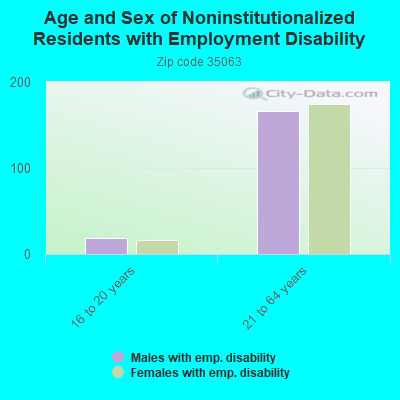
Males: 1,785
(51.9%)
Females: 1,653
(48.1%)
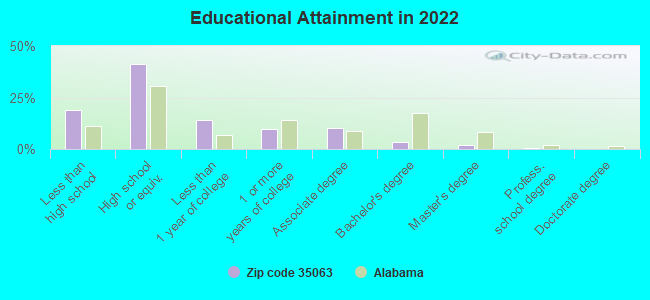
For population 25 years and over in 35063:
High school or higher: 79.0%
Bachelor's degree or higher: 5.6%
Graduate or professional degree: 2.0%
Unemployed: 2.9%
Mean travel time to work (commute): 36.3 minutes
For population 15 years and over in 35063:
Never married: 29.0%
Now married: 50.4%
Separated: 3.2%
Widowed: 7.6%
Divorced: 9.8%
Zip code 35063 compared to state average:
Median house value below state average.
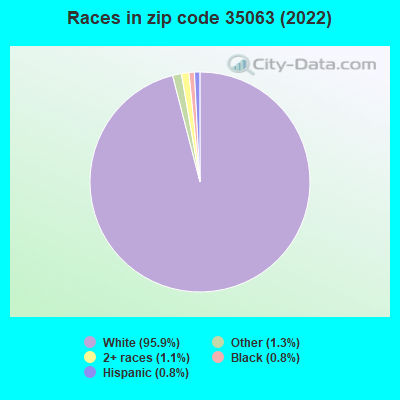
Black race population percentage significantly below state average.
Hispanic race population percentage significantly below state average.
Foreign-born population percentage significantly below state average.
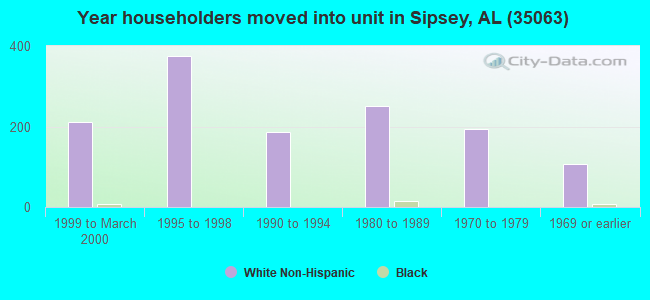
Renting percentage significantly below state average.
Length of stay since moving in above state average.
Percentage of population with a bachelor's degree or higher significantly below state average.
Averages for the 2020 tax year for zip code 35063, filed in 2021:
Average Adjusted Gross Income (AGI) in 2020: $46,694 (Individual Income Tax Returns)
Here:
$46,694
State:
$63,984
Salary/wage: $43,353 (reported on 84.3% of returns)
Here:
$43,353
State:
$52,834
(% of AGI for various income ranges: 1109.0% for AGIs below $25k, 3607.7% for AGIs $25k-50k, 6868.6% for AGIs $50k-75k, 9980.0% for AGIs $75k-100k, 18158.8% for AGIs $100k-200k)
Taxable interest for individuals: $600 (reported on 17.3% of returns)
This zip code:
$600
Alabama:
$1,615
(% of AGI for various income ranges: 10.0% for AGIs below $25k, 14.3% for AGIs $25k-50k, 17.1% for AGIs $50k-75k, 14.3% for AGIs $75k-100k, 18.8% for AGIs $100k-200k)
Ordinary dividends: $1,220 (reported on 3.9% of returns)
Here:
$1,220
State:
$7,660
(% of AGI for various income ranges: 13.0% for AGIs $25k-50k, 31.4% for AGIs $75k-100k)
Net capital gain/loss in AGI: +$1,325 (reported on 3.1% of returns)
Here:
+$1,325
State:
+$23,528
(% of AGI for various income ranges: 75.7% for AGIs $75k-100k)
Profit/loss from business: +$6,606 (reported on 13.4% of returns)
Here:
+$6,606
State:
+$9,534
(% of AGI for various income ranges: 171.8% for AGIs below $25k, 42.3% for AGIs $25k-50k, 83.6% for AGIs $50k-75k, 274.3% for AGIs $75k-100k)
Taxable individual retirement arrangement distribution: $14,200 (reported on 6.3% of returns)
35063:
$14,200
Alabama:
$19,004
(% of AGI for various income ranges: 51.0% for AGIs below $25k, 122.7% for AGIs $25k-50k, 805.7% for AGIs $75k-100k)
Total itemized deductions: $30,850 (reported on 1.6% of returns)
Here:
$30,850
State:
$37,338
(% of AGI for various income ranges: 205.7% for AGIs $25k-50k)
Taxes paid: $5,300 (reported on 1.6% of returns)
35063:
$5,300
State:
$6,484
(% of AGI for various income ranges: 35.3% for AGIs $25k-50k)
Earned income credit: $2,684 (reported on 24.4% of returns)
Here:
$2,684
State:
$2,628
(% of AGI for various income ranges: 137.2% for AGIs below $25k, 94.3% for AGIs $25k-50k)
Percentage of individuals using paid preparers for their 2020 taxes: 95.3%
Here:
95%
State:
93%
(% for various income ranges: 93.9% for AGIs below $25k, 97.2% for AGIs $25k-50k, 94.7% for AGIs $50k-75k, 100.0% for AGIs $75k-100k, 92.3% for AGIs $100k-200k)
Averages for the 2012 tax year for zip code 35063, filed in 2013:
Average Adjusted Gross Income (AGI) in 2012: $39,534 (Individual Income Tax Returns)
Here:
$39,534
State:
$52,001
Salary/wage: $37,666 (reported on 84.7% of returns)
Here:
$37,666
State:
$43,822
(% of AGI for various income ranges: 72.7% for AGIs below $25k, 82.1% for AGIs $25k-50k, 85.7% for AGIs $50k-75k, 86.0% for AGIs $75k-100k, 72.0% for AGIs $100k-200k)
Taxable interest for individuals: $683 (reported on 19.4% of returns)
This zip code:
$683
Alabama:
$1,592
(% of AGI for various income ranges: 1.1% for AGIs below $25k, 0.3% for AGIs $25k-50k, 0.2% for AGIs $50k-75k)
Ordinary dividends: $1,088 (reported on 6.5% of returns)
Here:
$1,088
State:
$5,697
(% of AGI for various income ranges: 0.5% for AGIs below $25k, 0.3% for AGIs $50k-75k, 0.1% for AGIs $75k-100k)
Net capital gain/loss in AGI: +$1,533 (reported on 2.4% of returns)
Here:
+$1,533
State:
+$13,286
Profit/loss from business: +$6,900 (reported on 12.9% of returns)
Here:
+$6,900
State:
+$9,151
(% of AGI for various income ranges: 10.7% for AGIs below $25k, 2.3% for AGIs $25k-50k, 0.7% for AGIs $50k-75k)
Taxable individual retirement arrangement distribution: $11,400 (reported on 5.6% of returns)
35063:
$11,400
Alabama:
$14,992
(% of AGI for various income ranges: 2.1% for AGIs below $25k, 1.7% for AGIs $25k-50k, 3.7% for AGIs $50k-75k)
Total itemized deductions: $18,283 (27% of AGI, reported on 18.5% of returns)
Here:
$18,283
State:
$21,388
Here:
26.6% of AGI
State:
20.1% of AGI
(% of AGI for various income ranges: 7.1% for AGIs below $25k, 6.9% for AGIs $25k-50k, 9.2% for AGIs $50k-75k, 9.4% for AGIs $75k-100k, 10.3% for AGIs $100k-200k)
Charity contributions: $4,389 (reported on 15.3% of returns)
Here:
$4,389
State:
$5,925
(% of AGI for various income ranges: 0.8% for AGIs below $25k, 1.8% for AGIs $25k-50k, 1.5% for AGIs $50k-75k, 2.2% for AGIs $75k-100k, 2.2% for AGIs $100k-200k)
Taxes paid: $3,505 (reported on 17.7% of returns)
35063:
$3,505
State:
$5,272
(% of AGI for various income ranges: 0.5% for AGIs below $25k, 1.0% for AGIs $25k-50k, 1.5% for AGIs $50k-75k, 1.8% for AGIs $75k-100k, 3.2% for AGIs $100k-200k)
Earned income credit: $2,651 (reported on 28.2% of returns)
Here:
$2,651
State:
$2,646
(% of AGI for various income ranges: 10.8% for AGIs below $25k, 1.4% for AGIs $25k-50k)
Percentage of individuals using paid preparers for their 2012 taxes: 63.7%
Here:
64%
State:
60%
(% for various income ranges: 59.3% for AGIs below $25k, 66.7% for AGIs $25k-50k, 65.0% for AGIs $50k-75k, 63.6% for AGIs $75k-100k, 83.3% for AGIs $100k-200k)
Averages for the 2004 tax year for zip code 35063, filed in 2005:
Average Adjusted Gross Income (AGI) in 2004: $34,313 (Individual Income Tax Returns)
Here:
$34,313
State:
$42,302
Salary/wage: $33,222 (reported on 88.1% of returns)
Here:
$33,222
State:
$36,626
(% of AGI for various income ranges: 84.1% for AGIs below $10k, 80.9% for AGIs $10k-25k, 87.4% for AGIs $25k-50k, 90.1% for AGIs $50k-75k, 90.1% for AGIs $75k-100k, 63.0% for AGIs over 100k)
Taxable interest for individuals: $1,228 (reported on 23.8% of returns)
This zip code:
$1,228
Alabama:
$1,827
(% of AGI for various income ranges: 3.5% for AGIs below $10k, 1.6% for AGIs $10k-25k, 0.6% for AGIs $25k-50k, 0.8% for AGIs $50k-75k, 0.4% for AGIs $75k-100k, 0.6% for AGIs over 100k)
Taxable dividends: $1,056 (reported on 8.5% of returns)
Here:
$1,056
State:
$4,206
(% of AGI for various income ranges: 0.1% for AGIs $10k-25k, 0.6% for AGIs $25k-50k, 0.0% for AGIs $50k-75k, 0.4% for AGIs $75k-100k)
Net capital gain/loss: +$3,815 (reported on 5.1% of returns)
Here:
+$3,815
State:
+$13,031
(% of AGI for various income ranges: -0.1% for AGIs $10k-25k, -0.0% for AGIs $25k-50k, 0.1% for AGIs $50k-75k, -0.0% for AGIs $75k-100k, 6.5% for AGIs over 100k)
Profit/loss from business: +$4,122 (reported on 13.5% of returns)
Here:
+$4,122
State:
+$8,302
(% of AGI for various income ranges: 8.2% for AGIs below $10k, 6.3% for AGIs $10k-25k, 1.9% for AGIs $25k-50k, -0.1% for AGIs $50k-75k, -0.3% for AGIs $75k-100k)
IRA payment deduction: $2,250 (reported on 0.9% of returns)
35063:
$2,250
Alabama:
$3,006
Total itemized deductions: $14,446 (24% of AGI, reported on 20.3% of returns)
Here:
$14,446
State:
$17,623
Here:
24.4% of AGI
State:
20.8% of AGI
(% of AGI for various income ranges: 8.2% for AGIs $10k-25k, 6.5% for AGIs $25k-50k, 8.6% for AGIs $50k-75k, 12.0% for AGIs $75k-100k, 12.9% for AGIs over 100k)
Charity contributions deductions: $3,509 (6% of AGI, reported on 18.1% of returns)
Here:
$3,509
State:
$4,768
Here:
5.8% of AGI
State:
5.4% of AGI
(% of AGI for various income ranges: 1.1% for AGIs $10k-25k, 1.3% for AGIs $25k-50k, 1.7% for AGIs $50k-75k, 3.4% for AGIs $75k-100k, 3.5% for AGIs over 100k)
Total tax: $3,602 (reported on 71.4% of returns)
35063:
$3,602
State:
$6,905
(% of AGI for various income ranges: 3.0% for AGIs below $10k, 3.6% for AGIs $10k-25k, 5.8% for AGIs $25k-50k, 8.3% for AGIs $50k-75k, 10.0% for AGIs $75k-100k, 14.6% for AGIs over 100k)
Earned income credit: $1,942 (reported on 25.8% of returns)
Here:
$1,942
State:
$2,048
Percentage of individuals using paid preparers for their 2004 taxes: 69.3%
Here:
69%
State:
65%
(% for various income ranges: 61.9% for AGIs below $10k, 71.4% for AGIs $10k-25k, 73.6% for AGIs $25k-50k, 66.7% for AGIs $50k-75k, 61.8% for AGIs $75k-100k, 83.3% for AGIs over 100k)
Household received Food Stamps/SNAP in the past 12 months: 238 Household did not receive Food Stamps/SNAP in the past 12 months: 1,083
Women who had a birth in the past 12 months: 107 (52 now married, 48 unmarried) Women who did not have a birth in the past 12 months: 707 (341 now married, 365 unmarried)
Housing units in zip code 35063 with a mortgage: 350 (23 second mortgage, 13 both second mortgage and home equity loan) Median monthly owner costs for units with a mortgage: $1,095 Median monthly owner costs for units without a mortgage: $344
Residents with income below the poverty level in 2022:
This zip code:
23.3%
Whole state:
16.2%
Residents with income below 50% of the poverty level in 2022:
This zip code:
8.2%
Whole state:
8.6%
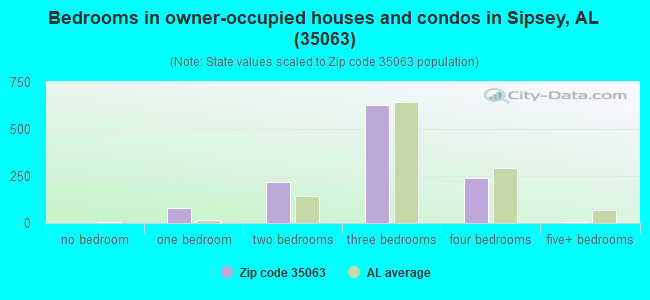
Median number of rooms in houses and condos:
Here:
6.0
State:
6.5
Median number of rooms in apartments:
Here:
4.2
State:
4.7
Notable locations in this zip code not listed on our city pages
Notable locations in zip code 35063: Corner Volunteer Fire and Rescue Service Station 1 (A), Empire Volunteer Fire Department (B). Display/hide their locations on the map
Churches in zip code 35063 include: New Canaan Church (A), Phillips Chapel (B), Phillips Church (C), Temple Hill Church (D), Antioch Church (E), Dilworth Memorial Church (F), Empire Church (G), Owens Chapel Church (H), Dilworth Church (I). Display/hide their locations on the map
Streams, rivers, and creeks: Pinhook Creek (A), Old Town Creek (B), No Business Creek (C), Mullen Branch (D), Sloan Creek (E), Little Creek (F), Cordell Creek (G), Sipsey Fork (H), Gleade Branch (I). Display/hide their locations on the map
Size of family households: 446 2-persons, 213 3-persons, 165 4-persons, 100 5-persons, 16 6-persons
Size of nonfamily households: 297 1-person, 56 2-persons, 16 3-persons
345 married couples with children.
185 single-parent households (44 men, 141 women).
98.9% of residents of 35063 zip code speak English at home.
0.3% of residents speak Spanish at home (100% very well).
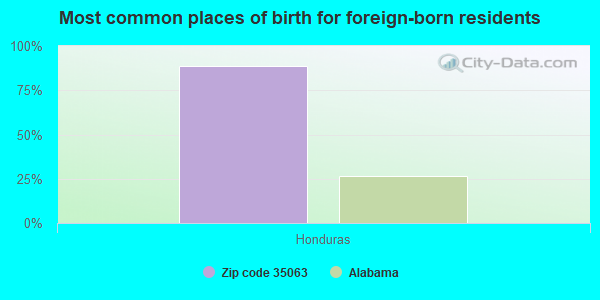
Foreign born population: 9 (0.3%) (100.0% of them are naturalized citizens)
This zip code:
0.3%
Whole state:
3.8%
89%Honduras
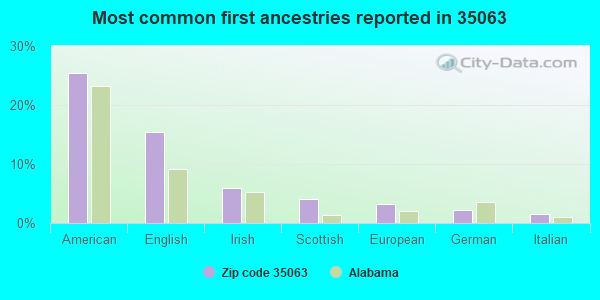
25%American
15%English
6%Irish
4%Scottish
3%European
2%German
2%Italian
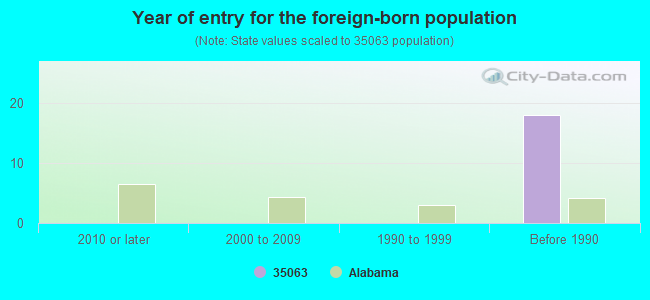
Year of entry for the foreign-born population
02010 or later
02000 to 2009
01990 to 1999
18Before 1990
Facilities with environmental interests located in this zip code:
EMPIRE TOWN CREEK MINE (MCWANE INCORPORATION in EMPIRE, AL)
National Pollutant Discharge Elimination System NON-MAJOR (Tracking pollutant discharge elimination systems) - permit Business SIC classification: BITUMINOUS COAL AND LIGNITE SURFACE MINING Alternative names: MCWANE INC EMPIRE TOWN CREEK, MCWANE INCORPORATION
AMERICAN CONCRETE PRODUCTS INC (MAGBEE BEND in EMPIRE, AL)
National Pollutant Discharge Elimination System NON-MAJOR (Tracking pollutant discharge elimination systems) - permit Business SIC classification: CONCRETE PRODUCTS, EXCEPT BLOCK AND BRICK
Housing units lacking complete plumbing facilities: 11.8% Housing units lacking complete kitchen facilities: 12.2%
77.0%Electricity
13.2%Bottled, tank, or LP gas
6.3%Utility gas
2.9%Other fuel
0.8%Wood
Population in 1990: 2,429. Population change in the 1990s: +996 (+41.0%).
Place of birth for U.S.-born residents:
This state: 2,956
Northeast: 26
Midwest: 221
South: 161
West: 12
63% of the 35063 zip code residents lived in the same house 5 years ago. Out of people who lived in different houses, 54% lived in this county. Out of people who lived in different counties, 50% lived in Alabama.
92% of the 35063 zip code residents lived in the same house 1 year ago. Out of people who lived in different houses, 8% moved from this county. Out of people who lived in different houses, 96% moved from different county within same state.
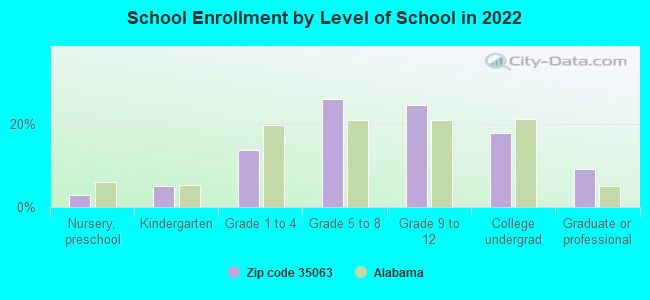
Private vs. public school enrollment:
Students in private schools in grades 1 to 8 (elementary and middle school): 9
Here:
5.0%
Alabama:
14.7%
Students in private schools in grades 9 to 12 (high school): 49
Here:
39.1%
Alabama:
16.3%
Students in private undergraduate colleges:
Here:
0.0%
Alabama:
14.6%
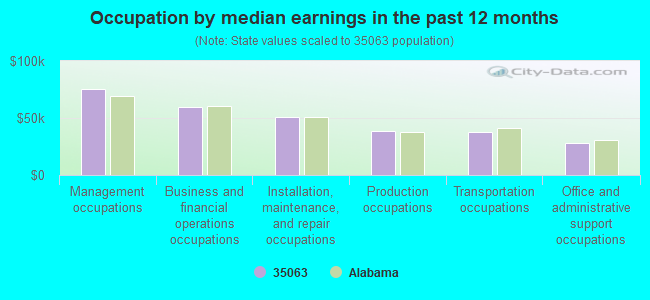
Occupation by median earnings in the past 12 months ($)
75,630Management occupations
59,761Business and financial operations occupations
51,215Installation, maintenance, and repair occupations
38,768Production occupations
37,393Transportation occupations
28,015Office and administrative support occupations
Companies with federal contracts located in this zip code:
HARRY SHELIA (7510 OLD BAGLEY ROAD in EMPIRE, AL; small business) : $10,120 in 6 contractsin 2004
Contracts for Recreation Site Maintenance Services (non-construction) by U.S. Army Corps of Engineers - civil program financing only, Army Signed by year:2000: $0; 2001: $0; 2002: $0; 2003: $0; 2004: $10,120; 2005: $0; 2006: $0.
Biggest contracts:
$6,720 with U.S. Army Corps of Engineers - civil program financing only for Recreation Site Maintenance Services (non-construction). Signed on 2004-03-17. Completion date: 2004-09-13.
$6,720 with Army for Recreation Site Maintenance Services (non-construction). Signed on 2004-03-17. Completion date: 2004-09-13.
$2,388, same as above.Signed on 2004-04-22. Completion date: 2004-09-13.
$2,388 with U.S. Army Corps of Engineers - civil program financing only for Recreation Site Maintenance Services (non-construction). Signed on 2004-04-22. Completion date: 2004-09-13.
Top industries in this zip code by the number of employees in 2005:
Other Services (except Public Administration): Religious Organizations (5-9 employees: 2 establishments, 1-4 employees: 3 establishments)
Wholesale Trade: Coal and Other Mineral and Ore Merchant Wholesalers (5-9: 1)
Administrative and Support and Waste Management and Remediation Services: Septic Tank and Related Services (5-9: 1)
Health Care and Social Assistance: Child Day Care Services (5-9: 1)
Finance and Insurance: Commercial Banking (5-9: 1)
Construction: Plumbing, Heating, and Air-Conditioning Contractors (5-9: 1)
Other Services (except Public Administration): Commercial and Industrial Machinery and Equipment (except Automotive and Electronic) Repair and Maintenance (1-4: 2)
Professional, Scientific, and Technical Services: Drafting Services (1-4: 1)
Fatal accident statistics in 2014:
Fatal accident count: 1
Vehicles involved in fatal accidents: 1
Fatal accidents caused by drunken drivers: 1
Fatalities: 1
Persons involved in fatal accidents: 3
Pedestrians involved in fatal accidents: 0
Fatal accident statistics in 2011:
Fatal accident count: 1
Vehicles involved in fatal accidents: 2
Fatal accidents caused by drunken drivers: 0
Fatalities: 1
Persons involved in fatal accidents: 5
Pedestrians involved in fatal accidents: 0
Home Mortgage Disclosure Act Aggregated Statistics For Year 2009 (Based on 2 partial tracts)
A) FHA, FSA/RHS & VA Home Purchase Loans
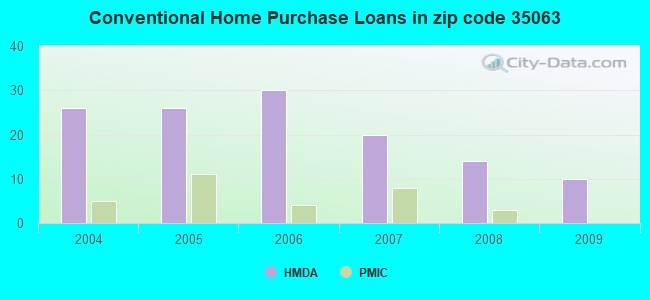
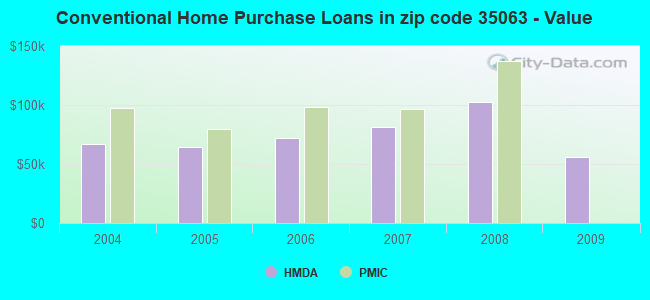
B) Conventional Home Purchase Loans
C) Refinancings
D) Home Improvement Loans
F) Non-occupant Loans on < 5 Family Dwellings (A B C & D)
G) Loans On Manufactured Home Dwelling (A B C & D)
Number
Average Value
Number
Average Value
Number
Average Value
Number
Average Value
Number
Average Value
Number
Average Value
LOANS ORIGINATED
3
$127,533
10
$56,072
25
$113,646
1
$12,920
3
$51,300
9
$39,667
APPLICATIONS APPROVED, NOT ACCEPTED
0
$0
5
$43,948
2
$83,735
0
$0
0
$0
5
$37,374
APPLICATIONS DENIED
4
$74,048
7
$51,553
17
$92,823
2
$54,900
2
$31,145
7
$32,423
APPLICATIONS WITHDRAWN
0
$0
2
$143,400
11
$122,046
0
$0
0
$0
0
$0
FILES CLOSED FOR INCOMPLETENESS
0
$0
2
$45,605
2
$161,450
0
$0
1
$9,090
2
$44,935
Aggregated Statistics For Year 2008 (Based on 2 partial tracts)
A) FHA, FSA/RHS & VA Home Purchase Loans
B) Conventional Home Purchase Loans
C) Refinancings
D) Home Improvement Loans
F) Non-occupant Loans on < 5 Family Dwellings (A B C & D)
G) Loans On Manufactured Home Dwelling (A B C & D)
Number
Average Value
Number
Average Value
Number
Average Value
Number
Average Value
Number
Average Value
Number
Average Value
LOANS ORIGINATED
7
$127,107
14
$102,705
17
$99,791
6
$27,107
4
$72,885
8
$89,738
APPLICATIONS APPROVED, NOT ACCEPTED
2
$83,850
4
$53,088
2
$66,710
2
$25,125
0
$0
3
$58,313
APPLICATIONS DENIED
2
$61,095
9
$77,053
15
$88,551
7
$39,946
1
$34,280
5
$75,232
APPLICATIONS WITHDRAWN
1
$115,840
2
$100,030
10
$102,887
1
$109,360
1
$57,640
1
$36,370
FILES CLOSED FOR INCOMPLETENESS
1
$49,660
1
$121,710
3
$130,217
0
$0
0
$0
0
$0
Aggregated Statistics For Year 2007 (Based on 2 partial tracts)
A) FHA, FSA/RHS & VA Home Purchase Loans
B) Conventional Home Purchase Loans
C) Refinancings
D) Home Improvement Loans
F) Non-occupant Loans on < 5 Family Dwellings (A B C & D)
G) Loans On Manufactured Home Dwelling (A B C & D)
Number
Average Value
Number
Average Value
Number
Average Value
Number
Average Value
Number
Average Value
Number
Average Value
LOANS ORIGINATED
2
$130,585
20
$81,073
26
$82,204
10
$50,881
6
$35,602
7
$60,063
APPLICATIONS APPROVED, NOT ACCEPTED
1
$78,340
6
$67,155
3
$87,220
1
$23,610
0
$0
4
$57,792
APPLICATIONS DENIED
0
$0
19
$62,885
26
$81,414
13
$39,811
0
$0
13
$54,633
APPLICATIONS WITHDRAWN
0
$0
6
$109,857
10
$88,231
2
$94,570
0
$0
4
$82,190
FILES CLOSED FOR INCOMPLETENESS
0
$0
2
$56,805
3
$114,483
0
$0
0
$0
0
$0
Aggregated Statistics For Year 2006 (Based on 2 partial tracts)
A) FHA, FSA/RHS & VA Home Purchase Loans
B) Conventional Home Purchase Loans
C) Refinancings
D) Home Improvement Loans
F) Non-occupant Loans on < 5 Family Dwellings (A B C & D)
G) Loans On Manufactured Home Dwelling (A B C & D)
Number
Average Value
Number
Average Value
Number
Average Value
Number
Average Value
Number
Average Value
Number
Average Value
LOANS ORIGINATED
2
$88,335
30
$72,119
29
$77,754
7
$34,453
4
$26,595
14
$46,541
APPLICATIONS APPROVED, NOT ACCEPTED
1
$63,650
11
$45,703
5
$50,372
2
$50,675
0
$0
10
$46,124
APPLICATIONS DENIED
2
$50,960
17
$61,175
27
$87,226
12
$24,256
1
$34,980
16
$49,374
APPLICATIONS WITHDRAWN
1
$69,250
6
$83,848
14
$103,521
1
$29,380
0
$0
1
$149,690
FILES CLOSED FOR INCOMPLETENESS
0
$0
1
$41,970
7
$103,840
1
$121,010
0
$0
0
$0
Aggregated Statistics For Year 2005 (Based on 2 partial tracts)
A) FHA, FSA/RHS & VA Home Purchase Loans
B) Conventional Home Purchase Loans
C) Refinancings
D) Home Improvement Loans
F) Non-occupant Loans on < 5 Family Dwellings (A B C & D)
G) Loans On Manufactured Home Dwelling (A B C & D)
Number
Average Value
Number
Average Value
Number
Average Value
Number
Average Value
Number
Average Value
Number
Average Value
LOANS ORIGINATED
4
$93,395
26
$64,266
31
$71,341
7
$30,611
6
$53,405
15
$37,402
APPLICATIONS APPROVED, NOT ACCEPTED
1
$46,870
12
$48,548
11
$70,160
1
$78,840
0
$0
11
$42,294
APPLICATIONS DENIED
0
$0
35
$59,491
37
$79,719
11
$39,150
1
$61,020
31
$51,873
APPLICATIONS WITHDRAWN
1
$54,700
5
$66,268
14
$100,416
3
$120,707
0
$0
3
$58,780
FILES CLOSED FOR INCOMPLETENESS
0
$0
0
$0
9
$98,009
1
$91,830
0
$0
0
$0
Aggregated Statistics For Year 2004 (Based on 2 partial tracts)
A) FHA, FSA/RHS & VA Home Purchase Loans
B) Conventional Home Purchase Loans
C) Refinancings
D) Home Improvement Loans
F) Non-occupant Loans on < 5 Family Dwellings (A B C & D)
G) Loans On Manufactured Home Dwelling (A B C & D)
Detailed PMIC statistics for the following Tracts:0218.00
, 0219.00
2003 - 2018 National Fire Incident Reporting System (NFIRS) incidents
According to the data from the years 2003 - 2018 the average number of fires per year is 21. The highest number of fire incidents - 55 took place in 2006, and the least - 1 in 2009. The data has a dropping trend.
When looking into fire subcategories, the most reports belonged to: Outside Fires (45.4%), and Structure Fires (31.9%).
Fire incident types reported to NFIRS in Zip Code 35063


 Nearest zip codes: 35584, 35148, 35062, 35033, 35139, 35550.


 According to the data from the years 2003 - 2018 the average number of fires per year is 21. The highest number of fire incidents - 55 took place in 2006, and the least - 1 in 2009. The data has a dropping trend.
 When looking into fire subcategories, the most reports belonged to: Outside Fires (45.4%), and Structure Fires (31.9%).