Averages for the 2020 tax year for zip code 32053, filed in 2021:
Average Adjusted Gross Income (AGI) in 2020: $43,741 (Individual Income Tax Returns)
Here:
$43,741
State:
$82,200
Salary/wage: $38,570 (reported on 79.1% of returns)
Here:
$38,570
State:
$58,347
(% of AGI for various income ranges: 1361.5% for AGIs below $25k, 3635.5% for AGIs $25k-50k, 6273.1% for AGIs $50k-75k, 9675.7% for AGIs $75k-100k, 12304.4% for AGIs $100k-200k)
Taxable interest for individuals: $1,196 (reported on 16.5% of returns)
This zip code:
$1,196
Florida:
$4,272
(% of AGI for various income ranges: 4.6% for AGIs below $25k, 8.7% for AGIs $25k-50k, 23.1% for AGIs $50k-75k, 11.4% for AGIs $75k-100k, 245.6% for AGIs $100k-200k)
Ordinary dividends: $2,275 (reported on 7.6% of returns)
Here:
$2,275
State:
$15,863
(% of AGI for various income ranges: 11.5% for AGIs below $25k, 53.8% for AGIs $50k-75k, 156.7% for AGIs $100k-200k)
Net capital gain/loss in AGI: +$12,533 (reported on 7.6% of returns)
Here:
+$12,533
State:
+$62,983
(% of AGI for various income ranges: 27.7% for AGIs $25k-50k, 252.9% for AGIs $75k-100k, 1378.9% for AGIs $100k-200k)
Profit/loss from business: +$4,788 (reported on 15.2% of returns)
Here:
+$4,788
State:
+$9,719
(% of AGI for various income ranges: 122.4% for AGIs below $25k, 58.1% for AGIs $25k-50k, 163.8% for AGIs $50k-75k, 105.6% for AGIs $100k-200k)
Taxable individual retirement arrangement distribution: $17,164 (reported on 7.0% of returns)
32053:
$17,164
Florida:
$24,823
(% of AGI for various income ranges: 66.3% for AGIs below $25k, 555.4% for AGIs $50k-75k, 897.8% for AGIs $100k-200k)
Total itemized deductions: $27,857 (reported on 4.4% of returns)
Here:
$27,857
State:
$45,393
(% of AGI for various income ranges: 299.7% for AGIs $25k-50k, 1134.4% for AGIs $100k-200k)
Charity contributions: $13,350 (reported on 2.5% of returns)
Here:
$13,350
State:
$20,178
(% of AGI for various income ranges: 81.6% for AGIs $25k-50k, 312.2% for AGIs $100k-200k)
Taxes paid: $4,533 (reported on 3.8% of returns)
32053:
$4,533
State:
$6,967
(% of AGI for various income ranges: 32.6% for AGIs $25k-50k, 190.0% for AGIs $100k-200k)
Earned income credit: $2,707 (reported on 27.8% of returns)
Here:
$2,707
State:
$2,306
(% of AGI for various income ranges: 170.6% for AGIs below $25k, 87.1% for AGIs $25k-50k)
Percentage of individuals using paid preparers for their 2020 taxes: 89.2%
Here:
89%
State:
92%
(% for various income ranges: 89.2% for AGIs below $25k, 89.7% for AGIs $25k-50k, 94.4% for AGIs $50k-75k, 90.9% for AGIs $75k-100k, 84.6% for AGIs $100k-200k, 66.7% for AGIs over 200k)
Averages for the 2012 tax year for zip code 32053, filed in 2013:
Average Adjusted Gross Income (AGI) in 2012: $36,433 (Individual Income Tax Returns)
Here:
$36,433
State:
$60,316
Salary/wage: $30,669 (reported on 85.8% of returns)
Here:
$30,669
State:
$45,277
(% of AGI for various income ranges: 84.8% for AGIs below $25k, 80.4% for AGIs $25k-50k, 73.6% for AGIs $50k-75k, 76.1% for AGIs $75k-100k, 50.1% for AGIs $100k-200k)
Taxable interest for individuals: $2,200 (reported on 17.6% of returns)
This zip code:
$2,200
Florida:
$3,587
(% of AGI for various income ranges: 0.6% for AGIs below $25k, 2.6% for AGIs $25k-50k, 0.4% for AGIs $50k-75k, 0.6% for AGIs $75k-100k, 0.9% for AGIs $100k-200k)
Ordinary dividends: $3,336 (reported on 7.4% of returns)
Here:
$3,336
State:
$12,831
(% of AGI for various income ranges: 1.4% for AGIs below $25k, 1.3% for AGIs $50k-75k, 0.5% for AGIs $100k-200k)
Net capital gain/loss in AGI: +$18,233 (reported on 6.1% of returns)
Here:
+$18,233
State:
+$33,493
(% of AGI for various income ranges: 3.0% for AGIs $50k-75k, 10.5% for AGIs $100k-200k)
Profit/loss from business: +$4,271 (reported on 9.5% of returns)
Here:
+$4,271
State:
+$10,012
(% of AGI for various income ranges: 4.5% for AGIs below $25k, 0.3% for AGIs $25k-50k, 0.7% for AGIs $75k-100k)
Taxable individual retirement arrangement distribution: $13,800 (reported on 6.1% of returns)
32053:
$13,800
Florida:
$21,544
(% of AGI for various income ranges: 1.6% for AGIs below $25k, 1.9% for AGIs $25k-50k, 3.7% for AGIs $50k-75k, 6.1% for AGIs $75k-100k)
Total itemized deductions: $18,743 (26% of AGI, reported on 14.2% of returns)
Here:
$18,743
State:
$25,533
Here:
25.9% of AGI
State:
18.0% of AGI
(% of AGI for various income ranges: 2.5% for AGIs below $25k, 7.2% for AGIs $25k-50k, 12.2% for AGIs $50k-75k, 9.1% for AGIs $75k-100k, 6.3% for AGIs $100k-200k)
Charity contributions: $5,260 (reported on 10.1% of returns)
Here:
$5,260
State:
$5,698
(% of AGI for various income ranges: 1.2% for AGIs $25k-50k, 2.4% for AGIs $50k-75k, 2.0% for AGIs $75k-100k, 1.9% for AGIs $100k-200k)
Taxes paid: $3,324 (reported on 14.2% of returns)
32053:
$3,324
State:
$6,203
(% of AGI for various income ranges: 0.4% for AGIs below $25k, 1.2% for AGIs $25k-50k, 1.8% for AGIs $50k-75k, 1.7% for AGIs $75k-100k, 1.5% for AGIs $100k-200k)
Earned income credit: $2,605 (reported on 29.7% of returns)
Here:
$2,605
State:
$2,372
(% of AGI for various income ranges: 8.4% for AGIs below $25k, 1.7% for AGIs $25k-50k)
Percentage of individuals using paid preparers for their 2012 taxes: 54.1%
Here:
54%
State:
54%
(% for various income ranges: 53.2% for AGIs below $25k, 48.6% for AGIs $25k-50k, 61.1% for AGIs $50k-75k, 62.5% for AGIs $75k-100k, 62.5% for AGIs $100k-200k)
Averages for the 2004 tax year for zip code 32053, filed in 2005:
Average Adjusted Gross Income (AGI) in 2004: $30,483 (Individual Income Tax Returns)
Here:
$30,483
State:
$50,523
Salary/wage: $27,580 (reported on 85.0% of returns)
Here:
$27,580
State:
$39,563
(% of AGI for various income ranges: 99.9% for AGIs below $10k, 85.8% for AGIs $10k-25k, 83.7% for AGIs $25k-50k, 78.9% for AGIs $50k-75k, 80.8% for AGIs $75k-100k, 35.2% for AGIs over 100k)
Taxable interest for individuals: $1,515 (reported on 25.6% of returns)
This zip code:
$1,515
Florida:
$3,211
(% of AGI for various income ranges: 3.6% for AGIs below $10k, 1.0% for AGIs $10k-25k, 1.1% for AGIs $25k-50k, 1.9% for AGIs $50k-75k, 1.1% for AGIs $75k-100k, 0.5% for AGIs over 100k)
Taxable dividends: $1,350 (reported on 8.1% of returns)
Here:
$1,350
State:
$6,129
(% of AGI for various income ranges: 0.3% for AGIs $10k-25k, 0.3% for AGIs $25k-50k, 0.2% for AGIs $50k-75k, 0.3% for AGIs $75k-100k, 1.1% for AGIs over 100k)
Net capital gain/loss: +$7,663 (reported on 8.2% of returns)
Here:
+$7,663
State:
+$27,205
(% of AGI for various income ranges: 1.3% for AGIs below $10k, -0.2% for AGIs $10k-25k, 0.7% for AGIs $25k-50k, 0.2% for AGIs $50k-75k, 3.8% for AGIs $75k-100k, 10.6% for AGIs over 100k)
Profit/loss from business: +$3,506 (reported on 12.5% of returns)
Here:
+$3,506
State:
+$10,634
(% of AGI for various income ranges: 7.2% for AGIs below $10k, 3.9% for AGIs $10k-25k, 1.5% for AGIs $25k-50k, 0.2% for AGIs $50k-75k)
IRA payment deduction: $1,600 (reported on 1.2% of returns)
32053:
$1,600
Florida:
$3,082
Total itemized deductions: $17,066 (29% of AGI, reported on 14.3% of returns)
Here:
$17,066
State:
$20,370
Here:
29.2% of AGI
State:
20.7% of AGI
(% of AGI for various income ranges: 5.7% for AGIs $10k-25k, 6.9% for AGIs $25k-50k, 10.4% for AGIs $50k-75k, 12.3% for AGIs $75k-100k, 7.7% for AGIs over 100k)
Charity contributions deductions: $3,660 (6% of AGI, reported on 11.6% of returns)
Here:
$3,660
State:
$4,064
Here:
6.0% of AGI
State:
3.8% of AGI
(% of AGI for various income ranges: 0.6% for AGIs $10k-25k, 0.7% for AGIs $25k-50k, 1.8% for AGIs $50k-75k, 3.0% for AGIs $75k-100k, 2.4% for AGIs over 100k)
Total tax: $3,792 (reported on 61.5% of returns)
32053:
$3,792
State:
$9,431
(% of AGI for various income ranges: 2.2% for AGIs below $10k, 2.8% for AGIs $10k-25k, 5.9% for AGIs $25k-50k, 8.3% for AGIs $50k-75k, 10.7% for AGIs $75k-100k, 16.0% for AGIs over 100k)
Earned income credit: $2,000 (reported on 32.0% of returns)
Here:
$2,000
State:
$1,808
Percentage of individuals using paid preparers for their 2004 taxes: 66.0%
Here:
66%
State:
60%
(% for various income ranges: 61.4% for AGIs below $10k, 70.9% for AGIs $10k-25k, 65.4% for AGIs $25k-50k, 59.9% for AGIs $50k-75k, 64.3% for AGIs $75k-100k, 76.5% for AGIs over 100k)
Household received Food Stamps/SNAP in the past 12 months: 539 Household did not receive Food Stamps/SNAP in the past 12 months: 870
Women who had a birth in the past 12 months: 189 (135 now married, 56 unmarried) Women who did not have a birth in the past 12 months: 624 (273 now married, 351 unmarried)
Housing units in zip code 32053 with a mortgage: 367 (43 second mortgage, 43 both second mortgage and home equity loan) Median monthly owner costs for units with a mortgage: $1,098 Median monthly owner costs for units without a mortgage: $292
Residents with income below the poverty level in 2022:
This zip code:
34.3%
Whole state:
12.7%
Residents with income below 50% of the poverty level in 2022:
This zip code:
18.7%
Whole state:
6.6%
Median number of rooms in houses and condos:
Here:
5.8
State:
5.9
Median number of rooms in apartments:
Here:
4.9
State:
4.2
Notable locations in this zip code not listed on our city pages
Notable locations in zip code 32053: Jennings Fire Department (A), Hamilton County Fire and Rescue Department Bellville Station (B). Display/hide their locations on the map
Churches in zip code 32053 include: Burnham Church (A), West Lake Church (B), Oak Grove Church (C), New Hope Church (D), Mount Olive Church (E), Triumph Holines Church (F), Saint Marys Baptist Church (G), Jennings United Methodist Church (H), Burnham Christian Church (I). Display/hide their locations on the map
Cemeteries: West Lake Cemetery (1), New Hope Cemetery (2), Bell Cemetery (3), Herndon Cemetery (4), McCall Cemetery (5), Sasser Landing Cemetery (6), Bluff Cemetery (7). Display/hide their locations on the map
In group quarters: 36 (-1 institutionalized population)
Size of family households: 521 2-persons, 189 3-persons, 183 4-persons, 77 5-persons, 44 6-persons, 67 7-or-more-persons
Size of nonfamily households: 222 1-person, 129 2-persons, 7 4-persons
418 married couples with children.
376 single-parent households (7 men, 369 women).
79.7% of residents of 32053 zip code speak English at home.
16.5% of residents speak Spanish at home (54% very well, 22% well, 11% not well, 13% not at all).
3.1% of residents speak other Indo-European language at home (46% very well, 54% not well).
0.4% of residents speak Asian or Pacific Island language at home (100% well).
Foreign born population: 332 (8.7%) (21.9% of them are naturalized citizens)
This zip code:
8.7%
Whole state:
21.7%
48%Honduras
18%Grenada
12%El Salvador
5%Malaysia
5%Uruguay
4%Colombia
4%Haiti
12%African
11%English
6%Ukrainian
6%American
2%German
2%Haitian
2%Irish
Year of entry for the foreign-born population
1402010 or later
1592000 to 2009
651990 to 1999
24Before 1990
Facilities with environmental interests located in this zip code:
NORTH HAMILTON ELEMENTARY SCHOOL (1291 FLORIDA STREET in JENNINGS, FL)
(Geographic Names Information System) (National Center for Education Statistics) - STATE ID-0041 Organizations: HAMILTON COUNTY SCHOOL DISTRICT (SCHOOL DISTRICT)
OIL SPILL (NORFOLK SOUTHERN RAILWAY CO.) (ALAPAHA RIVER in JENNINGS, FL)
(Integrated Compliance Information System) - ICIS-04-2003-5126, FORMAL ENFORCEMENT ACTION
I-75 @ WELCOME CENTER NB LANDS (I-75 @ WELCOME CENTER in JENNINGS, FL)
National Pollutant Discharge Elimination System NON-MAJOR (Tracking pollutant discharge elimination systems) - permit Organizations: FRANKIE VALDEZ (CONTACT/OWNER)
A&D AUTO SERVICE (#3 MARY ST in JENNINGS, FL)
(Resource Conservation and Recovery Act (tracking hazardous waste)) Organizations: JOE M DRURY JR (CONTACT/OWNER)
NORTH FLORIDA FARM & HOME CENTER (RT. 1 BOX 63A in JENNINGS, FL)
COMPLIANCE ACTIVITY (Tracking inspections of insecticide, fungicide, and rodenticide, and toxic substances)
SILVEREAGLE TRANSPORT INC (ROUTE 1 BOX 71-A in JENNINGS, FL)
Small Quantity Generators, between 100 kg and 1000 kg of hazardous waste/month (Resource Conservation and Recovery Act (tracking hazardous waste)) - notification Organizations: CARLTON PADGETT-JOE DEMARCO (CONTACT/OWNER)
JENNINGS TRASH SITE (2 MILES EAST OF JENNINGS OFF in JENNINGS, FL)
SUPERFUND (Superfund database)
Housing units lacking complete plumbing facilities: 12.5% Housing units lacking complete kitchen facilities: 13.0%
84.7%Electricity
10.4%Bottled, tank, or LP gas
3.5%No fuel used
1.5%Wood
Population in 1990: 2,977. Population change in the 1990s: +338 (+11.4%).
Place of birth for U.S.-born residents:
This state: 2,016
Northeast: 164
Midwest: 203
South: 945
West: 59
64% of the 32053 zip code residents lived in the same house 5 years ago. Out of people who lived in different houses, 37% lived in this county. Out of people who lived in different counties, 50% lived in Florida.
93% of the 32053 zip code residents lived in the same house 1 year ago. Out of people who lived in different houses, 28% moved from this county. Out of people who lived in different houses, 61% moved from different county within same state. Out of people who lived in different houses, 12% moved from different state. Out of people who lived in different houses, 4% moved from abroad.
Private vs. public school enrollment:
Students in private schools in grades 1 to 8 (elementary and middle school): 54
Here:
9.3%
Florida:
15.8%
Students in private schools in grades 9 to 12 (high school): 11
Here:
4.3%
Florida:
12.9%
Students in private undergraduate colleges: 7
Here:
52.8%
Florida:
23.6%
Occupation by median earnings in the past 12 months ($)
93,530Health diagnosing and treating practitioners and other technical occupations
81,669Management occupations
37,152Construction and extraction occupations
35,226Office and administrative support occupations
28,328Healthcare support occupations
27,927Material moving occupations
Top industries in this zip code by the number of employees in 2005:
Construction: New Single-Family Housing Construction (except Operative Builders) (10-19 employees: 1 establishment, 1-4 employees: 1 establishment)
Accommodation and Food Services: Full-Service Restaurants (10-19: 1)
Accommodation and Food Services: Hotels (except Casino Hotels) and Motels (5-9: 2)
Other Services (except Public Administration): Appliance Repair and Maintenance (5-9: 1)
Construction: Plumbing, Heating, and Air-Conditioning Contractors (5-9: 1)
Real Estate and Rental and Leasing: Lessors of Nonresidential Buildings (except Miniwarehouses) (5-9: 1)
Other Services (except Public Administration): Religious Organizations (1-4: 3)
Professional, Scientific, and Technical Services: Other Accounting Services (1-4: 1)
People in group quarters in 2010:
17 people in group homes intended for adults
2 people in workers' group living quarters and job corps centers
People in group quarters in 2000:
17 people in other noninstitutional group quarters
Fatal accident statistics in 2014:
Fatal accident count: 1
Vehicles involved in fatal accidents: 1
Fatal accidents caused by drunken drivers: 1
Fatalities: 1
Persons involved in fatal accidents: 1
Pedestrians involved in fatal accidents: 0
Fatal accident statistics in 2013:
Fatal accident count: 2
Vehicles involved in fatal accidents: 3
Fatal accidents caused by drunken drivers: 1
Fatalities: 2
Persons involved in fatal accidents: 4
Pedestrians involved in fatal accidents: 1
2002 - 2018 National Fire Incident Reporting System (NFIRS) incidents
According to the data from the years 2002 - 2018 the average number of fires per year is 52. The highest number of reported fire incidents - 105 took place in 2011, and the least - 9 in 2002. The data has a rising trend.
When looking into fire subcategories, the most reports belonged to: Outside Fires (55.5%), and Structure Fires (22.7%).
Fire incident types reported to NFIRS in Zip Code 32053

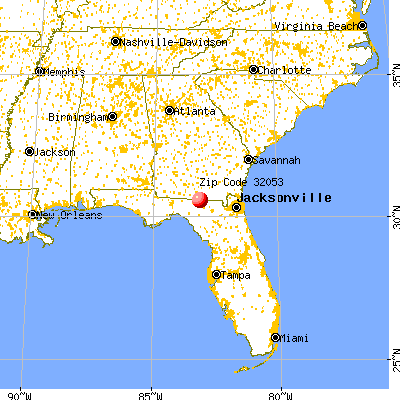


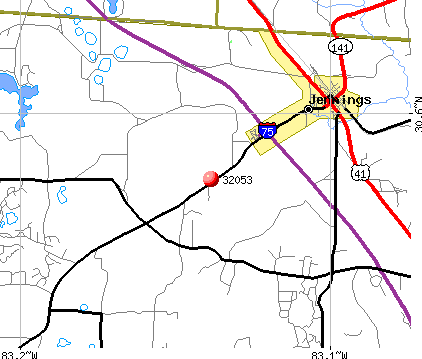 Nearest zip codes: 31636, 31648, 32350, 32052, 32059, 31606.


 According to the data from the years 2002 - 2018 the average number of fires per year is 52. The highest number of reported fire incidents - 105 took place in 2011, and the least - 9 in 2002. The data has a rising trend.
 When looking into fire subcategories, the most reports belonged to: Outside Fires (55.5%), and Structure Fires (22.7%).