Estimated zip code population in 2022: 3,683 Zip code population in 2010: 3,325 Zip code population in 2000: 2,730
Houses and condos: 1,508 Renter-occupied apartments: 198
% of renters here:
13%
State:
33%
March 2022 cost of living index in zip code 32009: 81.5 (low, U.S. average is 100)
Land area: 86.0 sq. mi. Water area: 0.0 sq. mi.
Population density: 43 people per square mile
(very low).
OSM Map
General Map
Google Map
MSN Map
OSM Map
General Map
Google Map
MSN Map
OSM Map
General Map
Google Map
MSN Map
OSM Map
General Map
Google Map
MSN Map
Please wait while loading the map...
Real estate property taxes paid for housing units in 2022:
This zip code:
0.5% ($1,294)
Florida:
0.7% ($2,529)
Median real estate property taxes paid for housing units with mortgages in 2022: $1,809 (0.6%) Median real estate property taxes paid for housing units with no mortgage in 2022: $789 (0.6%)
Business Search- 14 Million verified businesses
Males: 1,807
(49.1%)
Females: 1,875
(50.9%)
For population 25 years and over in 32009:
High school or higher: 87.0%
Bachelor's degree or higher: 15.1%
Graduate or professional degree: 4.7%
Unemployed: 2.2%
Mean travel time to work (commute): 34.5 minutes
For population 15 years and over in 32009:
Never married: 21.0%
Now married: 60.0%
Separated: 0.7%
Widowed: 8.7%
Divorced: 9.6%
Zip code 32009 compared to state average:
Unemployed percentage below state average.
Black race population percentage significantly below state average.
Hispanic race population percentage significantly below state average.
Foreign-born population percentage significantly below state average.
Renting percentage significantly below state average.
Length of stay since moving in significantly above state average.
Number of rooms per house above state average.
House age below state average.
Percentage of population with a bachelor's degree or higher significantly below state average.
Averages for the 2020 tax year for zip code 32009, filed in 2021:
Average Adjusted Gross Income (AGI) in 2020: $68,707 (Individual Income Tax Returns)
Here:
$68,707
State:
$82,200
Salary/wage: $61,302 (reported on 84.1% of returns)
Here:
$61,302
State:
$58,347
(% of AGI for various income ranges: 1303.1% for AGIs below $25k, 3562.0% for AGIs $25k-50k, 6431.0% for AGIs $50k-75k, 9803.1% for AGIs $75k-100k, 14646.1% for AGIs $100k-200k)
Taxable interest for individuals: $1,071 (reported on 30.6% of returns)
This zip code:
$1,071
Florida:
$4,272
(% of AGI for various income ranges: 15.9% for AGIs below $25k, 6.7% for AGIs $25k-50k, 38.5% for AGIs $50k-75k, 20.8% for AGIs $75k-100k, 123.9% for AGIs $100k-200k)
Ordinary dividends: $1,986 (reported on 13.4% of returns)
Here:
$1,986
State:
$15,863
(% of AGI for various income ranges: 8.3% for AGIs below $25k, 8.3% for AGIs $25k-50k, 34.5% for AGIs $50k-75k, 36.9% for AGIs $75k-100k, 109.1% for AGIs $100k-200k)
Net capital gain/loss in AGI: +$12,469 (reported on 10.2% of returns)
Here:
+$12,469
State:
+$62,983
(% of AGI for various income ranges: 17.6% for AGIs below $25k, 6.0% for AGIs $25k-50k, 36.5% for AGIs $50k-75k, 184.6% for AGIs $75k-100k, 308.7% for AGIs $100k-200k)
Profit/loss from business: +$7,116 (reported on 12.1% of returns)
Here:
+$7,116
State:
+$9,719
(% of AGI for various income ranges: 38.3% for AGIs below $25k, 77.7% for AGIs $25k-50k, 246.0% for AGIs $50k-75k, 224.3% for AGIs $100k-200k)
Taxable individual retirement arrangement distribution: $17,971 (reported on 8.9% of returns)
32009:
$17,971
Florida:
$24,823
(% of AGI for various income ranges: 51.4% for AGIs below $25k, 139.7% for AGIs $25k-50k, 450.8% for AGIs $75k-100k, 592.2% for AGIs $100k-200k)
Total itemized deductions: $29,857 (reported on 4.5% of returns)
Here:
$29,857
State:
$45,393
(% of AGI for various income ranges: 246.7% for AGIs $25k-50k, 587.0% for AGIs $100k-200k)
Charity contributions: $13,567 (reported on 3.8% of returns)
Here:
$13,567
State:
$20,178
(% of AGI for various income ranges: 42.3% for AGIs $25k-50k, 298.7% for AGIs $100k-200k)
Taxes paid: $5,167 (reported on 3.8% of returns)
32009:
$5,167
State:
$6,967
(% of AGI for various income ranges: 23.0% for AGIs $25k-50k, 104.8% for AGIs $100k-200k)
Earned income credit: $1,894 (reported on 10.8% of returns)
Here:
$1,894
State:
$2,306
(% of AGI for various income ranges: 56.6% for AGIs below $25k, 52.7% for AGIs $25k-50k)
Percentage of individuals using paid preparers for their 2020 taxes: 94.3%
Here:
94%
State:
92%
(% for various income ranges: 94.7% for AGIs below $25k, 97.1% for AGIs $25k-50k, 92.6% for AGIs $50k-75k, 95.0% for AGIs $75k-100k, 90.9% for AGIs $100k-200k, 100.0% for AGIs over 200k)
Averages for the 2012 tax year for zip code 32009, filed in 2013:
Average Adjusted Gross Income (AGI) in 2012: $53,251 (Individual Income Tax Returns)
Here:
$53,251
State:
$60,316
Salary/wage: $48,423 (reported on 85.8% of returns)
Here:
$48,423
State:
$45,277
(% of AGI for various income ranges: 75.1% for AGIs below $25k, 77.1% for AGIs $25k-50k, 79.4% for AGIs $50k-75k, 83.1% for AGIs $75k-100k, 82.4% for AGIs $100k-200k, 47.9% for AGIs over 200k)
Taxable interest for individuals: $629 (reported on 31.9% of returns)
This zip code:
$629
Florida:
$3,587
(% of AGI for various income ranges: 0.4% for AGIs below $25k, 0.2% for AGIs $25k-50k, 0.8% for AGIs $50k-75k, 0.2% for AGIs $75k-100k, 0.3% for AGIs $100k-200k)
Ordinary dividends: $1,284 (reported on 13.5% of returns)
Here:
$1,284
State:
$12,831
(% of AGI for various income ranges: 1.0% for AGIs below $25k, 0.4% for AGIs $25k-50k, 0.2% for AGIs $50k-75k, 0.3% for AGIs $75k-100k, 0.3% for AGIs $100k-200k)
Net capital gain/loss in AGI: +$2,425 (reported on 8.5% of returns)
Here:
+$2,425
State:
+$33,493
(% of AGI for various income ranges: 0.5% for AGIs below $25k, 0.6% for AGIs $25k-50k, 0.9% for AGIs $100k-200k)
Profit/loss from business: +$6,467 (reported on 12.8% of returns)
Here:
+$6,467
State:
+$10,012
(% of AGI for various income ranges: 6.9% for AGIs below $25k, 0.9% for AGIs $25k-50k, 1.7% for AGIs $50k-75k, 2.5% for AGIs $75k-100k)
Taxable individual retirement arrangement distribution: $12,782 (reported on 7.8% of returns)
32009:
$12,782
Florida:
$21,544
(% of AGI for various income ranges: 3.1% for AGIs $25k-50k, 3.5% for AGIs $50k-75k, 2.3% for AGIs $100k-200k)
Total itemized deductions: $19,471 (24% of AGI, reported on 27.0% of returns)
Here:
$19,471
State:
$25,533
Here:
23.7% of AGI
State:
18.0% of AGI
(% of AGI for various income ranges: 10.5% for AGIs below $25k, 9.5% for AGIs $25k-50k, 9.7% for AGIs $50k-75k, 9.8% for AGIs $75k-100k, 12.7% for AGIs $100k-200k)
Charity contributions: $5,023 (reported on 21.3% of returns)
Here:
$5,023
State:
$5,698
(% of AGI for various income ranges: 1.2% for AGIs below $25k, 1.1% for AGIs $25k-50k, 1.5% for AGIs $50k-75k, 2.1% for AGIs $75k-100k, 3.7% for AGIs $100k-200k)
Taxes paid: $2,966 (reported on 27.0% of returns)
32009:
$2,966
State:
$6,203
(% of AGI for various income ranges: 1.1% for AGIs below $25k, 1.5% for AGIs $25k-50k, 1.3% for AGIs $50k-75k, 1.4% for AGIs $75k-100k, 2.3% for AGIs $100k-200k)
Earned income credit: $2,177 (reported on 15.6% of returns)
Here:
$2,177
State:
$2,372
(% of AGI for various income ranges: 6.1% for AGIs below $25k, 1.0% for AGIs $25k-50k)
Percentage of individuals using paid preparers for their 2012 taxes: 46.8%
Here:
47%
State:
54%
(% for various income ranges: 41.3% for AGIs below $25k, 47.1% for AGIs $25k-50k, 44.0% for AGIs $50k-75k, 55.6% for AGIs $75k-100k, 62.5% for AGIs $100k-200k)
Averages for the 2004 tax year for zip code 32009, filed in 2005:
Average Adjusted Gross Income (AGI) in 2004: $45,898 (Individual Income Tax Returns)
Here:
$45,898
State:
$50,523
Salary/wage: $43,124 (reported on 90.6% of returns)
Here:
$43,124
State:
$39,563
(% of AGI for various income ranges: 89.6% for AGIs below $10k, 80.5% for AGIs $10k-25k, 86.5% for AGIs $25k-50k, 88.4% for AGIs $50k-75k, 86.8% for AGIs $75k-100k, 78.8% for AGIs over 100k)
Taxable interest for individuals: $598 (reported on 39.8% of returns)
This zip code:
$598
Florida:
$3,211
(% of AGI for various income ranges: 1.5% for AGIs below $10k, 0.8% for AGIs $10k-25k, 0.7% for AGIs $25k-50k, 0.2% for AGIs $50k-75k, 0.2% for AGIs $75k-100k, 0.8% for AGIs over 100k)
Taxable dividends: $558 (reported on 14.5% of returns)
Here:
$558
State:
$6,129
(% of AGI for various income ranges: 1.6% for AGIs below $10k, 0.5% for AGIs $10k-25k, 0.2% for AGIs $25k-50k, 0.1% for AGIs $50k-75k, 0.1% for AGIs $75k-100k, 0.2% for AGIs over 100k)
Net capital gain/loss: +$1,303 (reported on 10.1% of returns)
Here:
+$1,303
State:
+$27,205
(% of AGI for various income ranges: -0.3% for AGIs $10k-25k, 0.1% for AGIs $25k-50k, 0.3% for AGIs $50k-75k, 0.5% for AGIs $75k-100k, 0.4% for AGIs over 100k)
Profit/loss from business: +$4,408 (reported on 11.6% of returns)
Here:
+$4,408
State:
+$10,634
(% of AGI for various income ranges: -1.5% for AGIs below $10k, 3.3% for AGIs $10k-25k, 1.3% for AGIs $25k-50k, 2.0% for AGIs $50k-75k, -0.2% for AGIs $75k-100k, 0.5% for AGIs over 100k)
IRA payment deduction: $1,810 (reported on 1.6% of returns)
32009:
$1,810
Florida:
$3,082
Total itemized deductions: $15,631 (21% of AGI, reported on 29.7% of returns)
Here:
$15,631
State:
$20,370
Here:
21.4% of AGI
State:
20.7% of AGI
(% of AGI for various income ranges: 5.0% for AGIs $10k-25k, 8.6% for AGIs $25k-50k, 10.6% for AGIs $50k-75k, 10.9% for AGIs $75k-100k, 12.7% for AGIs over 100k)
Charity contributions deductions: $3,778 (5% of AGI, reported on 25.4% of returns)
Here:
$3,778
State:
$4,064
Here:
5.0% of AGI
State:
3.8% of AGI
(% of AGI for various income ranges: 0.7% for AGIs $10k-25k, 1.6% for AGIs $25k-50k, 2.2% for AGIs $50k-75k, 2.1% for AGIs $75k-100k, 3.0% for AGIs over 100k)
Total tax: $5,248 (reported on 79.7% of returns)
32009:
$5,248
State:
$9,431
(% of AGI for various income ranges: 1.9% for AGIs below $10k, 4.3% for AGIs $10k-25k, 5.9% for AGIs $25k-50k, 8.1% for AGIs $50k-75k, 10.0% for AGIs $75k-100k, 14.9% for AGIs over 100k)
Earned income credit: $1,530 (reported on 13.9% of returns)
Here:
$1,530
State:
$1,808
Percentage of individuals using paid preparers for their 2004 taxes: 56.4%
Here:
56%
State:
60%
(% for various income ranges: 47.9% for AGIs below $10k, 60.2% for AGIs $10k-25k, 61.2% for AGIs $25k-50k, 53.8% for AGIs $50k-75k, 52.4% for AGIs $75k-100k, 61.1% for AGIs over 100k)
Household received Food Stamps/SNAP in the past 12 months: 115 Household did not receive Food Stamps/SNAP in the past 12 months: 1,381
Women who had a birth in the past 12 months: 63 (67 now married, 0 unmarried) Women who did not have a birth in the past 12 months: 709 (439 now married, 270 unmarried)
Housing units in zip code 32009 with a mortgage: 694 (23 second mortgage, 11 home equity loan, 12 both second mortgage and home equity loan) Median monthly owner costs for units with a mortgage: $1,402 Median monthly owner costs for units without a mortgage: $335
Residents with income below the poverty level in 2022:
This zip code:
9.3%
Whole state:
12.7%
Residents with income below 50% of the poverty level in 2022:
This zip code:
1.1%
Whole state:
6.6%
Median number of rooms in houses and condos:
Here:
6.9
State:
5.9
Median number of rooms in apartments:
Here:
5.1
State:
4.2
Notable locations in this zip code not listed on our city pages
Notable locations in zip code 32009: Sunowa Springs Camp (A), Nassau County Fire and Rescue Station 6 (B), Nassau County Fire and Rescue Station 60 (C). Display/hide their locations on the map
Size of family households: 401 2-persons, 368 3-persons, 188 4-persons, 127 5-persons, 53 6-persons
Size of nonfamily households: 308 1-person, 36 2-persons
608 married couples with children.
16 single-parent households (16 men).
98.4% of residents of 32009 zip code speak English at home.
0.5% of residents speak Spanish at home (100% very well).
0.2% of residents speak other Indo-European language at home (100% very well).
Foreign born population: 25 (0.7%) (100.0% of them are naturalized citizens)
This zip code:
0.7%
Whole state:
21.7%
64%Malaysia
40%El Salvador
56%American
4%English
4%Irish
3%European
3%Scotch-Irish
2%German
1%Northern European
Year of entry for the foreign-born population
02010 or later
172000 to 2009
141990 to 1999
28Before 1990
Facilities with environmental interests located in this zip code:
SETTLER'S RIDGE (FORD ROAD 1 MILE EAST OF INTER in BRYCEVILLE, FL)
National Pollutant Discharge Elimination System NON-MAJOR (Tracking pollutant discharge elimination systems) - permit Organizations: J BAKER (CONTACT/OWNER)
NASSAU COLLISION CENTER (US HWY 301 in BRYCEVILLE, FL)
Small Quantity Generators, between 100 kg and 1000 kg of hazardous waste/month (Resource Conservation and Recovery Act (tracking hazardous waste)) - notification Organizations: KENNY WHIDDON, OWNER (CONTACT/OWNER)
94.9%Electricity
2.8%No fuel used
0.9%Fuel oil, kerosene, etc.
0.6%Utility gas
0.6%Bottled, tank, or LP gas
Population in 1990: 1,875. Population change in the 1990s: +855 (+45.6%).
Place of birth for U.S.-born residents:
This state: 2,689
Northeast: 105
Midwest: 207
South: 389
West: 183
56% of the 32009 zip code residents lived in the same house 5 years ago. Out of people who lived in different houses, 17% lived in this county. Out of people who lived in different counties, 50% lived in Florida.
98% of the 32009 zip code residents lived in the same house 1 year ago. Out of people who lived in different houses, 14% moved from this county. Out of people who lived in different houses, 116% moved from different county within same state.
Private vs. public school enrollment:
Students in private schools in grades 1 to 8 (elementary and middle school): 41
Here:
20.1%
Florida:
15.8%
Students in private schools in grades 9 to 12 (high school): 113
Here:
46.7%
Florida:
12.9%
Students in private undergraduate colleges: 9
Here:
8.8%
Florida:
23.6%
Occupation by median earnings in the past 12 months ($)
100,477Computer and mathematical occupations
83,833Health diagnosing and treating practitioners and other technical occupations
75,888Installation, maintenance, and repair occupations
74,136Transportation occupations
70,945Management occupations
60,977Construction and extraction occupations
Top industries in this zip code by the number of employees in 2005:
Construction: All Other Specialty Trade Contractors (5-9 employees: 2 establishments, 1-4 employees: 1 establishment)
Administrative and Support and Waste Management and Remediation Services: Landscaping Services (1-4: 5)
Construction: Power and Communication Line and Related Structures Construction (5-9: 1)
Construction: Land Subdivision (5-9: 1)
Construction: Masonry Contractors (5-9: 1)
Other Services (except Public Administration): Religious Organizations (1-4: 3)
Construction: New Single-Family Housing Construction (except Operative Builders) (1-4: 3)
Other Services (except Public Administration): Commercial and Industrial Machinery and Equipment (except Automotive and Electronic) Repair and Maintenance (1-4: 2)
Construction: Electrical Contractors (1-4: 2)
Fatal accident statistics in 2014:
Fatal accident count: 1
Vehicles involved in fatal accidents: 1
Fatal accidents caused by drunken drivers: 0
Fatalities: 1
Persons involved in fatal accidents: 1
Pedestrians involved in fatal accidents: 0
Fatal accident statistics in 2013:
Fatal accident count: 2
Vehicles involved in fatal accidents: 9
Fatal accidents caused by drunken drivers: 0
Fatalities: 2
Persons involved in fatal accidents: 12
Pedestrians involved in fatal accidents: 0
Home Mortgage Disclosure Act Aggregated Statistics For Year 2009 (Based on 4 partial tracts)
A) FHA, FSA/RHS & VA Home Purchase Loans
B) Conventional Home Purchase Loans
C) Refinancings
D) Home Improvement Loans
F) Non-occupant Loans on < 5 Family Dwellings (A B C & D)
G) Loans On Manufactured Home Dwelling (A B C & D)
Number
Average Value
Number
Average Value
Number
Average Value
Number
Average Value
Number
Average Value
Number
Average Value
LOANS ORIGINATED
48
$152,993
22
$148,936
100
$159,384
7
$98,146
6
$116,247
29
$98,186
APPLICATIONS APPROVED, NOT ACCEPTED
2
$178,990
3
$89,880
13
$125,592
0
$0
1
$142,380
7
$79,500
APPLICATIONS DENIED
13
$169,301
21
$132,656
86
$146,528
10
$72,519
1
$57,150
36
$86,347
APPLICATIONS WITHDRAWN
3
$165,150
5
$236,350
38
$177,496
4
$93,875
0
$0
5
$153,606
FILES CLOSED FOR INCOMPLETENESS
4
$151,165
4
$168,625
11
$182,765
1
$59,390
1
$50,440
4
$111,220
Aggregated Statistics For Year 2008 (Based on 4 partial tracts)
A) FHA, FSA/RHS & VA Home Purchase Loans
B) Conventional Home Purchase Loans
C) Refinancings
D) Home Improvement Loans
F) Non-occupant Loans on < 5 Family Dwellings (A B C & D)
G) Loans On Manufactured Home Dwelling (A B C & D)
Number
Average Value
Number
Average Value
Number
Average Value
Number
Average Value
Number
Average Value
Number
Average Value
LOANS ORIGINATED
53
$161,840
35
$155,066
121
$148,090
13
$111,441
5
$173,864
55
$105,820
APPLICATIONS APPROVED, NOT ACCEPTED
1
$348,120
11
$120,394
25
$133,308
4
$173,052
2
$65,090
10
$82,869
APPLICATIONS DENIED
18
$151,586
24
$105,784
128
$157,781
30
$71,063
8
$113,336
64
$90,217
APPLICATIONS WITHDRAWN
7
$135,893
10
$210,281
38
$161,867
3
$129,567
2
$54,920
10
$77,695
FILES CLOSED FOR INCOMPLETENESS
3
$140,233
3
$150,250
12
$165,227
1
$112,800
0
$0
3
$104,980
Aggregated Statistics For Year 2007 (Based on 4 partial tracts)
A) FHA, FSA/RHS & VA Home Purchase Loans
B) Conventional Home Purchase Loans
C) Refinancings
D) Home Improvement Loans
F) Non-occupant Loans on < 5 Family Dwellings (A B C & D)
G) Loans On Manufactured Home Dwelling (A B C & D)
Number
Average Value
Number
Average Value
Number
Average Value
Number
Average Value
Number
Average Value
Number
Average Value
LOANS ORIGINATED
47
$156,164
108
$169,214
179
$156,371
31
$64,964
19
$125,394
83
$92,981
APPLICATIONS APPROVED, NOT ACCEPTED
1
$165,720
23
$140,276
39
$123,050
12
$52,357
3
$120,780
25
$74,671
APPLICATIONS DENIED
9
$159,783
63
$161,522
163
$156,991
44
$66,547
15
$193,461
81
$97,170
APPLICATIONS WITHDRAWN
4
$181,750
15
$178,716
75
$159,202
8
$65,338
2
$97,380
16
$87,259
FILES CLOSED FOR INCOMPLETENESS
0
$0
4
$196,245
20
$186,324
2
$76,585
1
$190,470
2
$87,815
Aggregated Statistics For Year 2006 (Based on 4 partial tracts)
A) FHA, FSA/RHS & VA Home Purchase Loans
B) Conventional Home Purchase Loans
C) Refinancings
D) Home Improvement Loans
F) Non-occupant Loans on < 5 Family Dwellings (A B C & D)
G) Loans On Manufactured Home Dwelling (A B C & D)
Number
Average Value
Number
Average Value
Number
Average Value
Number
Average Value
Number
Average Value
Number
Average Value
LOANS ORIGINATED
43
$147,605
162
$160,622
182
$131,423
46
$66,956
23
$122,353
91
$92,131
APPLICATIONS APPROVED, NOT ACCEPTED
7
$127,461
36
$112,866
45
$129,548
9
$82,942
3
$122,900
37
$81,845
APPLICATIONS DENIED
11
$127,735
73
$127,658
174
$135,476
48
$85,524
12
$121,184
88
$88,304
APPLICATIONS WITHDRAWN
5
$137,144
20
$147,490
98
$135,365
12
$115,857
2
$94,475
20
$87,690
FILES CLOSED FOR INCOMPLETENESS
0
$0
11
$146,813
29
$146,609
3
$121,670
2
$153,790
4
$111,058
Aggregated Statistics For Year 2005 (Based on 4 partial tracts)
A) FHA, FSA/RHS & VA Home Purchase Loans
B) Conventional Home Purchase Loans
C) Refinancings
D) Home Improvement Loans
F) Non-occupant Loans on < 5 Family Dwellings (A B C & D)
G) Loans On Manufactured Home Dwelling (A B C & D)
Number
Average Value
Number
Average Value
Number
Average Value
Number
Average Value
Number
Average Value
Number
Average Value
LOANS ORIGINATED
57
$153,069
170
$138,230
174
$113,029
35
$48,437
19
$118,394
81
$79,012
APPLICATIONS APPROVED, NOT ACCEPTED
4
$121,990
32
$90,554
55
$99,759
7
$48,914
4
$83,192
36
$71,525
APPLICATIONS DENIED
9
$89,250
68
$88,602
184
$108,703
42
$44,775
12
$62,593
100
$76,709
APPLICATIONS WITHDRAWN
2
$128,140
25
$118,153
91
$124,999
11
$90,618
5
$107,370
24
$84,952
FILES CLOSED FOR INCOMPLETENESS
1
$203,400
9
$102,733
48
$129,991
0
$0
1
$94,420
12
$86,170
Aggregated Statistics For Year 2004 (Based on 4 partial tracts)
A) FHA, FSA/RHS & VA Home Purchase Loans
B) Conventional Home Purchase Loans
C) Refinancings
D) Home Improvement Loans
F) Non-occupant Loans on < 5 Family Dwellings (A B C & D)
G) Loans On Manufactured Home Dwelling (A B C & D)
Number
Average Value
Number
Average Value
Number
Average Value
Number
Average Value
Number
Average Value
Number
Average Value
LOANS ORIGINATED
40
$126,553
126
$131,750
178
$101,518
30
$49,411
17
$80,400
68
$78,655
APPLICATIONS APPROVED, NOT ACCEPTED
3
$100,750
38
$90,108
57
$98,789
10
$51,401
4
$69,140
35
$68,619
APPLICATIONS DENIED
9
$119,536
70
$91,778
152
$91,928
29
$48,890
14
$81,389
85
$67,411
APPLICATIONS WITHDRAWN
4
$133,228
18
$114,083
99
$107,506
5
$42,598
4
$86,478
24
$78,765
FILES CLOSED FOR INCOMPLETENESS
2
$111,325
5
$124,514
23
$119,407
1
$13,460
0
$0
4
$89,360
Aggregated Statistics For Year 2003 (Based on 4 partial tracts)
A) FHA, FSA/RHS & VA Home Purchase Loans
B) Conventional Home Purchase Loans
C) Refinancings
D) Home Improvement Loans
F) Non-occupant Loans on < 5 Family Dwellings (A B C & D)
Number
Average Value
Number
Average Value
Number
Average Value
Number
Average Value
Number
Average Value
LOANS ORIGINATED
31
$121,669
122
$115,380
292
$100,880
17
$51,436
17
$69,876
APPLICATIONS APPROVED, NOT ACCEPTED
4
$106,360
17
$89,899
57
$96,230
2
$27,225
3
$73,223
APPLICATIONS DENIED
13
$114,126
54
$86,039
154
$86,699
12
$27,738
6
$74,920
APPLICATIONS WITHDRAWN
7
$89,973
18
$126,744
117
$101,450
6
$23,613
2
$126,210
FILES CLOSED FOR INCOMPLETENESS
2
$90,710
9
$106,590
18
$105,387
2
$56,140
1
$52,880
Aggregated Statistics For Year 2002 (Based on 2 partial tracts)
A) FHA, FSA/RHS & VA Home Purchase Loans
B) Conventional Home Purchase Loans
C) Refinancings
D) Home Improvement Loans
F) Non-occupant Loans on < 5 Family Dwellings (A B C & D)
Number
Average Value
Number
Average Value
Number
Average Value
Number
Average Value
Number
Average Value
LOANS ORIGINATED
3
$88,063
21
$79,687
38
$97,161
1
$58,040
2
$66,570
APPLICATIONS APPROVED, NOT ACCEPTED
1
$34,110
11
$45,968
9
$75,798
1
$27,230
1
$7,480
APPLICATIONS DENIED
0
$0
17
$47,995
23
$84,310
2
$42,785
1
$39,490
APPLICATIONS WITHDRAWN
0
$0
3
$102,827
13
$96,435
1
$16,460
1
$36,200
FILES CLOSED FOR INCOMPLETENESS
0
$0
1
$130,750
3
$80,683
0
$0
0
$0
Aggregated Statistics For Year 2001 (Based on 2 partial tracts)
A) FHA, FSA/RHS & VA Home Purchase Loans
B) Conventional Home Purchase Loans
C) Refinancings
D) Home Improvement Loans
F) Non-occupant Loans on < 5 Family Dwellings (A B C & D)
Number
Average Value
Number
Average Value
Number
Average Value
Number
Average Value
Number
Average Value
LOANS ORIGINATED
2
$96,195
17
$93,738
27
$90,835
3
$18,750
1
$75,400
APPLICATIONS APPROVED, NOT ACCEPTED
0
$0
8
$70,686
7
$83,947
1
$12,870
0
$0
APPLICATIONS DENIED
1
$90,360
14
$74,137
27
$72,794
6
$16,507
1
$55,350
APPLICATIONS WITHDRAWN
0
$0
3
$91,557
10
$80,455
1
$15,260
0
$0
FILES CLOSED FOR INCOMPLETENESS
0
$0
1
$54,450
2
$86,620
0
$0
0
$0
Aggregated Statistics For Year 2000 (Based on 2 partial tracts)
A) FHA, FSA/RHS & VA Home Purchase Loans
B) Conventional Home Purchase Loans
C) Refinancings
D) Home Improvement Loans
F) Non-occupant Loans on < 5 Family Dwellings (A B C & D)
Number
Average Value
Number
Average Value
Number
Average Value
Number
Average Value
Number
Average Value
LOANS ORIGINATED
2
$96,340
21
$82,394
11
$64,981
5
$48,530
2
$40,840
APPLICATIONS APPROVED, NOT ACCEPTED
1
$45,480
9
$75,564
4
$53,558
1
$37,100
1
$75,100
APPLICATIONS DENIED
1
$47,270
31
$52,746
19
$56,013
3
$14,760
3
$21,043
APPLICATIONS WITHDRAWN
1
$43,080
4
$84,450
8
$67,694
1
$25,730
0
$0
FILES CLOSED FOR INCOMPLETENESS
0
$0
1
$62,230
3
$53,457
0
$0
0
$0
Aggregated Statistics For Year 1999 (Based on 2 partial tracts)
A) FHA, FSA/RHS & VA Home Purchase Loans
B) Conventional Home Purchase Loans
C) Refinancings
D) Home Improvement Loans
E) Loans on Dwellings For 5+ Families
F) Non-occupant Loans on < 5 Family Dwellings (A B C & D)
Detailed PMIC statistics for the following Tracts:0106.00
, 0505.01
2002 - 2018 National Fire Incident Reporting System (NFIRS) incidents
Based on the data from the years 2002 - 2018 the average number of fires per year is 24. The highest number of fires - 51 took place in 2004, and the least - 5 in 2018. The data has a dropping trend.
When looking into fire subcategories, the most reports belonged to: Outside Fires (61.9%), and Structure Fires (19.5%).
Fire incident types reported to NFIRS in Zip Code 32009


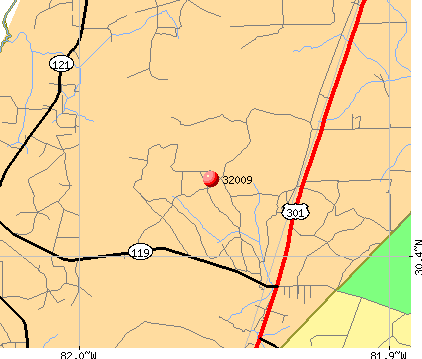 Nearest zip codes: 32220, 32219, 31562, 32234, 32011, 32221.


 Based on the data from the years 2002 - 2018 the average number of fires per year is 24. The highest number of fires - 51 took place in 2004, and the least - 5 in 2018. The data has a dropping trend.
 When looking into fire subcategories, the most reports belonged to: Outside Fires (61.9%), and Structure Fires (19.5%).