According to our research of Georgia and other state lists, there were 2 registered sex offenders living in 31905 zip code as of July 05, 2024. The ratio of all residents to sex offenders in zip code 31905 is 10,647 to 1. The ratio of registered sex offenders to all residents in this zip code is much lower than the state average.
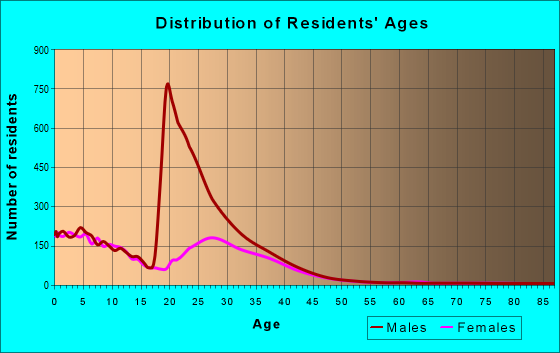
Median resident age:
This zip code:
22.8 years
Georgia median age:
37.6 years
Average household size:
This zip code:
3.5 people
Georgia:
2.6 people
Averages for the 2020 tax year for zip code 31905, filed in 2021:
Average Adjusted Gross Income (AGI) in 2020: $51,323 (Individual Income Tax Returns)
Here:
$51,323
State:
$70,847
Salary/wage: $50,391 (reported on 98.4% of returns)
Here:
$50,391
State:
$59,126
(% of AGI for various income ranges: 1586.0% for AGIs below $25k, 3963.1% for AGIs $25k-50k, 6306.5% for AGIs $50k-75k, 9010.6% for AGIs $75k-100k, 14373.2% for AGIs $100k-200k)
Taxable interest for individuals: $222 (reported on 13.1% of returns)
This zip code:
$222
Georgia:
$2,011
(% of AGI for various income ranges: 0.3% for AGIs below $25k, 1.8% for AGIs $25k-50k, 4.1% for AGIs $50k-75k, 3.3% for AGIs $75k-100k, 17.4% for AGIs $100k-200k)
Ordinary dividends: $781 (reported on 11.5% of returns)
Here:
$781
State:
$8,996
(% of AGI for various income ranges: 1.2% for AGIs below $25k, 2.4% for AGIs $25k-50k, 4.6% for AGIs $50k-75k, 10.0% for AGIs $75k-100k, 114.7% for AGIs $100k-200k)
Net capital gain/loss in AGI: +$4,555 (reported on 13.1% of returns)
Here:
+$4,555
State:
+$28,402
(% of AGI for various income ranges: 5.9% for AGIs below $25k, 5.4% for AGIs $25k-50k, 28.8% for AGIs $50k-75k, 89.7% for AGIs $75k-100k, 821.1% for AGIs $100k-200k)
Profit/loss from business: +$438 (reported on 7.7% of returns)
Here:
+$438
State:
+$6,707
(% of AGI for various income ranges: 14.1% for AGIs $50k-75k, 55.8% for AGIs $75k-100k, 51.6% for AGIs $100k-200k)
Taxable individual retirement arrangement distribution: $3,133 (reported on 0.8% of returns)
31905:
$3,133
Georgia:
$20,525
(% of AGI for various income ranges: 10.3% for AGIs $50k-75k)
Total itemized deductions: $24,267 (reported on 0.8% of returns)
Here:
$24,267
State:
$34,001
(% of AGI for various income ranges: 80.0% for AGIs $50k-75k)
Charity contributions: $9,050 (reported on 0.5% of returns)
Here:
$9,050
State:
$14,164
(% of AGI for various income ranges: 12.3% for AGIs $25k-50k)
Taxes paid: $5,467 (reported on 0.8% of returns)
31905:
$5,467
State:
$7,540
(% of AGI for various income ranges: 18.0% for AGIs $50k-75k)
Earned income credit: $2,171 (reported on 24.8% of returns)
Here:
$2,171
State:
$2,530
(% of AGI for various income ranges: 74.3% for AGIs below $25k, 104.2% for AGIs $25k-50k, 6.2% for AGIs $50k-75k)
Percentage of individuals using paid preparers for their 2020 taxes: 97.6%
Here:
98%
State:
93%
(% for various income ranges: 96.8% for AGIs below $25k, 97.4% for AGIs $25k-50k, 97.9% for AGIs $50k-75k, 100.0% for AGIs $75k-100k, 95.8% for AGIs $100k-200k, 100.0% for AGIs over 200k)
Averages for the 2012 tax year for zip code 31905, filed in 2013:
Average Adjusted Gross Income (AGI) in 2012: $33,918 (Individual Income Tax Returns)
Here:
$33,918
State:
$56,131
Salary/wage: $33,864 (reported on 99.0% of returns)
Here:
$33,864
State:
$47,942
(% of AGI for various income ranges: 101.1% for AGIs below $25k, 99.9% for AGIs $25k-50k, 97.4% for AGIs $50k-75k, 97.1% for AGIs $75k-100k, 94.4% for AGIs $100k-200k)
Taxable interest for individuals: $196 (reported on 12.7% of returns)
This zip code:
$196
Georgia:
$1,706
(% of AGI for various income ranges: 0.1% for AGIs $75k-100k, 0.2% for AGIs $100k-200k)
Ordinary dividends: $941 (reported on 7.7% of returns)
Here:
$941
State:
$7,265
(% of AGI for various income ranges: 0.1% for AGIs $25k-50k, 0.2% for AGIs $50k-75k, 0.4% for AGIs $75k-100k, 0.9% for AGIs $100k-200k)
Net capital gain/loss in AGI: +$871 (reported on 5.8% of returns)
Here:
+$871
State:
+$16,323
(% of AGI for various income ranges: 0.3% for AGIs $50k-75k, 0.4% for AGIs $75k-100k, 0.5% for AGIs $100k-200k)
Taxable individual retirement arrangement distribution: $6,425 (reported on 1.0% of returns)
31905:
$6,425
Georgia:
$17,199
Total itemized deductions: $17,523 (33% of AGI, reported on 7.4% of returns)
Here:
$17,523
State:
$23,886
Here:
33.0% of AGI
State:
21.5% of AGI
(% of AGI for various income ranges: 3.1% for AGIs below $25k, 3.4% for AGIs $25k-50k, 3.9% for AGIs $50k-75k, 4.7% for AGIs $75k-100k, 6.5% for AGIs $100k-200k)
Charity contributions: $4,121 (reported on 4.6% of returns)
Here:
$4,121
State:
$5,507
(% of AGI for various income ranges: 0.4% for AGIs below $25k, 0.3% for AGIs $25k-50k, 0.7% for AGIs $50k-75k, 0.8% for AGIs $75k-100k, 1.8% for AGIs $100k-200k)
Taxes paid: $4,308 (reported on 6.2% of returns)
31905:
$4,308
State:
$7,838
(% of AGI for various income ranges: 0.4% for AGIs below $25k, 0.7% for AGIs $25k-50k, 0.7% for AGIs $50k-75k, 1.1% for AGIs $75k-100k, 2.1% for AGIs $100k-200k)
Earned income credit: $2,724 (reported on 42.2% of returns)
Here:
$2,724
State:
$2,589
(% of AGI for various income ranges: 9.4% for AGIs below $25k, 3.7% for AGIs $25k-50k)
Percentage of individuals using paid preparers for their 2012 taxes: 42.0%
Here:
42%
State:
55%
(% for various income ranges: 42.9% for AGIs below $25k, 43.5% for AGIs $25k-50k, 36.4% for AGIs $50k-75k, 33.3% for AGIs $75k-100k, 40.0% for AGIs $100k-200k)
Averages for the 2004 tax year for zip code 31905, filed in 2005:
Average Adjusted Gross Income (AGI) in 2004: $26,745 (Individual Income Tax Returns)
Here:
$26,745
State:
$47,553
Salary/wage: $27,123 (reported on 99.1% of returns)
Here:
$27,123
State:
$42,178
(% of AGI for various income ranges: 105.6% for AGIs below $10k, 102.1% for AGIs $10k-25k, 101.0% for AGIs $25k-50k, 99.0% for AGIs $50k-75k, 94.2% for AGIs $75k-100k, 93.6% for AGIs over 100k)
Taxable interest for individuals: $263 (reported on 12.6% of returns)
This zip code:
$263
Georgia:
$1,772
(% of AGI for various income ranges: 0.3% for AGIs below $10k, 0.0% for AGIs $10k-25k, 0.1% for AGIs $25k-50k, 0.1% for AGIs $50k-75k, 0.7% for AGIs $75k-100k, 0.3% for AGIs over 100k)
Taxable dividends: $632 (reported on 7.1% of returns)
Here:
$632
State:
$4,283
(% of AGI for various income ranges: 0.2% for AGIs below $10k, 0.0% for AGIs $10k-25k, 0.1% for AGIs $25k-50k, 0.2% for AGIs $50k-75k, 0.6% for AGIs $75k-100k, 1.1% for AGIs over 100k)
Net capital gain/loss: +$989 (reported on 4.5% of returns)
Here:
+$989
State:
+$16,461
(% of AGI for various income ranges: -0.2% for AGIs below $10k, -0.0% for AGIs $10k-25k, 0.0% for AGIs $25k-50k, -0.1% for AGIs $50k-75k, 1.2% for AGIs $75k-100k, 3.3% for AGIs over 100k)
IRA payment deduction: $2,058 (reported on 1.3% of returns)
31905:
$2,058
Georgia:
$2,969
Total itemized deductions: $13,767 (34% of AGI, reported on 6.2% of returns)
Here:
$13,767
State:
$19,944
Here:
33.8% of AGI
State:
22.6% of AGI
(% of AGI for various income ranges: 2.4% for AGIs $10k-25k, 3.6% for AGIs $25k-50k, 4.2% for AGIs $50k-75k, 3.0% for AGIs $75k-100k, 3.8% for AGIs over 100k)
Charity contributions deductions: $3,169 (8% of AGI, reported on 5.3% of returns)
Here:
$3,169
State:
$4,354
Here:
7.5% of AGI
State:
4.7% of AGI
(% of AGI for various income ranges: 0.3% for AGIs $10k-25k, 0.7% for AGIs $25k-50k, 0.8% for AGIs $50k-75k, 1.1% for AGIs $75k-100k, 1.6% for AGIs over 100k)
Total tax: $1,914 (reported on 48.7% of returns)
31905:
$1,914
State:
$8,223
(% of AGI for various income ranges: 0.5% for AGIs below $10k, 2.3% for AGIs $10k-25k, 2.2% for AGIs $25k-50k, 5.4% for AGIs $50k-75k, 8.4% for AGIs $75k-100k, 13.9% for AGIs over 100k)
Earned income credit: $2,020 (reported on 34.9% of returns)
Here:
$2,020
State:
$1,986
Percentage of individuals using paid preparers for their 2004 taxes: 78.9%
Here:
79%
State:
62%
(% for various income ranges: 76.7% for AGIs below $10k, 84.8% for AGIs $10k-25k, 75.8% for AGIs $25k-50k, 64.3% for AGIs $50k-75k, 59.4% for AGIs $75k-100k, 44.1% for AGIs over 100k)
Household received Food Stamps/SNAP in the past 12 months: 93 Household did not receive Food Stamps/SNAP in the past 12 months: 3,232
Women who had a birth in the past 12 months: 485 (486 now married, 0 unmarried) Women who did not have a birth in the past 12 months: 3,278 (2,516 now married, 750 unmarried)
Residents with income below the poverty level in 2022:
This zip code:
12.3%
Whole state:
12.7%
Residents with income below 50% of the poverty level in 2022:
This zip code:
6.1%
Whole state:
6.3%
Median number of rooms in houses and condos:
Here:
5.1
State:
6.8
Median number of rooms in apartments:
Here:
6.1
State:
4.6
Notable locations in this zip code not listed on our city pages
Creeks: Wortley Creek (A), Tiger Creek (B), Steam Mill Creek (C), Hamlet Creek (D), Dougherty Creek (E), Castin Creek (F), Heriot Creek (G), Upatoi Creek (H), Opossum Creek (I). Display/hide their locations on the map
In group quarters: 5,064 (-1 institutionalized population)
Size of family households: 450 2-persons, 712 3-persons, 1,147 4-persons, 393 5-persons, 153 6-persons, 63 7-or-more-persons
Size of nonfamily households: 360 1-person, 29 2-persons, 36 3-persons
4,273 married couples with children.
668 single-parent households (36 men, 632 women).
83.4% of residents of 31905 zip code speak English at home.
10.1% of residents speak Spanish at home (74% very well, 17% well, 5% not well, 3% not at all).
2.1% of residents speak other Indo-European language at home (72% very well, 25% well, 4% not well).
2.7% of residents speak Asian or Pacific Island language at home (74% very well, 26% well).
1.1% of residents speak other language at home (100% very well).
Foreign born population: 967 (5.8%) (71.2% of them are naturalized citizens)
Facilities with environmental interests located in this zip code:
RICHARD G WILSON ELEM SCHOOL (112 LAVOIE AVE in FT BENNING, GA)
(National Center for Education Statistics) - STATE ID-HEGAB9 Organizations: FORT BENNING DISTRICT (SCHOOL DISTRICT)
MORRIS R MCBRIDE ELEM SCHOOL (700 CUSTER ROAD in FT BENNING, GA)
(National Center for Education Statistics) - STATE ID-HEGAB6 Organizations: FORT BENNING DISTRICT (SCHOOL DISTRICT)
COLUMBUS GAS RESOURCE (LUMPKIN ROAD in COLUMBUS, GA)
AIR MINOR (AIRS/AFS) Business SIC classification: CRUDE PETROLEUM AND NATURAL GAS
BATTLE PARK HOMES (50 ARROWHEAD ROAD in FORT BENNING, GA)
COMPLIANCE ACTIVITY (Tracking inspections of insecticide, fungicide, and rodenticide, and toxic substances) Alternative names: BATTLE PARK HOMES (MR. LYNN R. SAMPLE)
Housing units lacking complete plumbing facilities: 0.9% Housing units lacking complete kitchen facilities: 1.1%
79.3%Electricity
17.5%Utility gas
1.5%No fuel used
1.4%Bottled, tank, or LP gas
Population in 1990: 22,869. Population change in the 1990s: +552 (+2.4%).
Place of birth for U.S.-born residents:
This state: 2,363
Northeast: 1,625
Midwest: 2,102
South: 6,042
West: 2,858
10% of the 31905 zip code residents lived in the same house 5 years ago. Out of people who lived in different houses, 3% lived in this county. Out of people who lived in different counties, 50% lived in Georgia.
60% of the 31905 zip code residents lived in the same house 1 year ago. Out of people who lived in different houses, 4% moved from this county. Out of people who lived in different houses, 6% moved from different county within same state. Out of people who lived in different houses, 95% moved from different state. Out of people who lived in different houses, 7% moved from abroad.
Private vs. public school enrollment:
Students in private schools in grades 1 to 8 (elementary and middle school): 239
Here:
12.3%
Georgia:
12.1%
Students in private schools in grades 9 to 12 (high school): 24
Here:
5.1%
Georgia:
10.8%
Students in private undergraduate colleges: 254
Here:
17.8%
Georgia:
17.1%
Occupation by median earnings in the past 12 months ($)
78,486Computer and mathematical occupations
55,662Production occupations
53,623Business and financial operations occupations
47,888Management occupations
38,571Fire fighting and prevention, and other protective service workers including supervisors
38,341Office and administrative support occupations
Companies with federal contracts located in this zip code:
ENTERPRISE LEASING COMPANY SOU (1713 MINI MALL in FORT BENNING, GA) : $35,588 in 5 contractsfrom 2003 to 2005
Contracts for Motor Passenger Services, Lease or Rental of Equipment -- Ground Effect Vehicles, Motor Vehicles, Trailers, and Cycles by Army Signed by year:2000: $0; 2001: $0; 2002: $0; 2003: $5,735; 2004: $21,669; 2005: $8,184; 2006: $0.
Biggest contracts:
$21,669 with Army for Motor Passenger Services. Signed on 2004-12-08. Completion date: 2005-01-30.
$6,324, same as above.Signed on 2005-01-31. Completion date: 2005-01-30.
$3,900 with Army for Lease or Rental of Equipment -- Ground Effect Vehicles, Motor Vehicles, Trailers, and Cycles. Signed on 2003-02-05. Completion date: 2003-02-20.
$1,860 with Army for Motor Passenger Services. Signed on 2005-03-07. Completion date: 2005-01-30.
Top industries in this zip code by the number of employees in 2005:
Health Care and Social Assistance: General Medical and Surgical Hospitals (500-999 employees: 1 establishment)
Other Services (except Public Administration): General Automotive Repair (100-249: 1)
Professional, Scientific, and Technical Services: Research and Development in the Physical, Engineering, and Life Sciences (50-99: 1, 1-4: 2)
Other Services (except Public Administration): Barber Shops (20-49: 1)
Real Estate and Rental and Leasing: Home Health Equipment Rental (20-49: 1)
Professional, Scientific, and Technical Services: Computer Systems Design Services (10-19: 1, 5-9: 2, 1-4: 1)
Professional, Scientific, and Technical Services: Human Resources and Executive Search Consulting Services (10-19: 1, 5-9: 1, 1-4: 2)
Finance and Insurance: Commercial Banking (10-19: 1, 1-4: 2)
People in group quarters in 2010:
5,127 people in military barracks and dormitories (nondisciplinary)
People in group quarters in 2000:
9,627 people in military barracks, etc.
2 people in other nonhousehold living situations
Fatal accident statistics in 2011:
Fatal accident count: 1
Vehicles involved in fatal accidents: 1
Fatal accidents caused by drunken drivers: 0
Fatalities: 1
Persons involved in fatal accidents: 1
Pedestrians involved in fatal accidents: 0
Fatal accident statistics in 2010:
Fatal accident count: 1
Vehicles involved in fatal accidents: 2
Fatal accidents caused by drunken drivers: 0
Fatalities: 1
Persons involved in fatal accidents: 2
Pedestrians involved in fatal accidents: 0
Home Mortgage Disclosure Act Aggregated Statistics For Year 2009 (Based on 2 partial tracts)
C) Refinancings
Number
Average Value
LOANS ORIGINATED
1
$119,190
APPLICATIONS APPROVED, NOT ACCEPTED
0
$0
APPLICATIONS DENIED
1
$79,270
APPLICATIONS WITHDRAWN
1
$125,180
FILES CLOSED FOR INCOMPLETENESS
0
$0
Aggregated Statistics For Year 2007 (Based on 2 partial tracts)
A) FHA, FSA/RHS & VA Home Purchase Loans
B) Conventional Home Purchase Loans
C) Refinancings
Number
Average Value
Number
Average Value
Number
Average Value
LOANS ORIGINATED
1
$197,710
1
$70,650
0
$0
APPLICATIONS APPROVED, NOT ACCEPTED
0
$0
0
$0
1
$38,420
APPLICATIONS DENIED
1
$103,260
0
$0
1
$102,130
APPLICATIONS WITHDRAWN
0
$0
0
$0
1
$115,440
FILES CLOSED FOR INCOMPLETENESS
0
$0
0
$0
0
$0
Aggregated Statistics For Year 2006 (Based on 2 partial tracts)
B) Conventional Home Purchase Loans
C) Refinancings
F) Non-occupant Loans on < 5 Family Dwellings (A B C & D)
Number
Average Value
Number
Average Value
Number
Average Value
LOANS ORIGINATED
1
$33,920
1
$240,430
0
$0
APPLICATIONS APPROVED, NOT ACCEPTED
1
$31,110
1
$21,740
0
$0
APPLICATIONS DENIED
1
$105,130
1
$134,550
1
$24,740
APPLICATIONS WITHDRAWN
0
$0
1
$85,640
0
$0
FILES CLOSED FOR INCOMPLETENESS
0
$0
0
$0
0
$0
Aggregated Statistics For Year 2005 (Based on 2 partial tracts)
A) FHA, FSA/RHS & VA Home Purchase Loans
B) Conventional Home Purchase Loans
C) Refinancings
D) Home Improvement Loans
F) Non-occupant Loans on < 5 Family Dwellings (A B C & D)
Number
Average Value
Number
Average Value
Number
Average Value
Number
Average Value
Number
Average Value
LOANS ORIGINATED
1
$93,140
0
$0
0
$0
0
$0
0
$0
APPLICATIONS APPROVED, NOT ACCEPTED
0
$0
0
$0
1
$79,080
0
$0
0
$0
APPLICATIONS DENIED
0
$0
2
$65,685
3
$79,397
2
$3,840
1
$42,350
APPLICATIONS WITHDRAWN
0
$0
3
$104,133
1
$139,800
0
$0
0
$0
FILES CLOSED FOR INCOMPLETENESS
0
$0
0
$0
1
$43,290
0
$0
0
$0
Aggregated Statistics For Year 2004 (Based on 2 partial tracts)
A) FHA, FSA/RHS & VA Home Purchase Loans
B) Conventional Home Purchase Loans
C) Refinancings
D) Home Improvement Loans
Number
Average Value
Number
Average Value
Number
Average Value
Number
Average Value
LOANS ORIGINATED
0
$0
1
$115,810
1
$97,260
0
$0
APPLICATIONS APPROVED, NOT ACCEPTED
0
$0
0
$0
1
$23,240
0
$0
APPLICATIONS DENIED
0
$0
1
$101,380
1
$226,750
1
$6,560
APPLICATIONS WITHDRAWN
1
$84,330
0
$0
0
$0
0
$0
FILES CLOSED FOR INCOMPLETENESS
0
$0
0
$0
0
$0
0
$0
Aggregated Statistics For Year 2003 (Based on 2 partial tracts)
B) Conventional Home Purchase Loans
C) Refinancings
Number
Average Value
Number
Average Value
LOANS ORIGINATED
0
$0
0
$0
APPLICATIONS APPROVED, NOT ACCEPTED
0
$0
0
$0
APPLICATIONS DENIED
1
$90,140
1
$44,230
APPLICATIONS WITHDRAWN
0
$0
1
$47,970
FILES CLOSED FOR INCOMPLETENESS
0
$0
0
$0
Aggregated Statistics For Year 2002 (Based on 2 partial tracts)
A) FHA, FSA/RHS & VA Home Purchase Loans
C) Refinancings
D) Home Improvement Loans
Number
Average Value
Number
Average Value
Number
Average Value
LOANS ORIGINATED
0
$0
0
$0
0
$0
APPLICATIONS APPROVED, NOT ACCEPTED
0
$0
0
$0
0
$0
APPLICATIONS DENIED
1
$62,970
1
$81,330
1
$21,180
APPLICATIONS WITHDRAWN
0
$0
0
$0
0
$0
FILES CLOSED FOR INCOMPLETENESS
0
$0
0
$0
0
$0
Aggregated Statistics For Year 2001 (Based on 2 partial tracts)
B) Conventional Home Purchase Loans
C) Refinancings
Number
Average Value
Number
Average Value
LOANS ORIGINATED
0
$0
1
$103,260
APPLICATIONS APPROVED, NOT ACCEPTED
1
$83,210
0
$0
APPLICATIONS DENIED
4
$50,925
1
$76,650
APPLICATIONS WITHDRAWN
0
$0
1
$88,450
FILES CLOSED FOR INCOMPLETENESS
0
$0
0
$0
Aggregated Statistics For Year 2000 (Based on 2 partial tracts)
A) FHA, FSA/RHS & VA Home Purchase Loans
B) Conventional Home Purchase Loans
C) Refinancings
Number
Average Value
Number
Average Value
Number
Average Value
LOANS ORIGINATED
1
$78,710
1
$74,400
0
$0
APPLICATIONS APPROVED, NOT ACCEPTED
0
$0
1
$45,160
1
$35,790
APPLICATIONS DENIED
1
$95,950
3
$46,477
1
$44,040
APPLICATIONS WITHDRAWN
0
$0
0
$0
0
$0
FILES CLOSED FOR INCOMPLETENESS
0
$0
0
$0
0
$0
Aggregated Statistics For Year 1999 (Based on 1 partial tract)


 Nearest zip codes: 31903, 31906, 31907, 31901, 36856, 36869.


