Estimated zip code population in 2022: 5,574 Zip code population in 2010: 5,429 Zip code population in 2000: 4,844
Houses and condos: 2,512 Renter-occupied apartments: 465
% of renters here:
22%
State:
34%
March 2022 cost of living index in zip code 31822: 81.3 (low, U.S. average is 100)
Land area: 114.6 sq. mi. Water area: 0.8 sq. mi.
Population density: 49 people per square mile
(very low).
OSM Map
General Map
Google Map
MSN Map
OSM Map
General Map
Google Map
MSN Map
OSM Map
General Map
Google Map
MSN Map
OSM Map
General Map
Google Map
MSN Map
Please wait while loading the map...
Real estate property taxes paid for housing units in 2022:
This zip code:
0.8% ($1,908)
Georgia:
0.7% ($2,160)
Median real estate property taxes paid for housing units with mortgages in 2022: $2,520 (0.8%) Median real estate property taxes paid for housing units with no mortgage in 2022: $1,139 (0.8%)
Averages for the 2020 tax year for zip code 31822, filed in 2021:
Average Adjusted Gross Income (AGI) in 2020: $67,156 (Individual Income Tax Returns)
Here:
$67,156
State:
$70,847
Salary/wage: $53,408 (reported on 78.6% of returns)
Here:
$53,408
State:
$59,126
(% of AGI for various income ranges: 1203.2% for AGIs below $25k, 3484.1% for AGIs $25k-50k, 6680.0% for AGIs $50k-75k, 8960.0% for AGIs $75k-100k, 16865.7% for AGIs $100k-200k, 51154.0% for AGIs over 200k)
Taxable interest for individuals: $1,737 (reported on 26.4% of returns)
This zip code:
$1,737
Georgia:
$2,011
(% of AGI for various income ranges: 17.5% for AGIs below $25k, 26.1% for AGIs $25k-50k, 52.2% for AGIs $50k-75k, 176.7% for AGIs $75k-100k, 151.0% for AGIs $100k-200k, 614.0% for AGIs over 200k)
Ordinary dividends: $12,063 (reported on 20.7% of returns)
Here:
$12,063
State:
$8,996
(% of AGI for various income ranges: 13.2% for AGIs below $25k, 76.9% for AGIs $25k-50k, 90.4% for AGIs $50k-75k, 288.7% for AGIs $75k-100k, 685.7% for AGIs $100k-200k, 8638.0% for AGIs over 200k)
Net capital gain/loss in AGI: +$15,778 (reported on 16.7% of returns)
Here:
+$15,778
State:
+$28,402
(% of AGI for various income ranges: 24.1% for AGIs $25k-50k, 160.4% for AGIs $50k-75k, 317.3% for AGIs $75k-100k, 705.2% for AGIs $100k-200k, 9630.0% for AGIs over 200k)
Profit/loss from business: +$3,749 (reported on 22.1% of returns)
Here:
+$3,749
State:
+$6,707
(% of AGI for various income ranges: 0.4% for AGIs below $25k, 136.1% for AGIs $50k-75k, 412.7% for AGIs $75k-100k, 235.2% for AGIs $100k-200k, 2418.0% for AGIs over 200k)
Taxable individual retirement arrangement distribution: $26,229 (reported on 10.1% of returns)
31822:
$26,229
Georgia:
$20,525
(% of AGI for various income ranges: 42.5% for AGIs below $25k, 114.9% for AGIs $25k-50k, 307.8% for AGIs $50k-75k, 504.7% for AGIs $75k-100k, 1333.8% for AGIs $100k-200k, 4392.0% for AGIs over 200k)
Total itemized deductions: $34,468 (reported on 11.2% of returns)
Here:
$34,468
State:
$34,001
(% of AGI for various income ranges: 204.1% for AGIs $25k-50k, 512.2% for AGIs $50k-75k, 531.3% for AGIs $75k-100k, 1614.8% for AGIs $100k-200k, 8638.0% for AGIs over 200k)
Charity contributions: $15,533 (reported on 9.8% of returns)
Here:
$15,533
State:
$14,164
(% of AGI for various income ranges: 41.0% for AGIs $25k-50k, 162.2% for AGIs $50k-75k, 110.7% for AGIs $75k-100k, 551.9% for AGIs $100k-200k, 4590.0% for AGIs over 200k)
Taxes paid: $7,371 (reported on 11.2% of returns)
31822:
$7,371
State:
$7,540
(% of AGI for various income ranges: 28.8% for AGIs $25k-50k, 117.8% for AGIs $50k-75k, 113.3% for AGIs $75k-100k, 431.4% for AGIs $100k-200k, 1594.0% for AGIs over 200k)
Earned income credit: $2,445 (reported on 19.9% of returns)
Here:
$2,445
State:
$2,530
(% of AGI for various income ranges: 121.2% for AGIs below $25k, 89.0% for AGIs $25k-50k)
Percentage of individuals using paid preparers for their 2020 taxes: 92.8%
Here:
93%
State:
93%
(% for various income ranges: 92.9% for AGIs below $25k, 95.2% for AGIs $25k-50k, 91.7% for AGIs $50k-75k, 88.0% for AGIs $75k-100k, 92.7% for AGIs $100k-200k, 92.9% for AGIs over 200k)
Averages for the 2012 tax year for zip code 31822, filed in 2013:
Average Adjusted Gross Income (AGI) in 2012: $63,963 (Individual Income Tax Returns)
Here:
$63,963
State:
$56,131
Salary/wage: $48,924 (reported on 83.2% of returns)
Here:
$48,924
State:
$47,942
(% of AGI for various income ranges: 89.1% for AGIs below $25k, 80.6% for AGIs $25k-50k, 73.5% for AGIs $50k-75k, 66.5% for AGIs $75k-100k, 66.1% for AGIs $100k-200k, 45.2% for AGIs over 200k)
Taxable interest for individuals: $1,383 (reported on 29.8% of returns)
This zip code:
$1,383
Georgia:
$1,706
(% of AGI for various income ranges: 0.7% for AGIs below $25k, 0.9% for AGIs $25k-50k, 0.8% for AGIs $50k-75k, 1.1% for AGIs $75k-100k, 0.6% for AGIs $100k-200k, 0.3% for AGIs over 200k)
Ordinary dividends: $7,565 (reported on 21.4% of returns)
Here:
$7,565
State:
$7,265
(% of AGI for various income ranges: 1.6% for AGIs below $25k, 1.6% for AGIs $25k-50k, 1.5% for AGIs $50k-75k, 1.5% for AGIs $75k-100k, 3.2% for AGIs $100k-200k, 3.4% for AGIs over 200k)
Net capital gain/loss in AGI: +$11,310 (reported on 16.8% of returns)
Here:
+$11,310
State:
+$16,323
(% of AGI for various income ranges: 0.8% for AGIs $50k-75k, 0.9% for AGIs $75k-100k, 1.7% for AGIs $100k-200k, 6.9% for AGIs over 200k)
Profit/loss from business: +$2,378 (reported on 20.6% of returns)
Here:
+$2,378
State:
+$7,583
(% of AGI for various income ranges: 0.7% for AGIs $25k-50k, 0.2% for AGIs $50k-75k, 3.0% for AGIs $75k-100k, 1.5% for AGIs $100k-200k, 0.9% for AGIs over 200k)
Taxable individual retirement arrangement distribution: $15,969 (reported on 10.9% of returns)
31822:
$15,969
Georgia:
$17,199
(% of AGI for various income ranges: 2.1% for AGIs below $25k, 3.1% for AGIs $25k-50k, 3.5% for AGIs $50k-75k, 4.0% for AGIs $75k-100k, 6.6% for AGIs $100k-200k)
Total itemized deductions: $23,617 (21% of AGI, reported on 41.2% of returns)
Here:
$23,617
State:
$23,886
Here:
21.4% of AGI
State:
21.5% of AGI
(% of AGI for various income ranges: 15.7% for AGIs below $25k, 21.1% for AGIs $25k-50k, 19.2% for AGIs $50k-75k, 20.0% for AGIs $75k-100k, 18.7% for AGIs $100k-200k, 8.2% for AGIs over 200k)
Charity contributions: $5,215 (reported on 34.5% of returns)
Here:
$5,215
State:
$5,507
(% of AGI for various income ranges: 1.4% for AGIs below $25k, 3.1% for AGIs $25k-50k, 3.1% for AGIs $50k-75k, 3.8% for AGIs $75k-100k, 4.1% for AGIs $100k-200k, 1.9% for AGIs over 200k)
Taxes paid: $7,232 (reported on 40.3% of returns)
31822:
$7,232
State:
$7,838
(% of AGI for various income ranges: 2.1% for AGIs below $25k, 3.7% for AGIs $25k-50k, 4.9% for AGIs $50k-75k, 5.7% for AGIs $75k-100k, 6.5% for AGIs $100k-200k, 4.0% for AGIs over 200k)
Earned income credit: $2,685 (reported on 26.1% of returns)
Here:
$2,685
State:
$2,589
(% of AGI for various income ranges: 10.4% for AGIs below $25k, 1.5% for AGIs $25k-50k)
Percentage of individuals using paid preparers for their 2012 taxes: 68.9%
Here:
69%
State:
55%
(% for various income ranges: 70.3% for AGIs below $25k, 67.2% for AGIs $25k-50k, 71.9% for AGIs $50k-75k, 70.6% for AGIs $75k-100k, 59.1% for AGIs $100k-200k, 75.0% for AGIs over 200k)
Averages for the 2004 tax year for zip code 31822, filed in 2005:
Average Adjusted Gross Income (AGI) in 2004: $44,540 (Individual Income Tax Returns)
Here:
$44,540
State:
$47,553
Salary/wage: $37,514 (reported on 87.0% of returns)
Here:
$37,514
State:
$42,178
(% of AGI for various income ranges: 155.9% for AGIs below $10k, 85.5% for AGIs $10k-25k, 85.8% for AGIs $25k-50k, 80.3% for AGIs $50k-75k, 76.8% for AGIs $75k-100k, 54.0% for AGIs over 100k)
Taxable interest for individuals: $1,712 (reported on 35.0% of returns)
This zip code:
$1,712
Georgia:
$1,772
(% of AGI for various income ranges: 4.6% for AGIs below $10k, 2.3% for AGIs $10k-25k, 1.0% for AGIs $25k-50k, 0.8% for AGIs $50k-75k, 0.8% for AGIs $75k-100k, 1.6% for AGIs over 100k)
Taxable dividends: $3,877 (reported on 22.3% of returns)
Here:
$3,877
State:
$4,283
(% of AGI for various income ranges: 4.9% for AGIs below $10k, 1.3% for AGIs $10k-25k, 1.1% for AGIs $25k-50k, 1.1% for AGIs $50k-75k, 2.1% for AGIs $75k-100k, 2.9% for AGIs over 100k)
Net capital gain/loss: +$17,206 (reported on 16.9% of returns)
Here:
+$17,206
State:
+$16,461
(% of AGI for various income ranges: -2.6% for AGIs below $10k, -0.2% for AGIs $10k-25k, 0.8% for AGIs $25k-50k, 1.1% for AGIs $50k-75k, 2.2% for AGIs $75k-100k, 16.7% for AGIs over 100k)
Profit/loss from business: +$6,897 (reported on 16.8% of returns)
Here:
+$6,897
State:
+$8,201
(% of AGI for various income ranges: -1.8% for AGIs below $10k, 2.4% for AGIs $10k-25k, 1.6% for AGIs $25k-50k, 2.2% for AGIs $50k-75k, 3.6% for AGIs $75k-100k, 3.3% for AGIs over 100k)
IRA payment deduction: $3,056 (reported on 1.6% of returns)
31822:
$3,056
Georgia:
$2,969
Total itemized deductions: $18,959 (24% of AGI, reported on 38.8% of returns)
Here:
$18,959
State:
$19,944
Here:
23.6% of AGI
State:
22.6% of AGI
(% of AGI for various income ranges: 19.6% for AGIs below $10k, 11.8% for AGIs $10k-25k, 16.2% for AGIs $25k-50k, 20.4% for AGIs $50k-75k, 18.4% for AGIs $75k-100k, 15.1% for AGIs over 100k)
Charity contributions deductions: $3,936 (5% of AGI, reported on 34.7% of returns)
Here:
$3,936
State:
$4,354
Here:
4.7% of AGI
State:
4.7% of AGI
(% of AGI for various income ranges: 0.9% for AGIs below $10k, 1.3% for AGIs $10k-25k, 2.8% for AGIs $25k-50k, 4.3% for AGIs $50k-75k, 3.4% for AGIs $75k-100k, 3.0% for AGIs over 100k)
Total tax: $6,381 (reported on 69.5% of returns)
31822:
$6,381
State:
$8,223
(% of AGI for various income ranges: 3.9% for AGIs below $10k, 2.9% for AGIs $10k-25k, 5.8% for AGIs $25k-50k, 7.8% for AGIs $50k-75k, 9.9% for AGIs $75k-100k, 15.8% for AGIs over 100k)
Earned income credit: $2,047 (reported on 23.4% of returns)
Here:
$2,047
State:
$1,986
Percentage of individuals using paid preparers for their 2004 taxes: 68.0%
Here:
68%
State:
62%
(% for various income ranges: 61.9% for AGIs below $10k, 73.3% for AGIs $10k-25k, 68.3% for AGIs $25k-50k, 63.1% for AGIs $50k-75k, 67.7% for AGIs $75k-100k, 72.6% for AGIs over 100k)
Likely homosexual households (counted as self-reported same-sex unmarried-partner households)
Lesbian couples: 0.5% of all households
Gay men: 0.0% of all households
Household received Food Stamps/SNAP in the past 12 months: 481 Household did not receive Food Stamps/SNAP in the past 12 months: 1,651
Women who had a birth in the past 12 months: 138 (55 now married, 83 unmarried) Women who did not have a birth in the past 12 months: 926 (464 now married, 461 unmarried)
Housing units in zip code 31822 with a mortgage: 714 (13 second mortgage, 5 both second mortgage and home equity loan) Median monthly owner costs for units with a mortgage: $1,472 Median monthly owner costs for units without a mortgage: $560
Residents with income below the poverty level in 2022:
This zip code:
21.0%
Whole state:
12.7%
Residents with income below 50% of the poverty level in 2022:
This zip code:
11.6%
Whole state:
6.3%
Median number of rooms in houses and condos:
Here:
6.8
State:
6.8
Median number of rooms in apartments:
Here:
4.6
State:
4.6
Notable locations in this zip code not listed on our city pages
Notable locations in zip code 31822: Sunnyside Community Club (A), Pine Mountain Volunteer Fire Department (B), Troup County Fire Department Station 12 (C), Hopewell Community Volunteer Fire Department (D). Display/hide their locations on the map
Churches in zip code 31822 include: Oak Grove Church (A), Living Christ Church (B), Bethany Church (C), Bright Star Church (D), Calloway Memorial Chapel (E), Hopewell Church (F), Ebenezer Church (G), Midway Church (H), Oak Grove Church (I). Display/hide their locations on the map
Cemeteries: Bass Cemetery (1), Bright Star Cemetery (2), Sledge Cemetery (3), Smith Cemetery (4), Smith-Hattox Cemetery (5), Carter Cemetery (6), Murphy Cemetery (7). Display/hide their locations on the map
Lakes and reservoirs: Hummingbird Lake (A), Mockingbrid Lake (B), Falls Creek Lake (C), Tabernacle Camp Lake (D), Floyd Lake (E), Livingston Lake (F), Callaway Enterprises Lake (G), Floyd Lake (H). Display/hide their locations on the map
In group quarters: 44 (-1 institutionalized population)
Size of family households: 852 2-persons, 289 3-persons, 186 4-persons, 103 5-persons, 7 6-persons, 82 7-or-more-persons
Size of nonfamily households: 579 1-person, 9 2-persons
566 married couples with children.
216 single-parent households (90 men, 126 women).
97.1% of residents of 31822 zip code speak English at home.
2.3% of residents speak Spanish at home (91% very well, 9% well).
0.1% of residents speak Asian or Pacific Island language at home (100% very well).
0.6% of residents speak other language at home (100% very well).
Foreign born population: 43 (0.8%) (63.2% of them are naturalized citizens)
This zip code:
0.8%
Whole state:
10.7%
64%Haiti
12%Australia
11%English
9%Irish
6%German
5%American
3%European
3%Welsh
2%Jamaican
Year of entry for the foreign-born population
42010 or later
552000 to 2009
01990 to 1999
13Before 1990
Facilities with environmental interests located in this zip code:
MILLIKEN & CO PINE MOUNTAIN PLANT (GA HIGHWAY 27 in PINE MOUNTAIN, GA)
PINE MOUNTAIN, TOWN OF (WPCP) (GEORGIA HIGHWAY 18 in PINE MOUNTAIN, GA)
National Pollutant Discharge Elimination System NON-MAJOR (Tracking pollutant discharge elimination systems) - permit Business SIC classification: SEWERAGE SYSTEMS Organizations: TOWN OF PINE MOUNTAIN (CONTACT/OWNER)
MILLIKEN & COMPANY (7495 HAMILTON ROAD in PINE MOUNTAIN, GA)
AIR MINOR (AIRS/AFS) Business SIC classification: BROADWOVEN FABRIC MILLS, MANMADE FIBER AND SILK
Housing units lacking complete plumbing facilities: 0.9% Housing units lacking complete kitchen facilities: 0.6%
76.2%Electricity
20.6%Bottled, tank, or LP gas
2.0%Utility gas
0.9%Wood
Population in 1990: 3,548. Population change in the 1990s: +1,296 (+36.5%).
Place of birth for U.S.-born residents:
This state: 4,294
Northeast: 162
Midwest: 229
South: 655
West: 107
54% of the 31822 zip code residents lived in the same house 5 years ago. Out of people who lived in different houses, 44% lived in this county. Out of people who lived in different counties, 50% lived in Georgia.
91% of the 31822 zip code residents lived in the same house 1 year ago. Out of people who lived in different houses, 19% moved from this county. Out of people who lived in different houses, 69% moved from different county within same state. Out of people who lived in different houses, 3% moved from different state. Out of people who lived in different houses, 10% moved from abroad.
Private vs. public school enrollment:
Students in private schools in grades 1 to 8 (elementary and middle school): 58
Here:
11.0%
Georgia:
12.1%
Students in private schools in grades 9 to 12 (high school): 6
Here:
2.5%
Georgia:
10.8%
Students in private undergraduate colleges: 6
Here:
2.8%
Georgia:
17.1%
Occupation by median earnings in the past 12 months ($)
98,397Life, physical, and social science occupations
78,673Sales and related occupations
74,653Computer and mathematical occupations
68,717Business and financial operations occupations
62,684Community and social service occupations
62,474Architecture and engineering occupations
Companies with federal contracts located in this zip code:
CALLAWAY, LARRY ADVERTISING IN (HWY 190 HINES GAS RD in PINE MOUNTAIN, GA; small business)
$2,691 with Army for Lodging - Hotel/Motel. Signed on 2005-05-24. Completion date: 2005-06-05.
Top industries in this zip code by the number of employees in 2005:
Arts, Entertainment, and Recreation: Zoos and Botanical Gardens (50-99: 1, 20-49: 1)
Arts, Entertainment, and Recreation: All Other Amusement and Recreation Industries (10-19: 3, 1-4: 3)
Finance and Insurance: Commercial Banking (20-49: 1, 10-19: 1)
Management of Companies and Enterprises: Corporate, Subsidiary, and Regional Managing Offices (20-49: 1, 1-4: 1)
Administrative and Support and Waste Management and Remediation Services: Janitorial Services (20-49: 1)
People in group quarters in 2010:
25 people in college/university student housing
Fatal accident statistics in 2014:
Fatal accident count: 2
Vehicles involved in fatal accidents: 2
Fatal accidents caused by drunken drivers: 1
Fatalities: 2
Persons involved in fatal accidents: 3
Pedestrians involved in fatal accidents: 0
Fatal accident statistics in 2012:
Fatal accident count: 2
Vehicles involved in fatal accidents: 3
Fatal accidents caused by drunken drivers: 0
Fatalities: 3
Persons involved in fatal accidents: 14
Pedestrians involved in fatal accidents: 0
2003 - 2018 National Fire Incident Reporting System (NFIRS) incidents
Based on the data from the years 2003 - 2018 the average number of fires per year is 38. The highest number of fires - 76 took place in 2016, and the least - 10 in 2003. The data has a rising trend.
When looking into fire subcategories, the most reports belonged to: Outside Fires (46.9%), and Structure Fires (39.0%).
Fire incident types reported to NFIRS in Zip Code 31822

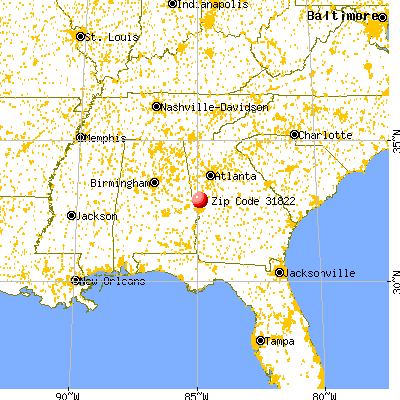


 Nearest zip codes: 31823, 31811, 30241, 31833, 31830, 31804.


 Based on the data from the years 2003 - 2018 the average number of fires per year is 38. The highest number of fires - 76 took place in 2016, and the least - 10 in 2003. The data has a rising trend.
 When looking into fire subcategories, the most reports belonged to: Outside Fires (46.9%), and Structure Fires (39.0%).