Estimated zip code population in 2022: 5,503 Zip code population in 2010: 4,333 Zip code population in 2000: 3,505
Houses and condos: 3,319 Renter-occupied apartments: 237
% of renters here:
11%
State:
34%
March 2022 cost of living index in zip code 30559: 83.4 (less than average, U.S. average is 100)
Land area: 49.4 sq. mi. Water area: 0.2 sq. mi.
Population density: 111 people per square mile
(very low).
OSM Map
General Map
Google Map
MSN Map
OSM Map
General Map
Google Map
MSN Map
OSM Map
General Map
Google Map
MSN Map
OSM Map
General Map
Google Map
MSN Map
Please wait while loading the map...
Real estate property taxes paid for housing units in 2022:
This zip code:
0.4% ($1,162)
Georgia:
0.7% ($2,160)
Median real estate property taxes paid for housing units with mortgages in 2022: $1,231 (0.3%) Median real estate property taxes paid for housing units with no mortgage in 2022: $946 (0.5%)
Averages for the 2020 tax year for zip code 30559, filed in 2021:
Average Adjusted Gross Income (AGI) in 2020: $62,145 (Individual Income Tax Returns)
Here:
$62,145
State:
$70,847
Salary/wage: $52,049 (reported on 68.3% of returns)
Here:
$52,049
State:
$59,126
(% of AGI for various income ranges: 888.7% for AGIs below $25k, 2861.4% for AGIs $25k-50k, 5865.3% for AGIs $50k-75k, 7167.8% for AGIs $75k-100k, 13244.7% for AGIs $100k-200k, 66736.7% for AGIs over 200k)
Taxable interest for individuals: $1,575 (reported on 28.8% of returns)
This zip code:
$1,575
Georgia:
$2,011
(% of AGI for various income ranges: 16.9% for AGIs below $25k, 52.4% for AGIs $25k-50k, 31.1% for AGIs $50k-75k, 155.6% for AGIs $75k-100k, 151.3% for AGIs $100k-200k, 726.7% for AGIs over 200k)
Ordinary dividends: $6,469 (reported on 17.6% of returns)
Here:
$6,469
State:
$8,996
(% of AGI for various income ranges: 38.1% for AGIs below $25k, 63.8% for AGIs $25k-50k, 76.8% for AGIs $50k-75k, 201.1% for AGIs $75k-100k, 343.3% for AGIs $100k-200k, 3483.3% for AGIs over 200k)
Net capital gain/loss in AGI: +$17,478 (reported on 18.0% of returns)
Here:
+$17,478
State:
+$28,402
(% of AGI for various income ranges: 20.0% for AGIs below $25k, 27.3% for AGIs $25k-50k, 124.7% for AGIs $50k-75k, 258.9% for AGIs $75k-100k, 1074.0% for AGIs $100k-200k, 13923.3% for AGIs over 200k)
Profit/loss from business: +$10,717 (reported on 25.9% of returns)
Here:
+$10,717
State:
+$6,707
(% of AGI for various income ranges: 330.2% for AGIs below $25k, 323.5% for AGIs $25k-50k, 276.3% for AGIs $50k-75k, 800.0% for AGIs $75k-100k, 316.0% for AGIs $100k-200k, 3270.0% for AGIs over 200k)
Taxable individual retirement arrangement distribution: $24,779 (reported on 13.7% of returns)
30559:
$24,779
Georgia:
$20,525
(% of AGI for various income ranges: 87.0% for AGIs below $25k, 213.2% for AGIs $25k-50k, 283.2% for AGIs $50k-75k, 1153.3% for AGIs $75k-100k, 1566.0% for AGIs $100k-200k, 5846.7% for AGIs over 200k)
Total itemized deductions: $32,600 (reported on 7.8% of returns)
Here:
$32,600
State:
$34,001
(% of AGI for various income ranges: 108.3% for AGIs below $25k, 513.2% for AGIs $50k-75k, 1296.7% for AGIs $100k-200k, 5703.3% for AGIs over 200k)
Charity contributions: $9,738 (reported on 6.3% of returns)
Here:
$9,738
State:
$14,164
(% of AGI for various income ranges: 99.5% for AGIs $50k-75k, 338.0% for AGIs $100k-200k, 1900.0% for AGIs over 200k)
Taxes paid: $6,987 (reported on 7.3% of returns)
30559:
$6,987
State:
$7,540
(% of AGI for various income ranges: 121.1% for AGIs $50k-75k, 304.7% for AGIs $100k-200k, 1203.3% for AGIs over 200k)
Earned income credit: $2,512 (reported on 20.5% of returns)
Here:
$2,512
State:
$2,530
(% of AGI for various income ranges: 134.6% for AGIs below $25k, 88.6% for AGIs $25k-50k)
Percentage of individuals using paid preparers for their 2020 taxes: 95.6%
Here:
96%
State:
93%
(% for various income ranges: 93.6% for AGIs below $25k, 95.8% for AGIs $25k-50k, 96.4% for AGIs $50k-75k, 100.0% for AGIs $75k-100k, 96.2% for AGIs $100k-200k, 100.0% for AGIs over 200k)
Averages for the 2012 tax year for zip code 30559, filed in 2013:
Average Adjusted Gross Income (AGI) in 2012: $42,784 (Individual Income Tax Returns)
Here:
$42,784
State:
$56,131
Salary/wage: $36,232 (reported on 75.0% of returns)
Here:
$36,232
State:
$47,942
(% of AGI for various income ranges: 63.8% for AGIs below $25k, 71.1% for AGIs $25k-50k, 60.9% for AGIs $50k-75k, 59.4% for AGIs $75k-100k, 59.7% for AGIs $100k-200k, 65.5% for AGIs over 200k)
Taxable interest for individuals: $955 (reported on 25.6% of returns)
This zip code:
$955
Georgia:
$1,706
(% of AGI for various income ranges: 0.8% for AGIs below $25k, 0.7% for AGIs $25k-50k, 0.6% for AGIs $50k-75k, 0.6% for AGIs $75k-100k, 0.7% for AGIs $100k-200k)
Ordinary dividends: $3,310 (reported on 12.8% of returns)
Here:
$3,310
State:
$7,265
(% of AGI for various income ranges: 0.8% for AGIs below $25k, 1.2% for AGIs $25k-50k, 1.4% for AGIs $50k-75k, 2.0% for AGIs $100k-200k)
Net capital gain/loss in AGI: +$137 (reported on 12.2% of returns)
Here:
+$137
State:
+$16,323
(% of AGI for various income ranges: 0.2% for AGIs $50k-75k, 0.1% for AGIs $75k-100k, 0.7% for AGIs $100k-200k)
Profit/loss from business: +$10,557 (reported on 26.9% of returns)
Here:
+$10,557
State:
+$7,583
(% of AGI for various income ranges: 17.9% for AGIs below $25k, 5.2% for AGIs $25k-50k, 5.3% for AGIs $50k-75k, 2.6% for AGIs $75k-100k, 8.5% for AGIs $100k-200k)
Taxable individual retirement arrangement distribution: $18,622 (reported on 11.5% of returns)
30559:
$18,622
Georgia:
$17,199
(% of AGI for various income ranges: 4.7% for AGIs below $25k, 3.2% for AGIs $25k-50k, 5.9% for AGIs $50k-75k, 6.6% for AGIs $75k-100k, 9.1% for AGIs $100k-200k)
Total itemized deductions: $20,865 (25% of AGI, reported on 29.5% of returns)
Here:
$20,865
State:
$23,886
Here:
24.8% of AGI
State:
21.5% of AGI
(% of AGI for various income ranges: 10.2% for AGIs below $25k, 14.0% for AGIs $25k-50k, 17.0% for AGIs $50k-75k, 17.0% for AGIs $75k-100k, 16.2% for AGIs $100k-200k, 11.5% for AGIs over 200k)
Charity contributions: $3,626 (reported on 21.8% of returns)
Here:
$3,626
State:
$5,507
(% of AGI for various income ranges: 0.7% for AGIs below $25k, 1.5% for AGIs $25k-50k, 1.8% for AGIs $50k-75k, 1.3% for AGIs $75k-100k, 2.7% for AGIs $100k-200k, 2.8% for AGIs over 200k)
Taxes paid: $5,239 (reported on 29.5% of returns)
30559:
$5,239
State:
$7,838
(% of AGI for various income ranges: 1.3% for AGIs below $25k, 2.6% for AGIs $25k-50k, 3.5% for AGIs $50k-75k, 4.0% for AGIs $75k-100k, 5.1% for AGIs $100k-200k, 4.9% for AGIs over 200k)
Earned income credit: $2,636 (reported on 30.1% of returns)
Here:
$2,636
State:
$2,589
(% of AGI for various income ranges: 10.3% for AGIs below $25k, 1.5% for AGIs $25k-50k)
Percentage of individuals using paid preparers for their 2012 taxes: 67.9%
Here:
68%
State:
55%
(% for various income ranges: 68.8% for AGIs below $25k, 64.7% for AGIs $25k-50k, 68.4% for AGIs $50k-75k, 70.0% for AGIs $75k-100k, 70.0% for AGIs $100k-200k, 66.7% for AGIs over 200k)
Averages for the 2004 tax year for zip code 30559, filed in 2005:
Average Adjusted Gross Income (AGI) in 2004: $32,130 (Individual Income Tax Returns)
Here:
$32,130
State:
$47,553
Salary/wage: $28,374 (reported on 73.8% of returns)
Here:
$28,374
State:
$42,178
(% of AGI for various income ranges: 128.4% for AGIs below $10k, 58.6% for AGIs $10k-25k, 71.6% for AGIs $25k-50k, 75.1% for AGIs $50k-75k, 62.2% for AGIs $75k-100k, 46.0% for AGIs over 100k)
Taxable interest for individuals: $1,478 (reported on 36.2% of returns)
This zip code:
$1,478
Georgia:
$1,772
(% of AGI for various income ranges: 7.5% for AGIs below $10k, 2.5% for AGIs $10k-25k, 1.5% for AGIs $25k-50k, 0.6% for AGIs $50k-75k, 1.4% for AGIs $75k-100k, 2.0% for AGIs over 100k)
Taxable dividends: $1,435 (reported on 13.3% of returns)
Here:
$1,435
State:
$4,283
(% of AGI for various income ranges: 0.5% for AGIs below $10k, 0.5% for AGIs $10k-25k, 0.5% for AGIs $25k-50k, 0.5% for AGIs $50k-75k, 0.8% for AGIs $75k-100k, 0.7% for AGIs over 100k)
Net capital gain/loss: +$13,924 (reported on 13.3% of returns)
Here:
+$13,924
State:
+$16,461
(% of AGI for various income ranges: -2.9% for AGIs below $10k, 2.1% for AGIs $10k-25k, 2.7% for AGIs $25k-50k, 1.8% for AGIs $50k-75k, 3.9% for AGIs $75k-100k, 19.1% for AGIs over 100k)
Profit/loss from business: +$7,923 (reported on 28.1% of returns)
Here:
+$7,923
State:
+$8,201
(% of AGI for various income ranges: 20.4% for AGIs below $10k, 17.9% for AGIs $10k-25k, 5.8% for AGIs $25k-50k, 4.2% for AGIs $50k-75k, 3.4% for AGIs $75k-100k, 4.0% for AGIs over 100k)
Profit/loss from farming: +$1,533 (reported on 1.1% of returns)
Here:
+$1,533
State:
-$6,357
IRA payment deduction: $3,000 (reported on 2.1% of returns)
30559:
$3,000
Georgia:
$2,969
Total itemized deductions: $18,443 (30% of AGI, reported on 26.5% of returns)
Here:
$18,443
State:
$19,944
Here:
29.9% of AGI
State:
22.6% of AGI
(% of AGI for various income ranges: 25.4% for AGIs below $10k, 11.7% for AGIs $10k-25k, 14.1% for AGIs $25k-50k, 15.8% for AGIs $50k-75k, 15.2% for AGIs $75k-100k, 17.5% for AGIs over 100k)
Charity contributions deductions: $3,122 (5% of AGI, reported on 22.0% of returns)
Here:
$3,122
State:
$4,354
Here:
4.8% of AGI
State:
4.7% of AGI
(% of AGI for various income ranges: 1.5% for AGIs $10k-25k, 1.7% for AGIs $25k-50k, 2.1% for AGIs $50k-75k, 1.9% for AGIs $75k-100k, 3.5% for AGIs over 100k)
Total tax: $4,010 (reported on 72.4% of returns)
30559:
$4,010
State:
$8,223
(% of AGI for various income ranges: 8.4% for AGIs below $10k, 4.8% for AGIs $10k-25k, 6.1% for AGIs $25k-50k, 9.2% for AGIs $50k-75k, 10.2% for AGIs $75k-100k, 15.1% for AGIs over 100k)
Earned income credit: $2,018 (reported on 24.5% of returns)
Here:
$2,018
State:
$1,986
Percentage of individuals using paid preparers for their 2004 taxes: 73.7%
Here:
74%
State:
62%
(% for various income ranges: 66.0% for AGIs below $10k, 75.4% for AGIs $10k-25k, 77.6% for AGIs $25k-50k, 78.0% for AGIs $50k-75k, 72.5% for AGIs $75k-100k, 77.2% for AGIs over 100k)
Likely homosexual households (counted as self-reported same-sex unmarried-partner households)
Lesbian couples: 0.9% of all households
Gay men: 0.0% of all households
Household received Food Stamps/SNAP in the past 12 months: 134 Household did not receive Food Stamps/SNAP in the past 12 months: 2,076
Women who had a birth in the past 12 months: 104 (104 now married, 0 unmarried) Women who did not have a birth in the past 12 months: 956 (425 now married, 530 unmarried)
Housing units in zip code 30559 with a mortgage: 1,131 (46 second mortgage, 49 both second mortgage and home equity loan) Median monthly owner costs for units with a mortgage: $1,380 Median monthly owner costs for units without a mortgage: $358
Residents with income below the poverty level in 2022:
This zip code:
9.5%
Whole state:
12.7%
Residents with income below 50% of the poverty level in 2022:
This zip code:
3.7%
Whole state:
6.3%
Median number of rooms in houses and condos:
Here:
6.1
State:
6.8
Median number of rooms in apartments:
Here:
4.0
State:
4.6
Notable locations in this zip code not listed on our city pages
Notable locations in zip code 30559: Fannin County Fire Department Station 2 (A), Fannin County Fire Department Station 10 (B), Cooper Basin Recreation Center (C). Display/hide their locations on the map
Churches in zip code 30559 include: Harper Church (A), Mount Herman Church (B), New Mount Gilead Church (C), Old Jerusalem Church (D), Jerusalem Church (E), Welcome Hill Church (F), Mineral Bluff House of Prayer (G), Missionary Church Number 2 (H), Church of God of Prophecy (I). Display/hide their locations on the map
Cemeteries: Anderson Cemetery (1), Hensley Cemetery (2), Jerusalem Cemetery (3), Jones Cemetery (4), Douthit Cemetery (5), Salem Number 2 Missionary Baptist Church Cemetery (6). Display/hide their locations on the map
Streams, rivers, and creeks: Synacia Creek (A), Sugar Creek (B), Mill Creek (C), Long Creek (D), Hemptown Creek (E), Farmer Branch (F), Daley Creek (G), Cutcane Creek (H), Creaseman Branch (I). Display/hide their locations on the map
632 married couples with children.
187 single-parent households (16 men, 171 women).
97.2% of residents of 30559 zip code speak English at home.
1.2% of residents speak Spanish at home (100% very well).
1.2% of residents speak other Indo-European language at home (100% very well).
0.4% of residents speak Asian or Pacific Island language at home (100% very well).
Foreign born population: 166 (3.0%) (71.2% of them are naturalized citizens)
This zip code:
3.0%
Whole state:
10.7%
35%Sweden
17%Chile
14%Romania
13%France
3%Hong Kong
2%Malaysia
2%Guatemala
26%English
15%Irish
15%American
9%German
5%Italian
3%Scotch-Irish
2%Swedish
Year of entry for the foreign-born population
582010 or later
332000 to 2009
41990 to 1999
84Before 1990
Facilities with environmental interests located in this zip code:
FANNIN CO. HEAD START/FLAG PRG (WPCP FANNIN COUNTY in MINERAL BLUFF, GA)
National Pollutant Discharge Elimination System NON-MAJOR (Tracking pollutant discharge elimination systems) - permit Business SIC classification: ELEMENTARY AND SECONDARY SCHOOLS Organizations: FANNIN CO. BOARD OF EDUCATION (CONTACT/OWNER)
Alternative names: FANNIN CO HEAD START, MINERAL BLUFF ELEM SCH
RICE JERRY SAWMILL (OFF GA HWY 60 SOUTH in MINERAL BLUFF, GA)
AIR MINOR (AIRS/AFS) Business SIC classification: SAWMILLS AND PLANING MILLS, GENERAL
Housing units lacking complete plumbing facilities: 4.1% Housing units lacking complete kitchen facilities: 5.3%
53.6%Electricity
34.7%Bottled, tank, or LP gas
4.9%Wood
3.3%Utility gas
2.1%Fuel oil, kerosene, etc.
1.5%No fuel used
Population in 1990: 2,180. Population change in the 1990s: +1,325 (+60.8%).
Place of birth for U.S.-born residents:
This state: 2,435
Northeast: 401
Midwest: 578
South: 1,741
West: 170
63% of the 30559 zip code residents lived in the same house 5 years ago. Out of people who lived in different houses, 35% lived in this county. Out of people who lived in different counties, 50% lived in Georgia.
91% of the 30559 zip code residents lived in the same house 1 year ago. Out of people who lived in different houses, 6% moved from this county. Out of people who lived in different houses, 35% moved from different county within same state. Out of people who lived in different houses, 69% moved from different state.
Private vs. public school enrollment:
Students in private schools in grades 1 to 8 (elementary and middle school): 95
Here:
28.6%
Georgia:
12.1%
Students in private schools in grades 9 to 12 (high school): 44
Here:
15.1%
Georgia:
10.8%
Students in private undergraduate colleges:
Here:
0.0%
Georgia:
17.1%
Occupation by median earnings in the past 12 months ($)
79,324Health diagnosing and treating practitioners and other technical occupations
60,443Management occupations
57,363Installation, maintenance, and repair occupations
56,048Production occupations
51,251Construction and extraction occupations
46,721Office and administrative support occupations
Top industries in this zip code by the number of employees in 2005:
Educational Services: Elementary and Secondary Schools (20-49 employees: 1 establishment)
Construction: New Single-Family Housing Construction (except Operative Builders) (5-9: 1, 1-4: 7)
Construction: Plumbing, Heating, and Air-Conditioning Contractors (10-19: 1, 1-4: 2)
Information: Radio Networks (10-19: 1)
Wholesale Trade: Other Construction Material Merchant Wholesalers (5-9: 1)
Construction: Electrical Contractors (5-9: 1)
Other Services (except Public Administration): Religious Organizations (1-4: 2)
People in group quarters in 2000:
15 people in nursing homes
Fatal accident statistics in 2014:
Fatal accident count: 2
Vehicles involved in fatal accidents: 3
Fatal accidents caused by drunken drivers: 1
Fatalities: 2
Persons involved in fatal accidents: 3
Pedestrians involved in fatal accidents: 1
Fatal accident statistics in 2012:
Fatal accident count: 1
Vehicles involved in fatal accidents: 1
Fatal accidents caused by drunken drivers: 1
Fatalities: 1
Persons involved in fatal accidents: 2
Pedestrians involved in fatal accidents: 0
2003 - 2018 National Fire Incident Reporting System (NFIRS) incidents
Based on the data from the years 2003 - 2018 the average number of fires per year is 20. The highest number of reported fire incidents - 35 took place in 2016, and the least - 1 in 2005. The data has a dropping trend.
When looking into fire subcategories, the most reports belonged to: Outside Fires (48.4%), and Structure Fires (35.4%).
Fire incident types reported to NFIRS in Zip Code 30559


+$1,533
-$6,357
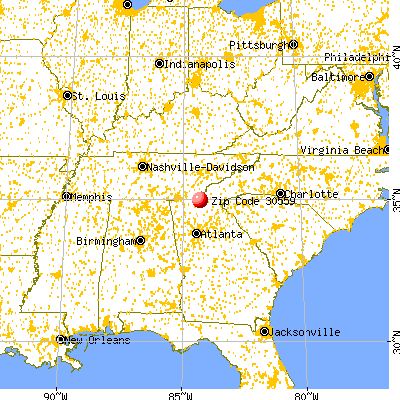
 Nearest zip codes: 30560, 37326, 30513, 37391, 30555, 30522.


 Based on the data from the years 2003 - 2018 the average number of fires per year is 20. The highest number of reported fire incidents - 35 took place in 2016, and the least - 1 in 2005. The data has a dropping trend.
 When looking into fire subcategories, the most reports belonged to: Outside Fires (48.4%), and Structure Fires (35.4%).