Estimated zip code population in 2022: 5,240 Zip code population in 2010: 4,125 Zip code population in 2000: 3,218
Houses and condos: 2,395 Renter-occupied apartments: 274
% of renters here:
13%
State:
28%
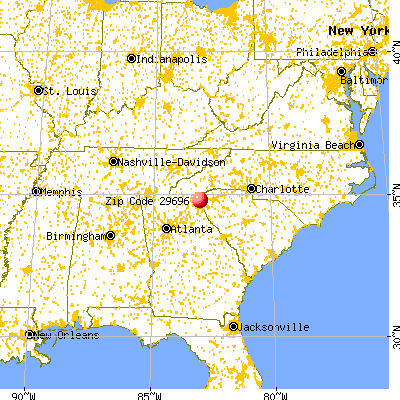
March 2022 cost of living index in zip code 29696: 79.9 (low, U.S. average is 100)
Land area: 23.2 sq. mi. Water area: 1.3 sq. mi.
Population density: 226 people per square mile
(very low).
OSM Map
General Map
Google Map
MSN Map
OSM Map
General Map
Google Map
MSN Map
OSM Map
General Map
Google Map
MSN Map
OSM Map
General Map
Google Map
MSN Map
Please wait while loading the map...
Real estate property taxes paid for housing units in 2022:
This zip code:
0.4% ($928)
South Carolina:
0.5% ($1,185)
Median real estate property taxes paid for housing units with mortgages in 2022: $1,186 (0.4%) Median real estate property taxes paid for housing units with no mortgage in 2022: $704 (0.4%)
Estimated median house/condo value in 2022: $231,048
29696:
$231,048
South Carolina:
$254,600
According to our research of South Carolina and other state lists, there was 1 registered sex offender living in 29696 zip code as of July 03, 2024. The ratio of all residents to sex offenders in zip code 29696 is 5,148 to 1. The ratio of registered sex offenders to all residents in this zip code is much lower than the state average.
Median resident age:
This zip code:
44.3 years
South Carolina median age:
40.5 years
Average household size:
This zip code:
2.4 people
South Carolina:
2.4 people
Averages for the 2020 tax year for zip code 29696, filed in 2021:
Average Adjusted Gross Income (AGI) in 2020: $67,212 (Individual Income Tax Returns)
Here:
$67,212
State:
$65,754
Salary/wage: $58,030 (reported on 80.1% of returns)
Here:
$58,030
State:
$52,566
(% of AGI for various income ranges: 1018.3% for AGIs below $25k, 3546.2% for AGIs $25k-50k, 5971.7% for AGIs $50k-75k, 8653.3% for AGIs $75k-100k, 17073.2% for AGIs $100k-200k, 87156.7% for AGIs over 200k)
Taxable interest for individuals: $1,380 (reported on 30.3% of returns)
This zip code:
$1,380
South Carolina:
$1,749
(% of AGI for various income ranges: 14.1% for AGIs below $25k, 14.7% for AGIs $25k-50k, 61.3% for AGIs $50k-75k, 55.3% for AGIs $75k-100k, 197.4% for AGIs $100k-200k, 730.0% for AGIs over 200k)
Ordinary dividends: $5,017 (reported on 18.2% of returns)
Here:
$5,017
State:
$8,783
(% of AGI for various income ranges: 22.4% for AGIs below $25k, 54.9% for AGIs $25k-50k, 85.4% for AGIs $50k-75k, 158.0% for AGIs $75k-100k, 353.2% for AGIs $100k-200k, 2086.7% for AGIs over 200k)
Net capital gain/loss in AGI: +$11,895 (reported on 16.9% of returns)
Here:
+$11,895
State:
+$24,194
(% of AGI for various income ranges: 39.3% for AGIs $25k-50k, 120.8% for AGIs $50k-75k, 274.7% for AGIs $75k-100k, 617.4% for AGIs $100k-200k, 8636.7% for AGIs over 200k)
Profit/loss from business: +$10,232 (reported on 14.7% of returns)
Here:
+$10,232
State:
+$11,253
(% of AGI for various income ranges: 139.4% for AGIs below $25k, 154.2% for AGIs $25k-50k, 180.0% for AGIs $50k-75k, 232.0% for AGIs $75k-100k, 658.9% for AGIs $100k-200k)
Taxable individual retirement arrangement distribution: $24,276 (reported on 12.6% of returns)
29696:
$24,276
South Carolina:
$21,604
(% of AGI for various income ranges: 56.1% for AGIs below $25k, 120.4% for AGIs $25k-50k, 381.2% for AGIs $50k-75k, 632.0% for AGIs $75k-100k, 1383.7% for AGIs $100k-200k, 5676.7% for AGIs over 200k)
Total itemized deductions: $34,200 (reported on 7.8% of returns)
Here:
$34,200
State:
$35,199
(% of AGI for various income ranges: 523.3% for AGIs $50k-75k, 1122.6% for AGIs $100k-200k, 9223.3% for AGIs over 200k)
Charity contributions: $13,507 (reported on 6.5% of returns)
Here:
$13,507
State:
$14,319
(% of AGI for various income ranges: 47.1% for AGIs $50k-75k, 365.3% for AGIs $100k-200k, 4063.3% for AGIs over 200k)
Taxes paid: $7,644 (reported on 7.8% of returns)
29696:
$7,644
State:
$7,486
(% of AGI for various income ranges: 93.3% for AGIs $50k-75k, 288.9% for AGIs $100k-200k, 2010.0% for AGIs over 200k)
Earned income credit: $2,284 (reported on 16.0% of returns)
Here:
$2,284
State:
$2,397
(% of AGI for various income ranges: 98.3% for AGIs below $25k, 69.8% for AGIs $25k-50k)
Percentage of individuals using paid preparers for their 2020 taxes: 94.8%
Here:
95%
State:
93%
(% for various income ranges: 94.4% for AGIs below $25k, 94.8% for AGIs $25k-50k, 94.1% for AGIs $50k-75k, 95.5% for AGIs $75k-100k, 94.3% for AGIs $100k-200k, 100.0% for AGIs over 200k)
Averages for the 2012 tax year for zip code 29696, filed in 2013:
Average Adjusted Gross Income (AGI) in 2012: $50,591 (Individual Income Tax Returns)
Here:
$50,591
State:
$51,133
Salary/wage: $43,965 (reported on 83.5% of returns)
Here:
$43,965
State:
$42,173
(% of AGI for various income ranges: 73.4% for AGIs below $25k, 75.7% for AGIs $25k-50k, 75.3% for AGIs $50k-75k, 76.8% for AGIs $75k-100k, 73.2% for AGIs $100k-200k, 55.0% for AGIs over 200k)
Taxable interest for individuals: $865 (reported on 37.1% of returns)
This zip code:
$865
South Carolina:
$1,468
(% of AGI for various income ranges: 1.1% for AGIs below $25k, 0.4% for AGIs $25k-50k, 0.8% for AGIs $50k-75k, 0.5% for AGIs $75k-100k, 0.7% for AGIs $100k-200k, 0.5% for AGIs over 200k)
Ordinary dividends: $3,535 (reported on 17.5% of returns)
Here:
$3,535
State:
$6,511
(% of AGI for various income ranges: 0.8% for AGIs below $25k, 0.9% for AGIs $25k-50k, 1.2% for AGIs $50k-75k, 1.2% for AGIs $75k-100k, 1.5% for AGIs $100k-200k, 1.5% for AGIs over 200k)
Net capital gain/loss in AGI: +$2,288 (reported on 13.4% of returns)
Here:
+$2,288
State:
+$13,061
(% of AGI for various income ranges: 0.6% for AGIs $50k-75k, 2.1% for AGIs $100k-200k)
Profit/loss from business: +$7,984 (reported on 12.9% of returns)
Here:
+$7,984
State:
+$10,167
(% of AGI for various income ranges: 6.2% for AGIs below $25k, 2.0% for AGIs $25k-50k, 2.0% for AGIs $50k-75k, 1.3% for AGIs $75k-100k, 2.0% for AGIs $100k-200k)
Taxable individual retirement arrangement distribution: $15,354 (reported on 12.4% of returns)
29696:
$15,354
South Carolina:
$17,019
(% of AGI for various income ranges: 2.9% for AGIs below $25k, 4.3% for AGIs $25k-50k, 4.8% for AGIs $50k-75k, 3.6% for AGIs $75k-100k, 4.7% for AGIs $100k-200k)
Total itemized deductions: $20,592 (22% of AGI, reported on 30.9% of returns)
Here:
$20,592
State:
$22,890
Here:
22.1% of AGI
State:
21.4% of AGI
(% of AGI for various income ranges: 8.4% for AGIs below $25k, 8.8% for AGIs $25k-50k, 11.8% for AGIs $50k-75k, 15.3% for AGIs $75k-100k, 15.7% for AGIs $100k-200k, 12.3% for AGIs over 200k)
Charity contributions: $4,869 (reported on 26.3% of returns)
Here:
$4,869
State:
$5,169
(% of AGI for various income ranges: 0.9% for AGIs below $25k, 1.2% for AGIs $25k-50k, 2.0% for AGIs $50k-75k, 3.4% for AGIs $75k-100k, 3.7% for AGIs $100k-200k, 2.8% for AGIs over 200k)
Taxes paid: $6,668 (reported on 30.4% of returns)
29696:
$6,668
State:
$7,644
(% of AGI for various income ranges: 1.1% for AGIs below $25k, 1.7% for AGIs $25k-50k, 3.3% for AGIs $50k-75k, 4.8% for AGIs $75k-100k, 5.8% for AGIs $100k-200k, 6.1% for AGIs over 200k)
Earned income credit: $2,056 (reported on 18.6% of returns)
Here:
$2,056
State:
$2,418
(% of AGI for various income ranges: 5.7% for AGIs below $25k, 1.3% for AGIs $25k-50k)
Percentage of individuals using paid preparers for their 2012 taxes: 69.1%
Here:
69%
State:
57%
(% for various income ranges: 62.5% for AGIs below $25k, 75.0% for AGIs $25k-50k, 71.4% for AGIs $50k-75k, 68.4% for AGIs $75k-100k, 70.0% for AGIs $100k-200k, 100.0% for AGIs over 200k)
Averages for the 2004 tax year for zip code 29696, filed in 2005:
Average Adjusted Gross Income (AGI) in 2004: $39,386 (Individual Income Tax Returns)
Here:
$39,386
State:
$41,965
Salary/wage: $35,000 (reported on 88.0% of returns)
Here:
$35,000
State:
$35,695
(% of AGI for various income ranges: 97.3% for AGIs below $10k, 77.7% for AGIs $10k-25k, 82.9% for AGIs $25k-50k, 83.4% for AGIs $50k-75k, 85.6% for AGIs $75k-100k, 63.1% for AGIs over 100k)
Taxable interest for individuals: $1,011 (reported on 42.6% of returns)
This zip code:
$1,011
South Carolina:
$1,623
(% of AGI for various income ranges: 4.8% for AGIs below $10k, 2.6% for AGIs $10k-25k, 1.3% for AGIs $25k-50k, 0.6% for AGIs $50k-75k, 0.3% for AGIs $75k-100k, 0.8% for AGIs over 100k)
Taxable dividends: $2,153 (reported on 16.5% of returns)
Here:
$2,153
State:
$3,999
(% of AGI for various income ranges: 2.1% for AGIs below $10k, 0.7% for AGIs $10k-25k, 0.9% for AGIs $25k-50k, 1.1% for AGIs $50k-75k, 0.4% for AGIs $75k-100k, 1.1% for AGIs over 100k)
Net capital gain/loss: +$7,269 (reported on 13.6% of returns)
Here:
+$7,269
State:
+$13,100
(% of AGI for various income ranges: -1.4% for AGIs below $10k, -0.2% for AGIs $10k-25k, 0.5% for AGIs $25k-50k, -0.1% for AGIs $50k-75k, 0.1% for AGIs $75k-100k, 10.0% for AGIs over 100k)
Profit/loss from business: +$8,083 (reported on 12.8% of returns)
Here:
+$8,083
State:
+$9,144
(% of AGI for various income ranges: 6.3% for AGIs below $10k, 4.2% for AGIs $10k-25k, 2.2% for AGIs $25k-50k, 1.3% for AGIs $50k-75k, 0.3% for AGIs $75k-100k, 4.6% for AGIs over 100k)
IRA payment deduction: $2,867 (reported on 1.7% of returns)
29696:
$2,867
South Carolina:
$2,972
Total itemized deductions: $17,111 (22% of AGI, reported on 28.4% of returns)
Here:
$17,111
State:
$19,039
Here:
22.1% of AGI
State:
22.8% of AGI
(% of AGI for various income ranges: 5.5% for AGIs $10k-25k, 10.4% for AGIs $25k-50k, 13.7% for AGIs $50k-75k, 15.7% for AGIs $75k-100k, 15.3% for AGIs over 100k)
Charity contributions deductions: $4,113 (5% of AGI, reported on 23.9% of returns)
Here:
$4,113
State:
$4,305
Here:
5.0% of AGI
State:
5.0% of AGI
(% of AGI for various income ranges: 0.9% for AGIs $10k-25k, 1.6% for AGIs $25k-50k, 2.6% for AGIs $50k-75k, 3.0% for AGIs $75k-100k, 3.9% for AGIs over 100k)
Total tax: $4,992 (reported on 73.6% of returns)
29696:
$4,992
State:
$6,497
(% of AGI for various income ranges: 2.7% for AGIs below $10k, 4.2% for AGIs $10k-25k, 6.2% for AGIs $25k-50k, 8.5% for AGIs $50k-75k, 9.4% for AGIs $75k-100k, 16.1% for AGIs over 100k)
Earned income credit: $1,656 (reported on 16.8% of returns)
Here:
$1,656
State:
$1,882
Percentage of individuals using paid preparers for their 2004 taxes: 72.2%
Here:
72%
State:
66%
(% for various income ranges: 63.2% for AGIs below $10k, 74.9% for AGIs $10k-25k, 74.5% for AGIs $25k-50k, 75.4% for AGIs $50k-75k, 70.2% for AGIs $75k-100k, 74.1% for AGIs over 100k)
Likely homosexual households (counted as self-reported same-sex unmarried-partner households)
Lesbian couples: 0.1% of all households
Gay men: 0.0% of all households
Household received Food Stamps/SNAP in the past 12 months: 99 Household did not receive Food Stamps/SNAP in the past 12 months: 2,055
Women who had a birth in the past 12 months: 29 (31 now married, 0 unmarried) Women who did not have a birth in the past 12 months: 902 (565 now married, 343 unmarried)
Housing units in zip code 29696 with a mortgage: 1,056 (75 second mortgage, 69 both second mortgage and home equity loan) Houses without a mortgage: 133
Median monthly owner costs for units with a mortgage: $1,430 Median monthly owner costs for units without a mortgage: $334
Residents with income below the poverty level in 2022:
This zip code:
7.7%
Whole state:
14.0%
Residents with income below 50% of the poverty level in 2022:
This zip code:
4.1%
Whole state:
7.3%
Median number of rooms in houses and condos:
Here:
6.5
State:
6.4
Median number of rooms in apartments:
Here:
4.1
State:
4.5
Notable locations in this zip code not listed on our city pages
Churches in zip code 29696 include: Fairview Church (A), Ebenezer Baptist Church (B), Calvary Church (C), Mountain Spring Church (D). Display/hide their locations on the map
Streams, rivers, and creeks: Yarborough Branch (A), Little Cane Creek (B), Dodgens Creek (C), Camp Bottom Branch (D), Beaty Creek (E), Beaman Branch (F). Display/hide their locations on the map
In group quarters: 11 (-1 institutionalized population)
Size of family households: 843 2-persons, 550 3-persons, 252 4-persons, 49 5-persons, 9 6-persons, 30 7-or-more-persons
Size of nonfamily households: 344 1-person, 82 2-persons
978 married couples with children.
235 single-parent households (84 men, 151 women).
95.3% of residents of 29696 zip code speak English at home.
3.4% of residents speak Spanish at home (65% very well, 10% well, 21% not well, 4% not at all).
1.7% of residents speak other Indo-European language at home (100% very well).
Foreign born population: 191 (3.6%) (34.4% of them are naturalized citizens)
This zip code:
3.6%
Whole state:
5.2%
29%Belgium
12%Costa Rica
12%Honduras
10%Romania
4%Colombia
4%Barbados
3%Scotland
29%American
22%English
9%Irish
8%Scotch-Irish
6%German
4%French
3%Italian
Year of entry for the foreign-born population
422010 or later
1022000 to 2009
321990 to 1999
50Before 1990
Facilities with environmental interests located in this zip code:
BOBBY WOOD CHEVROLET PONTIAC INC (3449 BLUE RIDGE BLVD in WEST UNION, SC)
Conditionally Exempt Small Quantity Generators, less than 100 kg/month of hazardous waste (Resource Conservation and Recovery Act (tracking hazardous waste)) STATE MASTER (South Carolina database) - HAZARDOUS WASTE PROGRAM Organizations: BOBBY H WOOD (CONTACT/OPERATOR)
BOBBY WOOD CHEV PONT INC (3504 BLUE RIDGE BLVD in WEST UNION, SC)
Small Quantity Generators, between 100 kg and 1000 kg of hazardous waste/month (Resource Conservation and Recovery Act (tracking hazardous waste)) - notification Business NAICS classification: AUTOMOTIVE BODY, PAINT, AND INTERIOR REPAIR AND MAINTENANCE. Organizations: OPERNAME (CONTACT/OPERATOR)
, BOBBY H WOOD (CONTACT/OWNER)
Housing units lacking complete plumbing facilities: 1.6% Housing units lacking complete kitchen facilities: 4.1%
72.3%Electricity
15.5%Utility gas
9.2%Bottled, tank, or LP gas
1.7%Wood
0.8%No fuel used
0.7%Fuel oil, kerosene, etc.
Population in 1990: 170. Population change in the 1990s: +3,048 (+1792.9%).
Place of birth for U.S.-born residents:
This state: 3,270
Northeast: 331
Midwest: 333
South: 876
West: 170
65% of the 29696 zip code residents lived in the same house 5 years ago. Out of people who lived in different houses, 65% lived in this county. Out of people who lived in different counties, 50% lived in South Carolina.
90% of the 29696 zip code residents lived in the same house 1 year ago. Out of people who lived in different houses, 32% moved from this county. Out of people who lived in different houses, 29% moved from different county within same state. Out of people who lived in different houses, 39% moved from different state. Out of people who lived in different houses, 2% moved from abroad.
Private vs. public school enrollment:
Students in private schools in grades 1 to 8 (elementary and middle school): 111
Here:
15.8%
South Carolina:
14.4%
Students in private schools in grades 9 to 12 (high school):
Here:
0.0%
South Carolina:
11.1%
Students in private undergraduate colleges: 16
Here:
29.1%
South Carolina:
21.9%
Occupation by median earnings in the past 12 months ($)
112,827Architecture and engineering occupations
83,351Fire fighting and prevention, and other protective service workers including supervisors
74,028Management occupations
71,561Business and financial operations occupations
59,658Education, training, and library occupations
55,304Construction and extraction occupations
Top industries in this zip code by the number of employees in 2005:
Health Care and Social Assistance: Offices of Dentists (20-49: 1, 10-19: 1)
Professional, Scientific, and Technical Services: Other Accounting Services (20-49: 1)
Professional, Scientific, and Technical Services: Veterinary Services (20-49: 1)
People in group quarters in 2010:
4 people in nursing facilities/skilled-nursing facilities
People in group quarters in 2000:
55 people in other nonhousehold living situations
Fatal accident statistics in 2011:
Fatal accident count: 2
Vehicles involved in fatal accidents: 3
Fatal accidents caused by drunken drivers: 1
Fatalities: 2
Persons involved in fatal accidents: 3
Pedestrians involved in fatal accidents: 0
2002 - 2018 National Fire Incident Reporting System (NFIRS) incidents
Based on the data from the years 2002 - 2018 the average number of fire incidents per year is 31. The highest number of reported fire incidents - 51 took place in 2008, and the least - 11 in 2003. The data has an increasing trend.
When looking into fire subcategories, the most reports belonged to: Outside Fires (44.4%), and Structure Fires (40.3%).
Fire incident types reported to NFIRS in Zip Code 29696


 Nearest zip codes: 29691, 29672, 29665, 29682, 29678, 29664.


 Based on the data from the years 2002 - 2018 the average number of fire incidents per year is 31. The highest number of reported fire incidents - 51 took place in 2008, and the least - 11 in 2003. The data has an increasing trend.
 When looking into fire subcategories, the most reports belonged to: Outside Fires (44.4%), and Structure Fires (40.3%).