Estimated zip code population in 2022: 1,347 Zip code population in 2010: 1,254 Zip code population in 2000: 1,138
Houses and condos: 879 Renter-occupied apartments: 30
% of renters here:
6%
State:
28%
March 2022 cost of living index in zip code 29635: 78.9 (low, U.S. average is 100)
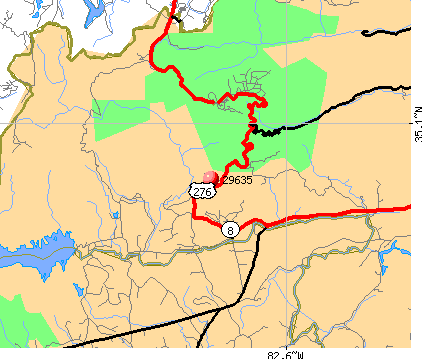
Land area: 69.2 sq. mi. Water area: 0.9 sq. mi.
Population density: 19 people per square mile
(very low).
OSM Map
General Map
Google Map
MSN Map
OSM Map
General Map
Google Map
MSN Map
OSM Map
General Map
Google Map
MSN Map
OSM Map
General Map
Google Map
MSN Map
Please wait while loading the map...
Real estate property taxes paid for housing units in 2022:
This zip code:
0.4% ($815)
South Carolina:
0.5% ($1,185)
Median real estate property taxes paid for housing units with mortgages in 2022: $1,178 (0.6%) Median real estate property taxes paid for housing units with no mortgage in 2022: $736 (0.3%)
Business Search- 14 Million verified businesses
Males: 603
(44.7%)
Females: 744
(55.3%)
For population 25 years and over in 29635:
High school or higher: 91.9%
Bachelor's degree or higher: 22.1%
Graduate or professional degree: 12.8%
Unemployed: 1.4%
Mean travel time to work (commute): 36.7 minutes
For population 15 years and over in 29635:
Never married: 20.0%
Now married: 65.8%
Separated: 1.3%
Widowed: 7.0%
Divorced: 5.9%
Zip code 29635 compared to state average:
Unemployed percentage significantly below state average.
Black race population percentage significantly below state average.
Hispanic race population percentage significantly below state average.
Median age significantly above state average.
Foreign-born population percentage significantly below state average.
Renting percentage significantly below state average.
Length of stay since moving in significantly above state average.
Estimated median house/condo value in 2022: $217,505
29635:
$217,505
South Carolina:
$254,600
Median resident age:
This zip code:
54.4 years
South Carolina median age:
40.5 years
Average household size:
This zip code:
2.9 people
South Carolina:
2.4 people
Averages for the 2020 tax year for zip code 29635, filed in 2021:
Average Adjusted Gross Income (AGI) in 2020: $66,596 (Individual Income Tax Returns)
Here:
$66,596
State:
$65,754
Salary/wage: $52,840 (reported on 73.5% of returns)
Here:
$52,840
State:
$52,566
(% of AGI for various income ranges: 1041.3% for AGIs below $25k, 3379.2% for AGIs $25k-50k, 6606.7% for AGIs $50k-75k, 8555.0% for AGIs $75k-100k, 13091.7% for AGIs $100k-200k)
Taxable interest for individuals: $700 (reported on 32.4% of returns)
This zip code:
$700
South Carolina:
$1,749
(% of AGI for various income ranges: 7.3% for AGIs below $25k, 15.8% for AGIs $25k-50k, 60.0% for AGIs $50k-75k, 50.0% for AGIs $75k-100k, 63.3% for AGIs $100k-200k)
Ordinary dividends: $4,462 (reported on 23.5% of returns)
Here:
$4,462
State:
$8,783
(% of AGI for various income ranges: 46.0% for AGIs below $25k, 90.0% for AGIs $25k-50k, 327.5% for AGIs $75k-100k, 676.7% for AGIs $100k-200k)
Net capital gain/loss in AGI: +$10,840 (reported on 22.1% of returns)
Here:
+$10,840
State:
+$24,194
(% of AGI for various income ranges: 11.3% for AGIs below $25k, 60.0% for AGIs $25k-50k, 740.0% for AGIs $75k-100k, 2068.3% for AGIs $100k-200k)
Profit/loss from business: +$4,514 (reported on 20.6% of returns)
Here:
+$4,514
State:
+$11,253
(% of AGI for various income ranges: 77.3% for AGIs below $25k, 244.2% for AGIs $25k-50k, 143.3% for AGIs $50k-75k, 228.3% for AGIs $100k-200k)
Taxable individual retirement arrangement distribution: $27,636 (reported on 16.2% of returns)
29635:
$27,636
South Carolina:
$21,604
(% of AGI for various income ranges: 175.3% for AGIs below $25k, 1013.3% for AGIs $50k-75k, 3615.0% for AGIs $100k-200k)
Total itemized deductions: $36,220 (reported on 7.4% of returns)
Here:
$36,220
State:
$35,199
(% of AGI for various income ranges: 3018.3% for AGIs $100k-200k)
Charity contributions: $16,600 (reported on 4.4% of returns)
Here:
$16,600
State:
$14,319
(% of AGI for various income ranges: 830.0% for AGIs $100k-200k)
Taxes paid: $7,180 (reported on 7.4% of returns)
29635:
$7,180
State:
$7,486
(% of AGI for various income ranges: 598.3% for AGIs $100k-200k)
Earned income credit: $1,925 (reported on 11.8% of returns)
Here:
$1,925
State:
$2,397
(% of AGI for various income ranges: 50.0% for AGIs below $25k, 65.8% for AGIs $25k-50k)
Percentage of individuals using paid preparers for their 2020 taxes: 97.1%
Here:
97%
State:
93%
(% for various income ranges: 95.2% for AGIs below $25k, 93.8% for AGIs $25k-50k, 100.0% for AGIs $50k-75k, 100.0% for AGIs $75k-100k, 100.0% for AGIs $100k-200k, 100.0% for AGIs over 200k)
Averages for the 2012 tax year for zip code 29635, filed in 2013:
Average Adjusted Gross Income (AGI) in 2012: $49,786 (Individual Income Tax Returns)
Here:
$49,786
State:
$51,133
Salary/wage: $42,827 (reported on 80.4% of returns)
Here:
$42,827
State:
$42,173
(% of AGI for various income ranges: 73.5% for AGIs below $25k, 73.8% for AGIs $25k-50k, 68.2% for AGIs $50k-75k, 66.8% for AGIs $75k-100k, 67.2% for AGIs $100k-200k)
Taxable interest for individuals: $678 (reported on 32.1% of returns)
This zip code:
$678
South Carolina:
$1,468
(% of AGI for various income ranges: 0.6% for AGIs below $25k, 0.3% for AGIs $25k-50k, 0.2% for AGIs $50k-75k, 0.8% for AGIs $75k-100k, 0.4% for AGIs $100k-200k)
Ordinary dividends: $2,392 (reported on 21.4% of returns)
Here:
$2,392
State:
$6,511
(% of AGI for various income ranges: 2.2% for AGIs below $25k, 0.6% for AGIs $25k-50k, 1.3% for AGIs $50k-75k, 1.1% for AGIs $75k-100k, 0.8% for AGIs $100k-200k)
Profit/loss from business: +$8,690 (reported on 17.9% of returns)
Here:
+$8,690
State:
+$10,167
(% of AGI for various income ranges: 7.7% for AGIs below $25k, 2.9% for AGIs $25k-50k, 1.1% for AGIs $50k-75k, 9.0% for AGIs $75k-100k)
Taxable individual retirement arrangement distribution: $14,638 (reported on 14.3% of returns)
29635:
$14,638
South Carolina:
$17,019
(% of AGI for various income ranges: 10.1% for AGIs below $25k, 7.7% for AGIs $50k-75k, 10.1% for AGIs $75k-100k)
Total itemized deductions: $19,316 (24% of AGI, reported on 33.9% of returns)
Here:
$19,316
State:
$22,890
Here:
23.6% of AGI
State:
21.4% of AGI
(% of AGI for various income ranges: 12.2% for AGIs $25k-50k, 13.9% for AGIs $50k-75k, 13.7% for AGIs $75k-100k, 16.3% for AGIs $100k-200k)
Charity contributions: $4,847 (reported on 26.8% of returns)
Here:
$4,847
State:
$5,169
(% of AGI for various income ranges: 2.2% for AGIs $25k-50k, 2.0% for AGIs $50k-75k, 2.9% for AGIs $75k-100k, 3.6% for AGIs $100k-200k)
Taxes paid: $5,721 (reported on 33.9% of returns)
29635:
$5,721
State:
$7,644
(% of AGI for various income ranges: 2.3% for AGIs $25k-50k, 3.0% for AGIs $50k-75k, 4.1% for AGIs $75k-100k, 6.1% for AGIs $100k-200k)
Earned income credit: $2,133 (reported on 21.4% of returns)
Here:
$2,133
State:
$2,418
(% of AGI for various income ranges: 7.3% for AGIs below $25k, 1.4% for AGIs $25k-50k)
Percentage of individuals using paid preparers for their 2012 taxes: 64.3%
Here:
64%
State:
57%
(% for various income ranges: 60.0% for AGIs below $25k, 60.0% for AGIs $25k-50k, 75.0% for AGIs $50k-75k, 66.7% for AGIs $75k-100k, 71.4% for AGIs $100k-200k)
Averages for the 2004 tax year for zip code 29635, filed in 2005:
Average Adjusted Gross Income (AGI) in 2004: $40,266 (Individual Income Tax Returns)
Here:
$40,266
State:
$41,965
Salary/wage: $35,360 (reported on 84.1% of returns)
Here:
$35,360
State:
$35,695
(% of AGI for various income ranges: 76.9% for AGIs below $10k, 77.1% for AGIs $10k-25k, 77.1% for AGIs $25k-50k, 80.3% for AGIs $50k-75k, 73.6% for AGIs $75k-100k, 64.7% for AGIs over 100k)
Taxable interest for individuals: $797 (reported on 38.4% of returns)
This zip code:
$797
South Carolina:
$1,623
(% of AGI for various income ranges: 2.6% for AGIs below $10k, 0.8% for AGIs $10k-25k, 0.7% for AGIs $25k-50k, 0.4% for AGIs $50k-75k, 0.7% for AGIs $75k-100k, 1.0% for AGIs over 100k)
Taxable dividends: $1,718 (reported on 20.2% of returns)
Here:
$1,718
State:
$3,999
(% of AGI for various income ranges: 3.8% for AGIs below $10k, 0.4% for AGIs $10k-25k, 0.5% for AGIs $25k-50k, 0.8% for AGIs $50k-75k, 0.3% for AGIs $75k-100k, 1.4% for AGIs over 100k)
Net capital gain/loss: +$5,151 (reported on 14.9% of returns)
Here:
+$5,151
State:
+$13,100
(% of AGI for various income ranges: -5.5% for AGIs below $10k, -0.1% for AGIs $25k-50k, 0.7% for AGIs $50k-75k, 6.8% for AGIs over 100k)
Profit/loss from business: +$8,961 (reported on 17.6% of returns)
Here:
+$8,961
State:
+$9,144
(% of AGI for various income ranges: 8.9% for AGIs below $10k, 4.9% for AGIs $10k-25k, 3.0% for AGIs $25k-50k, 3.1% for AGIs $50k-75k, 6.5% for AGIs over 100k)
Total itemized deductions: $18,430 (25% of AGI, reported on 29.8% of returns)
Here:
$18,430
State:
$19,039
Here:
24.6% of AGI
State:
22.8% of AGI
(% of AGI for various income ranges: 8.1% for AGIs $10k-25k, 10.9% for AGIs $25k-50k, 15.6% for AGIs $50k-75k, 17.0% for AGIs $75k-100k, 16.2% for AGIs over 100k)
Charity contributions deductions: $4,365 (6% of AGI, reported on 25.6% of returns)
Here:
$4,365
State:
$4,305
Here:
5.6% of AGI
State:
5.0% of AGI
(% of AGI for various income ranges: 1.0% for AGIs $10k-25k, 1.8% for AGIs $25k-50k, 3.0% for AGIs $50k-75k, 3.0% for AGIs $75k-100k, 4.3% for AGIs over 100k)
Total tax: $5,144 (reported on 74.4% of returns)
29635:
$5,144
State:
$6,497
(% of AGI for various income ranges: 2.6% for AGIs below $10k, 4.0% for AGIs $10k-25k, 5.9% for AGIs $25k-50k, 8.1% for AGIs $50k-75k, 10.6% for AGIs $75k-100k, 15.9% for AGIs over 100k)
Earned income credit: $1,591 (reported on 19.0% of returns)
Here:
$1,591
State:
$1,882
Percentage of individuals using paid preparers for their 2004 taxes: 62.3%
Here:
62%
State:
66%
(% for various income ranges: 52.8% for AGIs below $10k, 62.2% for AGIs $10k-25k, 68.2% for AGIs $25k-50k, 61.7% for AGIs $50k-75k, 73.0% for AGIs $75k-100k, 57.8% for AGIs over 100k)
Household received Food Stamps/SNAP in the past 12 months: 52 Household did not receive Food Stamps/SNAP in the past 12 months: 418
Women who had a birth in the past 12 months: 4 (4 now married, 0 unmarried) Women who did not have a birth in the past 12 months: 182 (56 now married, 125 unmarried)
Housing units in zip code 29635 with a mortgage: 210 (16 second mortgage, 13 both second mortgage and home equity loan) Median monthly owner costs for units with a mortgage: $1,250 Median monthly owner costs for units without a mortgage: $335
Residents with income below the poverty level in 2022:
This zip code:
2.9%
Whole state:
14.0%
Residents with income below 50% of the poverty level in 2022:
This zip code:
1.7%
Whole state:
7.3%
Median number of rooms in houses and condos:
Here:
6.0
State:
6.4
Median number of rooms in apartments:
Here:
5.3
State:
4.5
Notable locations in this zip code not listed on our city pages
Notable locations in zip code 29635: Camp Greenville (A), Camp Parker (B), Civitan Camp (C), River Falls Fire Department Bald Rock Highway 276 (D). Display/hide their locations on the map
Reservoirs: Lake Rotary (A), Tall Pine Lakes (B), Lake Sudy (C), Pinnacle Lake (D), Garren Lake (E), Rice Pond (F), Lawton Lake (G), Methodist Pond (H). Display/hide their locations on the map
Streams, rivers, and creeks: Duck Creek (A), Sunfish Creek (B), Slicking Creek (C), Rock Laurel Branch (D), Robinson Branch (E), Wattacoo Creek (F), Little Table Rock Creek (G), Julian Creek (H), Grissom Branch (I). Display/hide their locations on the map
Size of family households: 153 2-persons, 73 3-persons, 21 4-persons, 89 5-persons, 4 6-persons, 10 7-or-more-persons
Size of nonfamily households: 102 1-person, 14 2-persons
65 married couples with children.
40 single-parent households (5 men, 35 women).
99.9% of residents of 29635 zip code speak English at home.
0.7% of residents speak other Indo-European language at home (100% well).
Foreign born population: 27 (2.0%) (51.9% of them are naturalized citizens)
This zip code:
2.0%
Whole state:
5.2%
59%France
37%Serbia
19%Sweden
19%United Kingdom, excluding England and Scotland
29%English
28%Irish
15%German
15%American
6%Finnish
5%Scotch-Irish
4%Ukrainian
Year of entry for the foreign-born population
02010 or later
72000 to 2009
51990 to 1999
17Before 1990
Facilities with environmental interests located in this zip code:
ASBURY HILLS UNITED METHODIST (150 ASBURY DR in CLEVELAND, SC)
National Pollutant Discharge Elimination System NON-MAJOR (Tracking pollutant discharge elimination systems) - permit STATE MASTER (South Carolina database) - National Pollutant Discharge Elimination System Permit, LABORATORY CERTIFICATION, DRINKING WATER SYSTEM STATE MASTER (South Carolina database) - DAM SITE Business SIC classification: SPORTING AND RECREATIONAL CAMPS Organizations: ASBURY HILLS CAMP & RETREAT (CONTACT/OWNER)
Alternative names: ASBURY HILL CAMP, ASBURY HILLS CAMP & RETREAT, ASBURY HILLS UM CAMP, METH CHURCH SC CONF
Housing units lacking complete plumbing facilities: 2.6% Housing units lacking complete kitchen facilities: 1.4%
65.7%Electricity
27.2%Bottled, tank, or LP gas
7.0%Wood
Population in 1990: 960. Population change in the 1990s: +178 (+18.5%).
Place of birth for U.S.-born residents:
This state: 726
Northeast: 123
Midwest: 206
South: 235
West: 24
51% of the 29635 zip code residents lived in the same house 5 years ago. Out of people who lived in different houses, 40% lived in this county. Out of people who lived in different counties, 50% lived in South Carolina.
92% of the 29635 zip code residents lived in the same house 1 year ago. Out of people who lived in different houses, 24% moved from this county. Out of people who lived in different houses, 47% moved from different county within same state. Out of people who lived in different houses, 29% moved from different state.
Private vs. public school enrollment:
Students in private schools in grades 1 to 8 (elementary and middle school):
Here:
0.0%
South Carolina:
14.4%
Students in private schools in grades 9 to 12 (high school):
Here:
0.0%
South Carolina:
11.1%
Students in private undergraduate colleges: 14
Here:
46.2%
South Carolina:
21.9%
Occupation by median earnings in the past 12 months ($)
94,964Management occupations
39,479Office and administrative support occupations
34,445Material moving occupations
31,102Community and social service occupations
23,237Sales and related occupations
21,378Production occupations
Top industries in this zip code by the number of employees in 2005:
Other Services (except Public Administration): Religious Organizations (5-9 employees: 1 establishment)
Accommodation and Food Services: Snack and Nonalcoholic Beverage Bars (1-4: 1)
Construction: Tile and Terrazzo Contractors (1-4: 1)
Health Care and Social Assistance: Other Individual and Family Services (1-4: 1)
Other Services (except Public Administration): Other Similar Organizations (except Business, Professional, Labor, and Political Organizations) (1-4: 1)
Construction: New Single-Family Housing Construction (except Operative Builders) (1-4: 1)
Fatal accident statistics in 2014:
Fatal accident count: 1
Vehicles involved in fatal accidents: 1
Fatal accidents caused by drunken drivers: 0
Fatalities: 1
Persons involved in fatal accidents: 1
Pedestrians involved in fatal accidents: 0
Fatal accident statistics in 2013:
Fatal accident count: 1
Vehicles involved in fatal accidents: 1
Fatal accidents caused by drunken drivers: 1
Fatalities: 1
Persons involved in fatal accidents: 1
Pedestrians involved in fatal accidents: 0
Home Mortgage Disclosure Act Aggregated Statistics For Year 2009 (Based on 2 partial tracts)
A) FHA, FSA/RHS & VA Home Purchase Loans
B) Conventional Home Purchase Loans
C) Refinancings
D) Home Improvement Loans
F) Non-occupant Loans on < 5 Family Dwellings (A B C & D)
G) Loans On Manufactured Home Dwelling (A B C & D)
Number
Average Value
Number
Average Value
Number
Average Value
Number
Average Value
Number
Average Value
Number
Average Value
LOANS ORIGINATED
12
$106,372
21
$189,310
63
$213,397
4
$477,395
22
$270,709
5
$73,564
APPLICATIONS APPROVED, NOT ACCEPTED
1
$120,470
5
$158,406
5
$282,208
0
$0
3
$187,967
3
$15,807
APPLICATIONS DENIED
4
$83,305
4
$279,390
47
$145,475
5
$83,560
9
$186,117
6
$60,235
APPLICATIONS WITHDRAWN
1
$120,470
5
$269,136
21
$230,993
0
$0
5
$260,422
1
$119,190
FILES CLOSED FOR INCOMPLETENESS
0
$0
0
$0
5
$162,250
1
$25,630
0
$0
1
$134,570
Aggregated Statistics For Year 2008 (Based on 2 partial tracts)
A) FHA, FSA/RHS & VA Home Purchase Loans
B) Conventional Home Purchase Loans
C) Refinancings
D) Home Improvement Loans
F) Non-occupant Loans on < 5 Family Dwellings (A B C & D)
G) Loans On Manufactured Home Dwelling (A B C & D)
Number
Average Value
Number
Average Value
Number
Average Value
Number
Average Value
Number
Average Value
Number
Average Value
LOANS ORIGINATED
14
$90,719
32
$205,096
59
$166,282
8
$52,065
24
$298,720
10
$63,824
APPLICATIONS APPROVED, NOT ACCEPTED
0
$0
0
$0
10
$220,307
4
$60,235
1
$137,130
1
$82,020
APPLICATIONS DENIED
4
$59,595
10
$460,607
53
$93,847
3
$7,690
6
$155,287
8
$60,555
APPLICATIONS WITHDRAWN
0
$0
6
$128,373
21
$172,833
1
$89,710
6
$349,450
1
$120,470
FILES CLOSED FOR INCOMPLETENESS
0
$0
0
$0
4
$131,685
0
$0
0
$0
0
$0
Aggregated Statistics For Year 2007 (Based on 2 partial tracts)
A) FHA, FSA/RHS & VA Home Purchase Loans
B) Conventional Home Purchase Loans
C) Refinancings
D) Home Improvement Loans
F) Non-occupant Loans on < 5 Family Dwellings (A B C & D)
G) Loans On Manufactured Home Dwelling (A B C & D)
Number
Average Value
Number
Average Value
Number
Average Value
Number
Average Value
Number
Average Value
Number
Average Value
LOANS ORIGINATED
4
$103,490
54
$208,877
76
$136,254
9
$66,216
28
$343,377
13
$62,700
APPLICATIONS APPROVED, NOT ACCEPTED
1
$103,810
5
$114,832
23
$93,613
1
$12,820
1
$48,700
3
$60,237
APPLICATIONS DENIED
1
$66,640
10
$119,061
53
$127,386
18
$61,588
6
$114,917
10
$59,466
APPLICATIONS WITHDRAWN
0
$0
3
$181,560
32
$104,531
5
$103,040
0
$0
5
$62,286
FILES CLOSED FOR INCOMPLETENESS
0
$0
4
$232,930
8
$143,860
0
$0
1
$358,850
0
$0
Aggregated Statistics For Year 2006 (Based on 2 partial tracts)
A) FHA, FSA/RHS & VA Home Purchase Loans
B) Conventional Home Purchase Loans
C) Refinancings
D) Home Improvement Loans
E) Loans on Dwellings For 5+ Families
F) Non-occupant Loans on < 5 Family Dwellings (A B C & D)
G) Loans On Manufactured Home Dwelling (A B C & D)
Number
Average Value
Number
Average Value
Number
Average Value
Number
Average Value
Number
Average Value
Number
Average Value
Number
Average Value
LOANS ORIGINATED
4
$97,402
59
$113,215
81
$112,180
13
$20,604
1
$196,080
33
$122,956
17
$37,317
APPLICATIONS APPROVED, NOT ACCEPTED
0
$0
6
$91,420
10
$103,681
1
$19,220
0
$0
0
$0
0
$0
APPLICATIONS DENIED
1
$74,330
31
$100,461
101
$91,895
18
$65,647
0
$0
8
$112,300
33
$66,255
APPLICATIONS WITHDRAWN
0
$0
13
$97,895
21
$73,661
3
$59,807
0
$0
5
$106,886
1
$64,080
FILES CLOSED FOR INCOMPLETENESS
0
$0
3
$97,830
8
$164,365
1
$115,340
0
$0
0
$0
0
$0
Aggregated Statistics For Year 2005 (Based on 2 partial tracts)
A) FHA, FSA/RHS & VA Home Purchase Loans
B) Conventional Home Purchase Loans
C) Refinancings
D) Home Improvement Loans
F) Non-occupant Loans on < 5 Family Dwellings (A B C & D)
G) Loans On Manufactured Home Dwelling (A B C & D)
Number
Average Value
Number
Average Value
Number
Average Value
Number
Average Value
Number
Average Value
Number
Average Value
LOANS ORIGINATED
1
$84,590
74
$106,390
76
$137,890
15
$34,774
29
$200,548
13
$74,925
APPLICATIONS APPROVED, NOT ACCEPTED
0
$0
14
$116,991
15
$90,737
0
$0
3
$198,647
1
$71,770
APPLICATIONS DENIED
3
$65,790
49
$74,804
69
$87,409
21
$38,021
6
$217,018
36
$69,242
APPLICATIONS WITHDRAWN
1
$80,740
10
$82,279
36
$100,178
8
$91,955
4
$66,322
8
$64,560
FILES CLOSED FOR INCOMPLETENESS
1
$138,410
3
$91,847
10
$107,142
0
$0
4
$93,878
0
$0
Aggregated Statistics For Year 2004 (Based on 2 partial tracts)
A) FHA, FSA/RHS & VA Home Purchase Loans
B) Conventional Home Purchase Loans
C) Refinancings
D) Home Improvement Loans
F) Non-occupant Loans on < 5 Family Dwellings (A B C & D)
G) Loans On Manufactured Home Dwelling (A B C & D)
Number
Average Value
Number
Average Value
Number
Average Value
Number
Average Value
Number
Average Value
Number
Average Value
LOANS ORIGINATED
6
$109,150
77
$95,088
97
$96,186
21
$42,964
36
$90,851
19
$56,188
APPLICATIONS APPROVED, NOT ACCEPTED
1
$38,450
5
$63,568
14
$74,882
4
$74,972
0
$0
6
$62,158
APPLICATIONS DENIED
1
$75,610
29
$64,876
68
$93,538
8
$61,998
4
$104,770
35
$53,351
APPLICATIONS WITHDRAWN
0
$0
10
$89,199
28
$97,127
6
$75,615
1
$69,210
3
$56,817
FILES CLOSED FOR INCOMPLETENESS
0
$0
3
$24,777
6
$101,460
1
$15,380
0
$0
0
$0
Aggregated Statistics For Year 2003 (Based on 2 partial tracts)
A) FHA, FSA/RHS & VA Home Purchase Loans
B) Conventional Home Purchase Loans
C) Refinancings
D) Home Improvement Loans
F) Non-occupant Loans on < 5 Family Dwellings (A B C & D)
Number
Average Value
Number
Average Value
Number
Average Value
Number
Average Value
Number
Average Value
LOANS ORIGINATED
6
$105,518
53
$86,157
138
$113,440
24
$24,938
28
$162,718
APPLICATIONS APPROVED, NOT ACCEPTED
0
$0
12
$80,313
31
$102,652
1
$11,530
6
$128,800
APPLICATIONS DENIED
4
$52,865
27
$70,298
81
$91,911
12
$21,147
4
$31,720
APPLICATIONS WITHDRAWN
0
$0
12
$107,441
33
$100,237
0
$0
3
$196,513
FILES CLOSED FOR INCOMPLETENESS
0
$0
0
$0
6
$79,887
1
$19,220
0
$0
Aggregated Statistics For Year 2002 (Based on 2 partial tracts)
A) FHA, FSA/RHS & VA Home Purchase Loans
B) Conventional Home Purchase Loans
C) Refinancings
D) Home Improvement Loans
F) Non-occupant Loans on < 5 Family Dwellings (A B C & D)
Number
Average Value
Number
Average Value
Number
Average Value
Number
Average Value
Number
Average Value
LOANS ORIGINATED
5
$97,658
36
$84,052
132
$95,440
29
$17,280
32
$108,776
APPLICATIONS APPROVED, NOT ACCEPTED
0
$0
10
$80,613
32
$120,871
1
$192,240
9
$252,333
APPLICATIONS DENIED
3
$72,197
35
$55,805
91
$72,417
12
$24,777
6
$55,537
APPLICATIONS WITHDRAWN
3
$74,760
13
$91,585
38
$71,500
1
$216,590
1
$60,240
FILES CLOSED FOR INCOMPLETENESS
1
$108,940
0
$0
9
$95,978
0
$0
1
$53,830
Aggregated Statistics For Year 2001 (Based on 2 partial tracts)
A) FHA, FSA/RHS & VA Home Purchase Loans
B) Conventional Home Purchase Loans
C) Refinancings
D) Home Improvement Loans
F) Non-occupant Loans on < 5 Family Dwellings (A B C & D)
Number
Average Value
Number
Average Value
Number
Average Value
Number
Average Value
Number
Average Value
LOANS ORIGINATED
9
$71,770
67
$93,672
94
$80,427
35
$21,824
28
$66,598
APPLICATIONS APPROVED, NOT ACCEPTED
0
$0
15
$60,491
13
$54,616
0
$0
3
$69,633
APPLICATIONS DENIED
1
$43,570
40
$45,465
105
$64,263
18
$25,205
5
$41,012
APPLICATIONS WITHDRAWN
3
$85,867
15
$95,265
45
$66,956
0
$0
0
$0
FILES CLOSED FOR INCOMPLETENESS
0
$0
1
$316,560
19
$75,682
0
$0
3
$66,217
Aggregated Statistics For Year 2000 (Based on 2 partial tracts)
A) FHA, FSA/RHS & VA Home Purchase Loans
B) Conventional Home Purchase Loans
C) Refinancings
D) Home Improvement Loans
F) Non-occupant Loans on < 5 Family Dwellings (A B C & D)
Number
Average Value
Number
Average Value
Number
Average Value
Number
Average Value
Number
Average Value
LOANS ORIGINATED
4
$49,982
62
$65,920
69
$79,849
21
$7,201
14
$45,863
APPLICATIONS APPROVED, NOT ACCEPTED
6
$38,448
26
$57,031
13
$42,095
1
$20,510
3
$104,663
APPLICATIONS DENIED
6
$34,390
82
$38,667
106
$65,821
14
$9,612
4
$26,272
APPLICATIONS WITHDRAWN
0
$0
6
$74,760
23
$62,130
0
$0
1
$35,880
FILES CLOSED FOR INCOMPLETENESS
0
$0
4
$86,508
12
$68,672
0
$0
1
$181,990
Aggregated Statistics For Year 1999 (Based on 1 partial tract)
A) FHA, FSA/RHS & VA Home Purchase Loans
B) Conventional Home Purchase Loans
C) Refinancings
D) Home Improvement Loans
F) Non-occupant Loans on < 5 Family Dwellings (A B C & D)


 Nearest zip codes: 28718, 29661, 29683, 28712, 28766, 29671.