Estimated zip code population in 2022: 16,487 Zip code population in 2010: 15,861 Zip code population in 2000: 13,489
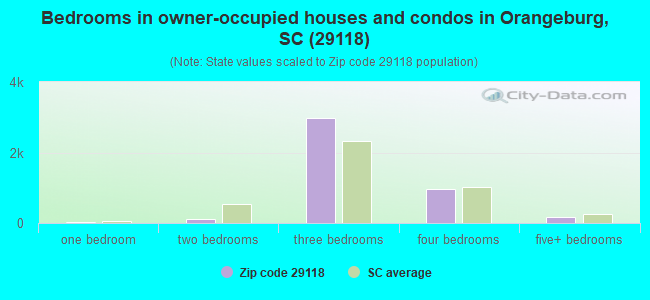
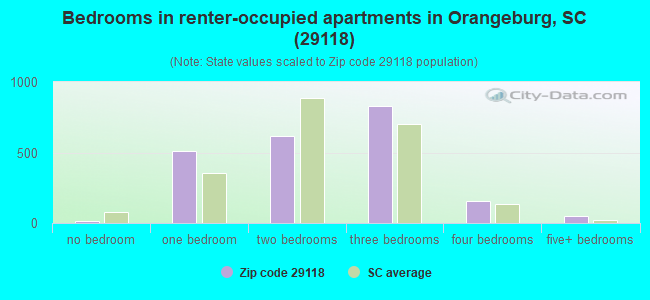
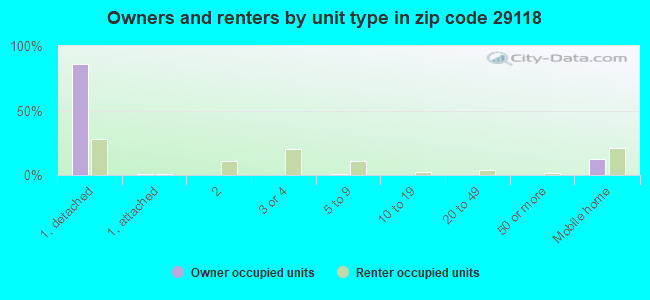
Houses and condos: 7,115 Renter-occupied apartments: 2,170
% of renters here:
34%
State:
28%
March 2022 cost of living index in zip code 29118: 80.7 (low, U.S. average is 100)
Land area: 77.9 sq. mi. Water area: 0.4 sq. mi.
Population density: 212 people per square mile
(very low).
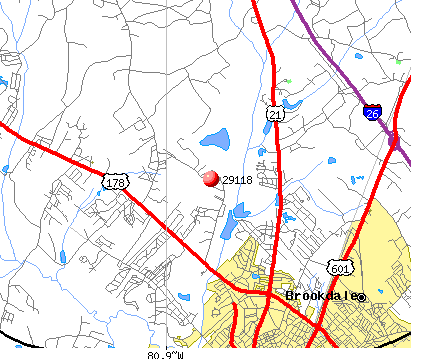
OSM Map
General Map
Google Map
MSN Map
OSM Map
General Map
Google Map
MSN Map
OSM Map
General Map
Google Map
MSN Map
OSM Map
General Map
Google Map
MSN Map
Please wait while loading the map...
Real estate property taxes paid for housing units in 2022:
This zip code:
0.6% ($1,108)
South Carolina:
0.5% ($1,185)
Median real estate property taxes paid for housing units with mortgages in 2022: $1,286 (0.6%) Median real estate property taxes paid for housing units with no mortgage in 2022: $910 (0.6%)
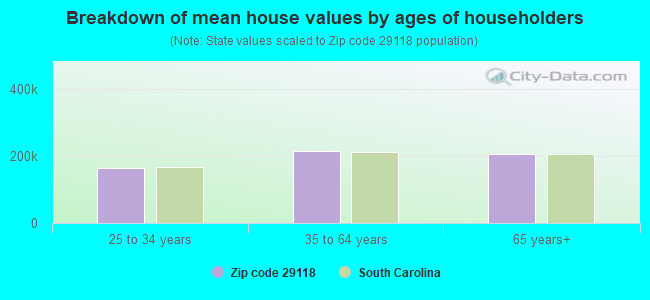
Estimated median house/condo value in 2022: $191,951
29118:
$191,951
South Carolina:
$254,600
According to our research of South Carolina and other state lists, there were 3 registered sex offenders living in 29118 zip code as of July 04, 2024. The ratio of all residents to sex offenders in zip code 29118 is 5,612 to 1. The ratio of registered sex offenders to all residents in this zip code is much lower than the state average.
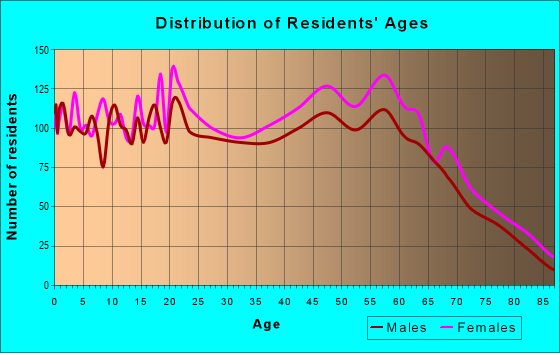
Median resident age:
This zip code:
38.5 years
South Carolina median age:
40.5 years
Average household size:
This zip code:
2.5 people
South Carolina:
2.4 people
Averages for the 2020 tax year for zip code 29118, filed in 2021:
Average Adjusted Gross Income (AGI) in 2020: $54,706 (Individual Income Tax Returns)
Here:
$54,706
State:
$65,754
Salary/wage: $43,198 (reported on 83.9% of returns)
Here:
$43,198
State:
$52,566
(% of AGI for various income ranges: 1281.5% for AGIs below $25k, 4205.4% for AGIs $25k-50k, 7611.7% for AGIs $50k-75k, 12175.6% for AGIs $75k-100k, 22560.0% for AGIs $100k-200k, 120343.3% for AGIs over 200k)
Taxable interest for individuals: $1,668 (reported on 18.5% of returns)
This zip code:
$1,668
South Carolina:
$1,749
(% of AGI for various income ranges: 6.9% for AGIs below $25k, 10.7% for AGIs $25k-50k, 34.1% for AGIs $50k-75k, 36.0% for AGIs $75k-100k, 211.2% for AGIs $100k-200k, 3536.7% for AGIs over 200k)
Ordinary dividends: $8,828 (reported on 11.5% of returns)
Here:
$8,828
State:
$8,783
(% of AGI for various income ranges: 11.0% for AGIs below $25k, 23.3% for AGIs $25k-50k, 92.2% for AGIs $50k-75k, 157.2% for AGIs $75k-100k, 577.3% for AGIs $100k-200k, 14106.7% for AGIs over 200k)
Net capital gain/loss in AGI: +$20,578 (reported on 10.8% of returns)
Here:
+$20,578
State:
+$24,194
(% of AGI for various income ranges: 5.1% for AGIs below $25k, 22.8% for AGIs $25k-50k, 61.7% for AGIs $50k-75k, 298.4% for AGIs $75k-100k, 1011.9% for AGIs $100k-200k, 38876.7% for AGIs over 200k)
Profit/loss from business: +$4,919 (reported on 16.3% of returns)
Here:
+$4,919
State:
+$11,253
(% of AGI for various income ranges: 63.0% for AGIs below $25k, 106.0% for AGIs $75k-100k, 778.1% for AGIs $100k-200k, 8853.3% for AGIs over 200k)
Taxable individual retirement arrangement distribution: $16,702 (reported on 7.2% of returns)
29118:
$16,702
South Carolina:
$21,604
(% of AGI for various income ranges: 28.6% for AGIs below $25k, 76.9% for AGIs $25k-50k, 163.7% for AGIs $50k-75k, 421.2% for AGIs $75k-100k, 1100.0% for AGIs $100k-200k, 6396.7% for AGIs over 200k)
Total itemized deductions: $36,315 (reported on 8.4% of returns)
Here:
$36,315
State:
$35,199
(% of AGI for various income ranges: 44.1% for AGIs below $25k, 138.2% for AGIs $25k-50k, 563.4% for AGIs $50k-75k, 1092.8% for AGIs $75k-100k, 2280.4% for AGIs $100k-200k, 22880.0% for AGIs over 200k)
Charity contributions: $18,535 (reported on 7.7% of returns)
Here:
$18,535
State:
$14,319
(% of AGI for various income ranges: 4.0% for AGIs below $25k, 40.9% for AGIs $25k-50k, 158.1% for AGIs $50k-75k, 458.8% for AGIs $75k-100k, 860.4% for AGIs $100k-200k, 17310.0% for AGIs over 200k)
Taxes paid: $6,612 (reported on 8.4% of returns)
29118:
$6,612
State:
$7,486
(% of AGI for various income ranges: 3.8% for AGIs below $25k, 22.9% for AGIs $25k-50k, 108.1% for AGIs $50k-75k, 260.0% for AGIs $75k-100k, 568.1% for AGIs $100k-200k, 2623.3% for AGIs over 200k)
Earned income credit: $2,570 (reported on 25.0% of returns)
Here:
$2,570
State:
$2,397
(% of AGI for various income ranges: 149.1% for AGIs below $25k, 102.2% for AGIs $25k-50k)
Percentage of individuals using paid preparers for their 2020 taxes: 90.0%
Here:
90%
State:
93%
(% for various income ranges: 90.5% for AGIs below $25k, 90.8% for AGIs $25k-50k, 86.6% for AGIs $50k-75k, 88.0% for AGIs $75k-100k, 91.0% for AGIs $100k-200k, 94.7% for AGIs over 200k)
Averages for the 2012 tax year for zip code 29118, filed in 2013:
Average Adjusted Gross Income (AGI) in 2012: $51,318 (Individual Income Tax Returns)
Here:
$51,318
State:
$51,133
Salary/wage: $41,359 (reported on 84.7% of returns)
Here:
$41,359
State:
$42,173
(% of AGI for various income ranges: 78.7% for AGIs below $25k, 81.4% for AGIs $25k-50k, 74.5% for AGIs $50k-75k, 71.9% for AGIs $75k-100k, 72.7% for AGIs $100k-200k, 44.5% for AGIs over 200k)
Taxable interest for individuals: $1,247 (reported on 22.8% of returns)
This zip code:
$1,247
South Carolina:
$1,468
(% of AGI for various income ranges: 0.5% for AGIs below $25k, 0.5% for AGIs $25k-50k, 0.5% for AGIs $50k-75k, 0.5% for AGIs $75k-100k, 0.4% for AGIs $100k-200k, 0.8% for AGIs over 200k)
Ordinary dividends: $5,696 (reported on 14.9% of returns)
Here:
$5,696
State:
$6,511
(% of AGI for various income ranges: 0.8% for AGIs below $25k, 0.7% for AGIs $25k-50k, 1.1% for AGIs $50k-75k, 0.8% for AGIs $75k-100k, 1.4% for AGIs $100k-200k, 3.7% for AGIs over 200k)
Net capital gain/loss in AGI: +$12,874 (reported on 11.1% of returns)
Here:
+$12,874
State:
+$13,061
(% of AGI for various income ranges: 0.4% for AGIs below $25k, 0.4% for AGIs $25k-50k, 0.3% for AGIs $50k-75k, 0.8% for AGIs $75k-100k, 1.4% for AGIs $100k-200k, 9.3% for AGIs over 200k)
Profit/loss from business: +$7,363 (reported on 14.7% of returns)
Here:
+$7,363
State:
+$10,167
(% of AGI for various income ranges: 5.7% for AGIs below $25k, 1.0% for AGIs $25k-50k, 0.1% for AGIs $50k-75k, 1.3% for AGIs $75k-100k, 2.3% for AGIs $100k-200k, 2.8% for AGIs over 200k)
Taxable individual retirement arrangement distribution: $16,113 (reported on 8.0% of returns)
29118:
$16,113
South Carolina:
$17,019
(% of AGI for various income ranges: 1.9% for AGIs below $25k, 1.7% for AGIs $25k-50k, 1.7% for AGIs $50k-75k, 3.8% for AGIs $75k-100k, 3.0% for AGIs $100k-200k, 2.9% for AGIs over 200k)
Total itemized deductions: $22,982 (22% of AGI, reported on 31.4% of returns)
Here:
$22,982
State:
$22,890
Here:
21.7% of AGI
State:
21.4% of AGI
(% of AGI for various income ranges: 7.6% for AGIs below $25k, 13.2% for AGIs $25k-50k, 15.3% for AGIs $50k-75k, 16.9% for AGIs $75k-100k, 17.6% for AGIs $100k-200k, 12.4% for AGIs over 200k)
Charity contributions: $6,508 (reported on 28.1% of returns)
Here:
$6,508
State:
$5,169
(% of AGI for various income ranges: 1.0% for AGIs below $25k, 2.6% for AGIs $25k-50k, 3.7% for AGIs $50k-75k, 4.7% for AGIs $75k-100k, 4.7% for AGIs $100k-200k, 3.7% for AGIs over 200k)
Taxes paid: $7,502 (reported on 31.4% of returns)
29118:
$7,502
State:
$7,644
(% of AGI for various income ranges: 1.1% for AGIs below $25k, 2.6% for AGIs $25k-50k, 4.0% for AGIs $50k-75k, 5.1% for AGIs $75k-100k, 6.6% for AGIs $100k-200k, 6.0% for AGIs over 200k)
Earned income credit: $2,543 (reported on 26.6% of returns)
Here:
$2,543
State:
$2,418
(% of AGI for various income ranges: 10.0% for AGIs below $25k, 1.3% for AGIs $25k-50k)
Percentage of individuals using paid preparers for their 2012 taxes: 60.1%
Here:
60%
State:
57%
(% for various income ranges: 58.4% for AGIs below $25k, 58.2% for AGIs $25k-50k, 60.8% for AGIs $50k-75k, 62.5% for AGIs $75k-100k, 66.0% for AGIs $100k-200k, 81.2% for AGIs over 200k)
Averages for the 2004 tax year for zip code 29118, filed in 2005:
Average Adjusted Gross Income (AGI) in 2004: $45,156 (Individual Income Tax Returns)
Here:
$45,156
State:
$41,965
Salary/wage: $38,916 (reported on 88.0% of returns)
Here:
$38,916
State:
$35,695
(% of AGI for various income ranges: 129.2% for AGIs below $10k, 84.7% for AGIs $10k-25k, 84.1% for AGIs $25k-50k, 80.6% for AGIs $50k-75k, 81.0% for AGIs $75k-100k, 63.6% for AGIs over 100k)
Taxable interest for individuals: $1,601 (reported on 33.1% of returns)
This zip code:
$1,601
South Carolina:
$1,623
(% of AGI for various income ranges: 4.5% for AGIs below $10k, 1.3% for AGIs $10k-25k, 1.0% for AGIs $25k-50k, 0.9% for AGIs $50k-75k, 1.0% for AGIs $75k-100k, 1.3% for AGIs over 100k)
Taxable dividends: $3,286 (reported on 20.1% of returns)
Here:
$3,286
State:
$3,999
(% of AGI for various income ranges: 3.2% for AGIs below $10k, 0.8% for AGIs $10k-25k, 0.7% for AGIs $25k-50k, 0.7% for AGIs $50k-75k, 1.2% for AGIs $75k-100k, 2.3% for AGIs over 100k)
Net capital gain/loss: +$12,495 (reported on 14.1% of returns)
Here:
+$12,495
State:
+$13,100
(% of AGI for various income ranges: -0.7% for AGIs below $10k, 1.0% for AGIs $10k-25k, 0.8% for AGIs $25k-50k, 1.1% for AGIs $50k-75k, 0.9% for AGIs $75k-100k, 8.5% for AGIs over 100k)
Profit/loss from business: +$7,851 (reported on 12.8% of returns)
Here:
+$7,851
State:
+$9,144
(% of AGI for various income ranges: -8.0% for AGIs below $10k, 1.9% for AGIs $10k-25k, 1.1% for AGIs $25k-50k, 1.0% for AGIs $50k-75k, 1.1% for AGIs $75k-100k, 4.2% for AGIs over 100k)
IRA payment deduction: $3,919 (reported on 1.9% of returns)
29118:
$3,919
South Carolina:
$2,972
(% of AGI for various income ranges: 0.1% for AGIs $10k-25k, 0.2% for AGIs $25k-50k, 0.2% for AGIs $50k-75k, 0.2% for AGIs $75k-100k, 0.1% for AGIs over 100k)
Self-employed pension: $14,220 (reported on 0.7% of returns)
Here:
$14,220
South Carolina:
$15,117
Total itemized deductions: $19,545 (22% of AGI, reported on 36.7% of returns)
Here:
$19,545
State:
$19,039
Here:
22.2% of AGI
State:
22.8% of AGI
(% of AGI for various income ranges: 9.9% for AGIs below $10k, 8.0% for AGIs $10k-25k, 15.5% for AGIs $25k-50k, 18.9% for AGIs $50k-75k, 20.6% for AGIs $75k-100k, 15.5% for AGIs over 100k)
Charity contributions deductions: $5,010 (6% of AGI, reported on 33.8% of returns)
Here:
$5,010
State:
$4,305
Here:
5.5% of AGI
State:
5.0% of AGI
(% of AGI for various income ranges: 0.8% for AGIs below $10k, 1.5% for AGIs $10k-25k, 3.2% for AGIs $25k-50k, 4.6% for AGIs $50k-75k, 4.8% for AGIs $75k-100k, 4.0% for AGIs over 100k)
Total tax: $7,664 (reported on 67.4% of returns)
29118:
$7,664
State:
$6,497
(% of AGI for various income ranges: 2.4% for AGIs below $10k, 2.9% for AGIs $10k-25k, 5.8% for AGIs $25k-50k, 8.3% for AGIs $50k-75k, 9.5% for AGIs $75k-100k, 18.7% for AGIs over 100k)
Earned income credit: $1,898 (reported on 24.1% of returns)
Here:
$1,898
State:
$1,882
Percentage of individuals using paid preparers for their 2004 taxes: 67.9%
Here:
68%
State:
66%
(% for various income ranges: 63.1% for AGIs below $10k, 71.0% for AGIs $10k-25k, 66.2% for AGIs $25k-50k, 69.8% for AGIs $50k-75k, 66.6% for AGIs $75k-100k, 73.0% for AGIs over 100k)
Household received Food Stamps/SNAP in the past 12 months: 805 Household did not receive Food Stamps/SNAP in the past 12 months: 5,609
Women who had a birth in the past 12 months: 187 (93 now married, 90 unmarried) Women who did not have a birth in the past 12 months: 3,976 (1,242 now married, 2,717 unmarried)
Housing units in zip code 29118 with a mortgage: 1,934 (142 second mortgage, 40 home equity loan, 82 both second mortgage and home equity loan) Houses without a mortgage: 84
Median monthly owner costs for units with a mortgage: $1,243 Median monthly owner costs for units without a mortgage: $422
Residents with income below the poverty level in 2022:
This zip code:
17.4%
Whole state:
14.0%
Residents with income below 50% of the poverty level in 2022:
This zip code:
11.1%
Whole state:
7.3%
Median number of rooms in houses and condos:
Here:
6.4
State:
6.4
Median number of rooms in apartments:
Here:
4.7
State:
4.5
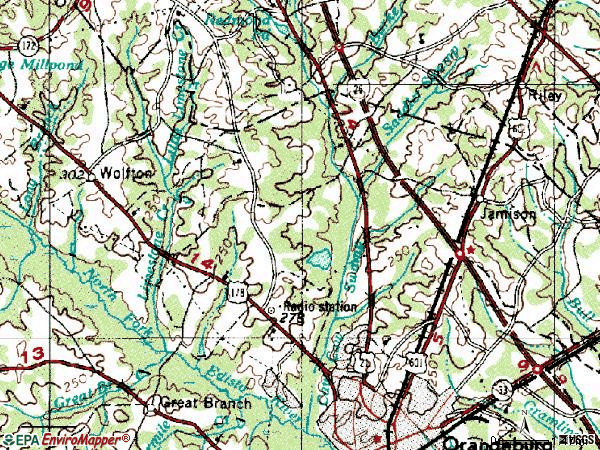
Notable locations in this zip code not listed on our city pages
Notable locations in zip code 29118: Carolina Regional Business Park (A), Country Club of Orangeburg (B), Hillcrest Golf Course (C), Orangeburg-Calhoun Law Enforcement Center (D), William J McCord Adolescent Treatment Facility (E), Orangeburg County Fire Department Jamison (F), City of Orangeburg Fire Department Station 3 (G), Orangeburg County Fire Department Jamison Station 2 (H), Orangeburg - Calhoun Technical College Gressette Learning Resource Center (I), Morningside of Orangeburg (J). Display/hide their locations on the map
Churches in zip code 29118 include: Providence Church (A), Zion Church (B), Saint Stephens Church (C), Saint Johns Church (D), Mount Carmel Baptist Church (E), Trinity Church (F), Moses Temple (G), Calvary Church (H), New Hope Baptist Church (I). Display/hide their locations on the map
Cemeteries: Belleville Memorial Cemetery (1), Mount Calvary Cemetery (2), Crestview Cemetery (3), Saint Stephen Church Cemetery (4), Prospect Cemetery (5), Mount Carmel Baptist Church Cemetery (6), Mount Calvary Cemetery (7). Display/hide their locations on the map
Reservoirs: Rogers Pond (A), Duncan Pond (B), Perkins Pond (C), Zeiglers Pond (D), Ocains Pond (E), Sims Pond (F), Shecuts Pond (G), John Smiths Pond (H). Display/hide their locations on the map
Streams, rivers, and creeks: Saddler Swamp (A), Mill Branch (B), Turkey Hill Branch (C), Limestone Creek (D), Early Branch (E), Great Branch (F), Burke Creek (G). Display/hide their locations on the map
In group quarters: 242 (-1 institutionalized population)
Size of family households: 2,387 2-persons, 1,199 3-persons, 403 4-persons, 288 5-persons, 102 6-persons, 62 7-or-more-persons
Size of nonfamily households: 1,708 1-person, 249 2-persons, 28 5-persons
1,542 married couples with children.
1,473 single-parent households (57 men, 1,416 women).
90.8% of residents of 29118 zip code speak English at home.
6.3% of residents speak Spanish at home (12% very well, 71% well, 14% not well, 3% not at all).
1.0% of residents speak other Indo-European language at home (87% very well, 13% not well).
1.1% of residents speak Asian or Pacific Island language at home (81% very well, 12% well, 7% not well).
0.7% of residents speak other language at home (69% very well, 31% not well).
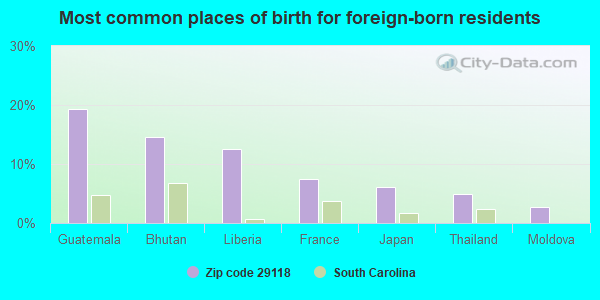
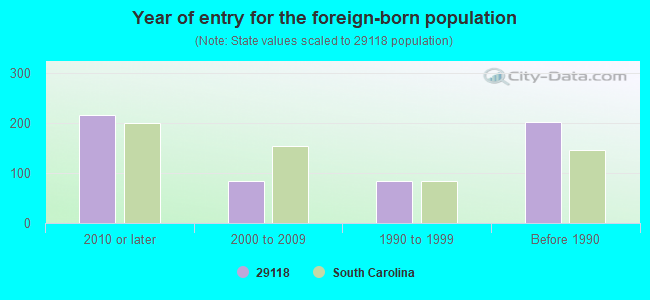
Foreign born population: 450 (2.7%) (55.7% of them are naturalized citizens)
Facilities with environmental interests located in this zip code:
EDWARDS LUMBER COMPANY (HWY 33-160 TOBAGO ROAD in ORANGEBURG, SC)
AIR MINOR (AIRS/AFS) STATE MASTER (South Carolina database) - AIR PROGRAM, Business SIC classification: SAWMILLS AND PLANING MILLS, GENERAL; HARDWOOD DIMENSION AND FLOORING MILLS; SERVICES Organizations: TIMMONS ENGINEERING (CONTACT/ENGINEERING/CONSULTING FIRM)
DUKES-HARLEY FUNERAL HOME (3379 COLUMBIA ROAD in ORANGEBURG, SC)
AIR MINOR (AIRS/AFS) STATE MASTER (South Carolina database) - AIR PROGRAM, Business SIC classification: FUNERAL SERVICE AND CREMATORIES; EMPLOYMENT AGENCIES Business NAICS classification: FUNERAL HOMES AND FUNERAL SERVICES.
FAIREY CHEVROLET (2885 ST MATTHEWS RD in ORANGEBURG, SC)
Conditionally Exempt Small Quantity Generators, less than 100 kg/month of hazardous waste (Resource Conservation and Recovery Act (tracking hazardous waste)) - notification STATE MASTER (South Carolina database) - UNDERGROUND STORAGE TANK PROGRAM, HAZARDOUS WASTE PROGRAM Organizations: FAIREY, III ELIZABETH MCCLAIN, FAIREY, I (CONTACT/OWNER)
Housing units lacking complete plumbing facilities: 3.8% Housing units lacking complete kitchen facilities: 3.8%
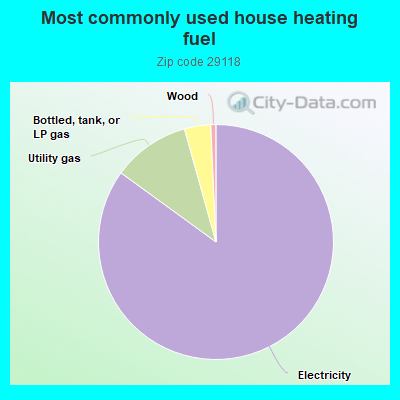
84.5%Electricity
10.6%Utility gas
3.6%Bottled, tank, or LP gas
0.7%Wood
Place of birth for U.S.-born residents:
This state: 11,756
Northeast: 2,112
Midwest: 394
South: 1,233
West: 229
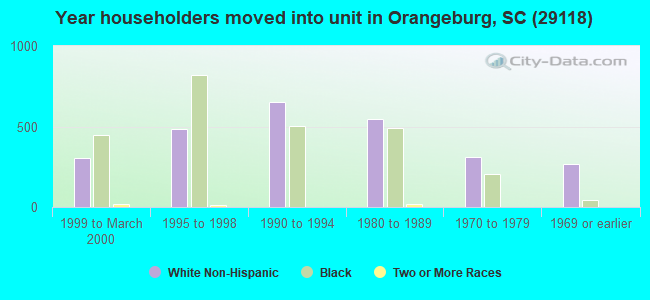
64% of the 29118 zip code residents lived in the same house 5 years ago. Out of people who lived in different houses, 63% lived in this county. Out of people who lived in different counties, 50% lived in South Carolina.
94% of the 29118 zip code residents lived in the same house 1 year ago. Out of people who lived in different houses, 32% moved from this county. Out of people who lived in different houses, 39% moved from different county within same state. Out of people who lived in different houses, 17% moved from different state. Out of people who lived in different houses, 12% moved from abroad.
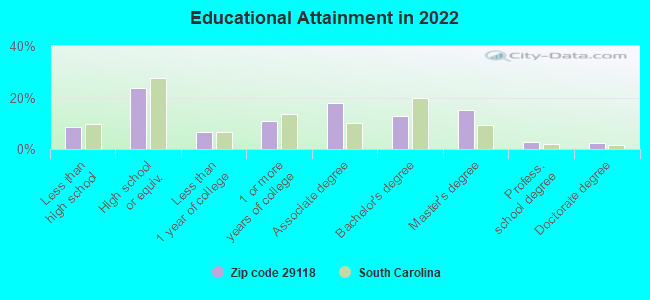
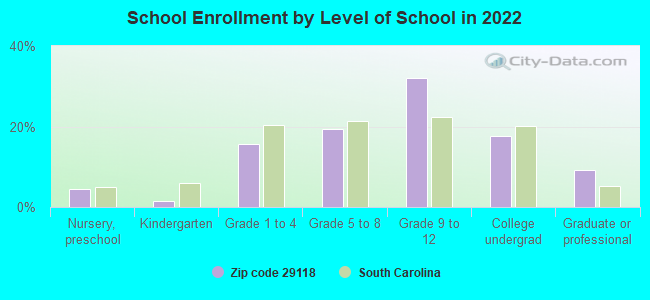
Private vs. public school enrollment:
Students in private schools in grades 1 to 8 (elementary and middle school): 151
Here:
10.5%
South Carolina:
14.4%
Students in private schools in grades 9 to 12 (high school): 64
Here:
4.9%
South Carolina:
11.1%
Students in private undergraduate colleges: 418
Here:
54.7%
South Carolina:
21.9%
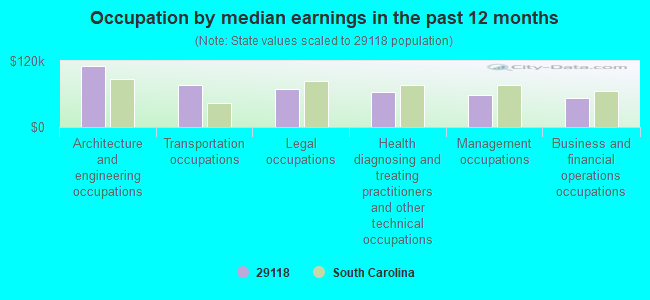
Occupation by median earnings in the past 12 months ($)
111,111Architecture and engineering occupations
76,162Transportation occupations
69,867Legal occupations
63,867Health diagnosing and treating practitioners and other technical occupations
57,572Management occupations
53,568Business and financial operations occupations
Companies with federal contracts located in this zip code:
ORANGEBURG COUNTY DISABILITIES (2785 MAGNOLIA STREET in ORANGEBURG, SC) : $86,017 in 8 contractsfrom 2003 to 2005
Contracts for Custodial Janitorial Services, Landscaping/Groundskeeping Services by Army Signed by year:2000: $0; 2001: $0; 2002: $0; 2003: $28,987; 2004: $27,896; 2005: $29,134; 2006: $0.
Biggest contracts:
$21,241 with Army for Custodial Janitorial Services. Signed on 2005-08-17. Completion date: 2006-07-31.
$20,562, same as above.Signed on 2004-08-10. Completion date: 2005-07-31.
$19,154, same as above.Signed on 2003-09-18. Completion date: 2004-07-31.
$7,893 with Army for Landscaping/Groundskeeping Services. Signed on 2005-08-16. Completion date: 2006-07-31.
DAYS INN (3691 SAINT MATTHEWS RD in ORANGEBURG, SC) : $82,995 in 4 contractsfrom 2004 to 2005
$63,745 with Army for Lodging - Hotel/Motel. Signed on 2005-02-09. Completion date: 2005-05-17.
$10,780, same as above.Signed on 2004-05-28. Completion date: 2004-06-10.
$8,250, same as above.Signed on 2004-07-08. Completion date: 2004-07-17.
$220, same as above.Signed on 2004-08-14. Completion date: 2004-07-17.
Top industries in this zip code by the number of employees in 2005:
Health Care and Social Assistance: General Medical and Surgical Hospitals (over 1000 employees: 1 establishment)
Health Care and Social Assistance: Offices of Physicians (except Mental Health Specialists) (20-49: 1, 10-19: 8, 5-9: 13, 1-4: 15)
Accommodation and Food Services: Limited-Service Restaurants (50-99: 2, 20-49: 2)
Administrative and Support and Waste Management and Remediation Services: Temporary Help Services (50-99: 1, 20-49: 1, 10-19: 1, 1-4: 1)
Accommodation and Food Services: Hotels (except Casino Hotels) and Motels (20-49: 2, 10-19: 2, 5-9: 2, 1-4: 2)
Health Care and Social Assistance: Other Individual and Family Services (50-99: 1, 1-4: 1)
Arts, Entertainment, and Recreation: Fitness and Recreational Sports Centers (20-49: 1, 10-19: 2, 5-9: 1, 1-4: 2)
People in group quarters in 2010:
307 people in local jails and other municipal confinement facilities
3 people in group homes intended for adults
People in group quarters in 2000:
34 people in other group homes
17 people in nursing homes
Fatal accident statistics in 2014:
Fatal accident count: 2
Vehicles involved in fatal accidents: 3
Fatal accidents caused by drunken drivers: 3
Fatalities: 2
Persons involved in fatal accidents: 4
Pedestrians involved in fatal accidents: 0
Fatal accident statistics in 2013:
Fatal accident count: 6
Vehicles involved in fatal accidents: 10
Fatal accidents caused by drunken drivers: 1
Fatalities: 6
Persons involved in fatal accidents: 17
Pedestrians involved in fatal accidents: 1
2003 - 2018 National Fire Incident Reporting System (NFIRS) incidents
Based on the data from the years 2003 - 2018 the average number of fires per year is 23. The highest number of fire incidents - 52 took place in 2010, and the least - 3 in 2003. The data has a growing trend.
When looking into fire subcategories, the most incidents belonged to: Outside Fires (42.9%), and Structure Fires (31.2%).
Fire incident types reported to NFIRS in Zip Code 29118


 Nearest zip codes: 29117, 29115, 29039, 29135, 29112, 29038.


 Based on the data from the years 2003 - 2018 the average number of fires per year is 23. The highest number of fire incidents - 52 took place in 2010, and the least - 3 in 2003. The data has a growing trend.
 When looking into fire subcategories, the most incidents belonged to: Outside Fires (42.9%), and Structure Fires (31.2%).