Estimated zip code population in 2022: 2,720 Zip code population in 2010: 3,146 Zip code population in 2000: 2,961
Houses and condos: 1,422 Renter-occupied apartments: 166
% of renters here:
14%
State:
33%
March 2022 cost of living index in zip code 28669: 79.4 (low, U.S. average is 100)
Land area: 46.3 sq. mi. Water area: 0.1 sq. mi.
Population density: 59 people per square mile
(very low).
OSM Map
General Map
Google Map
MSN Map
OSM Map
General Map
Google Map
MSN Map
OSM Map
General Map
Google Map
MSN Map
OSM Map
General Map
Google Map
MSN Map
Please wait while loading the map...
Real estate property taxes paid for housing units in 2022:
This zip code:
0.6% ($906)
North Carolina:
0.6% ($1,769)
Median real estate property taxes paid for housing units with mortgages in 2022: $1,022 (0.6%) Median real estate property taxes paid for housing units with no mortgage in 2022: $680 (0.6%)
Business Search- 14 Million verified businesses
Males: 1,504
(55.3%)
Females: 1,214
(44.7%)
For population 25 years and over in 28669:
High school or higher: 90.4%
Bachelor's degree or higher: 16.4%
Graduate or professional degree: 6.7%
Unemployed: 3.4%
Mean travel time to work (commute): 32.3 minutes
For population 15 years and over in 28669:
Never married: 22.3%
Now married: 63.1%
Separated: 5.3%
Widowed: 1.6%
Divorced: 7.7%
Zip code 28669 compared to state average:
Median house value below state average.
Black race population percentage below state average.
Median age significantly above state average.
Renting percentage significantly below state average.
Length of stay since moving in significantly above state average.
Number of college students below state average.
Percentage of population with a bachelor's degree or higher below state average.
Estimated median house/condo value in 2022: $156,606
28669:
$156,606
North Carolina:
$280,600
According to our research of North Carolina and other state lists, there were 6 registered sex offenders living in 28669 zip code as of July 17, 2024. The ratio of all residents to sex offenders in zip code 28669 is 460 to 1. The ratio of registered sex offenders to all residents in this zip code is near the state average.
Median resident age:
This zip code:
48.5 years
North Carolina median age:
39.2 years
Average household size:
This zip code:
2.2 people
North Carolina:
2.4 people
Averages for the 2020 tax year for zip code 28669, filed in 2021:
Average Adjusted Gross Income (AGI) in 2020: $46,387 (Individual Income Tax Returns)
Here:
$46,387
State:
$70,020
Salary/wage: $40,762 (reported on 79.8% of returns)
Here:
$40,762
State:
$58,387
(% of AGI for various income ranges: 1105.3% for AGIs below $25k, 3680.0% for AGIs $25k-50k, 6050.7% for AGIs $50k-75k, 8022.5% for AGIs $75k-100k, 20544.0% for AGIs $100k-200k)
Taxable interest for individuals: $412 (reported on 26.9% of returns)
This zip code:
$412
North Carolina:
$1,479
(% of AGI for various income ranges: 15.9% for AGIs below $25k, 9.2% for AGIs $25k-50k, 17.3% for AGIs $50k-75k, 18.8% for AGIs $75k-100k, 28.0% for AGIs $100k-200k)
Ordinary dividends: $2,471 (reported on 14.3% of returns)
Here:
$2,471
State:
$7,888
(% of AGI for various income ranges: 20.0% for AGIs below $25k, 13.2% for AGIs $25k-50k, 86.0% for AGIs $50k-75k, 30.0% for AGIs $75k-100k, 332.0% for AGIs $100k-200k)
Net capital gain/loss in AGI: +$11,631 (reported on 10.9% of returns)
Here:
+$11,631
State:
+$23,652
(% of AGI for various income ranges: 11.5% for AGIs below $25k, 22.4% for AGIs $25k-50k, 130.7% for AGIs $50k-75k, 2442.0% for AGIs $100k-200k)
Profit/loss from business: +$8,626 (reported on 16.0% of returns)
Here:
+$8,626
State:
+$11,710
(% of AGI for various income ranges: 208.2% for AGIs below $25k, 158.8% for AGIs $25k-50k, 180.7% for AGIs $50k-75k, 328.8% for AGIs $75k-100k)
Taxable individual retirement arrangement distribution: $17,169 (reported on 10.9% of returns)
28669:
$17,169
North Carolina:
$20,247
(% of AGI for various income ranges: 78.5% for AGIs below $25k, 106.8% for AGIs $25k-50k, 456.0% for AGIs $50k-75k, 2028.0% for AGIs $100k-200k)
Total itemized deductions: $26,000 (reported on 1.7% of returns)
Here:
$26,000
State:
$34,549
(% of AGI for various income ranges: 346.7% for AGIs $50k-75k)
Earned income credit: $2,421 (reported on 20.2% of returns)
Here:
$2,421
State:
$2,337
(% of AGI for various income ranges: 109.7% for AGIs below $25k, 83.2% for AGIs $25k-50k)
Percentage of individuals using paid preparers for their 2020 taxes: 96.6%
Here:
97%
State:
93%
(% for various income ranges: 95.7% for AGIs below $25k, 96.9% for AGIs $25k-50k, 95.0% for AGIs $50k-75k, 100.0% for AGIs $75k-100k, 100.0% for AGIs $100k-200k)
Averages for the 2012 tax year for zip code 28669, filed in 2013:
Average Adjusted Gross Income (AGI) in 2012: $33,635 (Individual Income Tax Returns)
Here:
$33,635
State:
$54,937
Salary/wage: $31,256 (reported on 82.9% of returns)
Here:
$31,256
State:
$46,336
(% of AGI for various income ranges: 74.6% for AGIs below $25k, 80.8% for AGIs $25k-50k, 83.8% for AGIs $50k-75k, 72.8% for AGIs $75k-100k, 62.3% for AGIs $100k-200k)
Taxable interest for individuals: $647 (reported on 29.3% of returns)
This zip code:
$647
North Carolina:
$1,298
(% of AGI for various income ranges: 1.1% for AGIs below $25k, 0.5% for AGIs $25k-50k, 0.4% for AGIs $50k-75k, 0.5% for AGIs $75k-100k, 0.5% for AGIs $100k-200k)
Ordinary dividends: $1,418 (reported on 13.8% of returns)
Here:
$1,418
State:
$6,213
(% of AGI for various income ranges: 0.7% for AGIs below $25k, 0.6% for AGIs $25k-50k, 0.4% for AGIs $50k-75k, 1.1% for AGIs $75k-100k)
Net capital gain/loss in AGI: +$4,183 (reported on 9.8% of returns)
Here:
+$4,183
State:
+$12,740
(% of AGI for various income ranges: 0.5% for AGIs below $25k, 1.0% for AGIs $25k-50k, 0.5% for AGIs $50k-75k, 4.5% for AGIs $75k-100k)
Profit/loss from business: +$7,294 (reported on 14.6% of returns)
Here:
+$7,294
State:
+$10,311
(% of AGI for various income ranges: 10.1% for AGIs below $25k, 2.6% for AGIs $25k-50k, 2.3% for AGIs $50k-75k)
Taxable individual retirement arrangement distribution: $12,042 (reported on 9.8% of returns)
28669:
$12,042
North Carolina:
$15,575
(% of AGI for various income ranges: 3.4% for AGIs below $25k, 2.2% for AGIs $25k-50k, 3.1% for AGIs $50k-75k, 9.0% for AGIs $75k-100k)
Total itemized deductions: $16,550 (26% of AGI, reported on 17.9% of returns)
Here:
$16,550
State:
$23,438
Here:
26.4% of AGI
State:
21.5% of AGI
(% of AGI for various income ranges: 4.8% for AGIs below $25k, 7.6% for AGIs $25k-50k, 9.4% for AGIs $50k-75k, 11.9% for AGIs $75k-100k, 12.3% for AGIs $100k-200k)
Charity contributions: $3,563 (reported on 15.4% of returns)
Here:
$3,563
State:
$4,687
(% of AGI for various income ranges: 0.7% for AGIs below $25k, 1.2% for AGIs $25k-50k, 1.9% for AGIs $50k-75k, 2.0% for AGIs $75k-100k, 3.1% for AGIs $100k-200k)
Taxes paid: $4,700 (reported on 17.9% of returns)
28669:
$4,700
State:
$8,823
(% of AGI for various income ranges: 0.7% for AGIs below $25k, 1.4% for AGIs $25k-50k, 2.9% for AGIs $50k-75k, 4.2% for AGIs $75k-100k, 4.8% for AGIs $100k-200k)
Earned income credit: $2,033 (reported on 26.8% of returns)
Here:
$2,033
State:
$2,376
(% of AGI for various income ranges: 6.4% for AGIs below $25k, 1.6% for AGIs $25k-50k)
Percentage of individuals using paid preparers for their 2012 taxes: 68.3%
Here:
68%
State:
53%
(% for various income ranges: 65.6% for AGIs below $25k, 68.8% for AGIs $25k-50k, 72.2% for AGIs $50k-75k, 75.0% for AGIs $75k-100k, 75.0% for AGIs $100k-200k)
Averages for the 2004 tax year for zip code 28669, filed in 2005:
Average Adjusted Gross Income (AGI) in 2004: $29,356 (Individual Income Tax Returns)
Here:
$29,356
State:
$45,376
Salary/wage: $28,261 (reported on 84.7% of returns)
Here:
$28,261
State:
$39,442
(% of AGI for various income ranges: 106.2% for AGIs below $10k, 78.7% for AGIs $10k-25k, 87.3% for AGIs $25k-50k, 82.3% for AGIs $50k-75k, 76.8% for AGIs $75k-100k, 58.2% for AGIs over 100k)
Taxable interest for individuals: $720 (reported on 36.1% of returns)
This zip code:
$720
North Carolina:
$1,515
(% of AGI for various income ranges: 4.7% for AGIs below $10k, 1.7% for AGIs $10k-25k, 0.4% for AGIs $25k-50k, 0.9% for AGIs $50k-75k, 0.2% for AGIs $75k-100k, 0.8% for AGIs over 100k)
Taxable dividends: $617 (reported on 15.9% of returns)
Here:
$617
State:
$4,016
(% of AGI for various income ranges: 0.7% for AGIs below $10k, 0.4% for AGIs $10k-25k, 0.3% for AGIs $25k-50k, 0.1% for AGIs $50k-75k, 0.9% for AGIs $75k-100k)
Net capital gain/loss: +$2,312 (reported on 11.1% of returns)
Here:
+$2,312
State:
+$11,152
(% of AGI for various income ranges: 0.3% for AGIs below $10k, 0.4% for AGIs $10k-25k, 0.1% for AGIs $25k-50k, 0.8% for AGIs $50k-75k, 4.7% for AGIs $75k-100k)
Profit/loss from business: +$6,133 (reported on 17.4% of returns)
Here:
+$6,133
State:
+$9,490
(% of AGI for various income ranges: 28.1% for AGIs below $10k, 5.8% for AGIs $10k-25k, 3.5% for AGIs $25k-50k, 2.4% for AGIs $50k-75k)
IRA payment deduction: $2,688 (reported on 1.2% of returns)
28669:
$2,688
North Carolina:
$2,967
Total itemized deductions: $14,377 (26% of AGI, reported on 17.6% of returns)
Here:
$14,377
State:
$19,464
Here:
26.3% of AGI
State:
22.7% of AGI
(% of AGI for various income ranges: 6.1% for AGIs $10k-25k, 7.3% for AGIs $25k-50k, 10.1% for AGIs $50k-75k, 14.9% for AGIs $75k-100k, 9.4% for AGIs over 100k)
Charity contributions deductions: $3,089 (5% of AGI, reported on 14.8% of returns)
Here:
$3,089
State:
$4,035
Here:
5.5% of AGI
State:
4.5% of AGI
(% of AGI for various income ranges: 0.7% for AGIs $10k-25k, 1.2% for AGIs $25k-50k, 2.2% for AGIs $50k-75k, 2.2% for AGIs $75k-100k, 2.7% for AGIs over 100k)
Total tax: $2,987 (reported on 71.2% of returns)
28669:
$2,987
State:
$7,257
(% of AGI for various income ranges: 5.7% for AGIs below $10k, 4.1% for AGIs $10k-25k, 6.2% for AGIs $25k-50k, 8.3% for AGIs $50k-75k, 9.4% for AGIs $75k-100k, 14.4% for AGIs over 100k)
Earned income credit: $1,664 (reported on 23.2% of returns)
Here:
$1,664
State:
$1,851
Percentage of individuals using paid preparers for their 2004 taxes: 77.8%
Here:
78%
State:
62%
(% for various income ranges: 70.3% for AGIs below $10k, 76.3% for AGIs $10k-25k, 83.0% for AGIs $25k-50k, 81.1% for AGIs $50k-75k, 82.4% for AGIs $75k-100k, 81.0% for AGIs over 100k)
Household received Food Stamps/SNAP in the past 12 months: 99 Household did not receive Food Stamps/SNAP in the past 12 months: 1,118
Women who had a birth in the past 12 months: 1 (0 now married, 0 unmarried) Women who did not have a birth in the past 12 months: 416 (250 now married, 167 unmarried)
Housing units in zip code 28669 with a mortgage: 367 (11 second mortgage) Houses without a mortgage: 48
Median monthly owner costs for units with a mortgage: $1,110 Median monthly owner costs for units without a mortgage: $360
Residents with income below the poverty level in 2022:
This zip code:
10.6%
Whole state:
12.8%
Median number of rooms in houses and condos:
Here:
5.7
State:
6.4
Median number of rooms in apartments:
Here:
4.5
State:
4.4
Notable locations in this zip code not listed on our city pages
Churches in zip code 28669 include: Union Grove Church (A), Brier Creek Baptist Church (B), White Plains Baptist Church (C), New Light Church (D), Oak Forest Baptist Church (E), Oak Level Church (F), Cranberry Church (G), Pleasant Home Church (H), Poplar Springs Missionary Baptist Church (I). Display/hide their locations on the map
Streams, rivers, and creeks: Brier Creek (A), Big Bugaboo Creek (B), Bee Branch (C), Stewart Creek (D), Roaring River (E), Muddy Branch (F), Long Branch (G), Little Bugaboo Creek (H). Display/hide their locations on the map
In group quarters: 6 (-1 institutionalized population)
Size of family households: 610 2-persons, 131 3-persons, 67 4-persons, 98 5-persons, 53 6-persons
Size of nonfamily households: 268 1-person
228 married couples with children.
5 single-parent households (5 women).
91.1% of residents of 28669 zip code speak English at home.
8.8% of residents speak Spanish at home (75% well, 25% not at all).
0.5% of residents speak other Indo-European language at home (100% very well).
Foreign born population: 147 (5.4%) (0.0% of them are naturalized citizens)
:
5.4%
Whole state:
8.6%
95%Costa Rica
28%American
11%English
7%Irish
4%Scottish
4%Scotch-Irish
3%German
2%European
Year of entry for the foreign-born population
12010 or later
1412000 to 2009
01990 to 1999
0Before 1990
Facilities with environmental interests located in this zip code:
BUDDY LEE SPICER (HIGHWAY 268 in ROARING RIVER, NC)
STATE MASTER (North Carolina facility info) - -115DA4YG00M69W84AY3W0BJVHB, WASTEWATER FACILITY National Pollutant Discharge Elimination System NON-MAJOR (Tracking pollutant discharge elimination systems) - permit Business SIC classification: INDUSTRIAL ORGANIC CHEMICALS
Housing units lacking complete plumbing facilities: 1.2% Housing units lacking complete kitchen facilities: 3.2%
69.0%Electricity
14.9%Fuel oil, kerosene, etc.
12.8%Bottled, tank, or LP gas
3.4%Wood
Population in 1990: 978. Population change in the 1990s: +1,983 (+202.8%).
Place of birth for U.S.-born residents:
This state: 2,082
Northeast: 169
Midwest: 48
South: 225
West: 9
69% of the 28669 zip code residents lived in the same house 5 years ago. Out of people who lived in different houses, 77% lived in this county. Out of people who lived in different counties, 50% lived in North Carolina.
97% of the 28669 zip code residents lived in the same house 1 year ago. Out of people who lived in different houses, 35% moved from this county. Out of people who lived in different houses, 71% moved from different county within same state. Out of people who lived in different houses, 2% moved from different state. Out of people who lived in different houses, 14% moved from abroad.
Private vs. public school enrollment:
Students in private schools in grades 1 to 8 (elementary and middle school):
Here:
0.0%
North Carolina:
13.8%
Students in private schools in grades 9 to 12 (high school): 22
Here:
47.2%
North Carolina:
11.9%
Students in private undergraduate colleges:
Here:
1.4%
North Carolina:
19.3%
Occupation by median earnings in the past 12 months ($)
260,419Farming, fishing, and forestry occupations
69,076Health diagnosing and treating practitioners and other technical occupations
50,975Sales and related occupations
49,299Production occupations
44,131Material moving occupations
35,390Office and administrative support occupations
Top industries in this zip code by the number of employees in 2005:
Real Estate and Rental and Leasing: General Rental Centers (5-9 employees: 1 establishment)
Other Services (except Public Administration): Commercial and Industrial Machinery and Equipment (except Automotive and Electronic) Repair and Maintenance (5-9: 1)
Administrative and Support and Waste Management and Remediation Services: Septic Tank and Related Services (5-9: 1)
Other Services (except Public Administration): Religious Organizations (1-4: 3)
Accommodation and Food Services: Full-Service Restaurants (1-4: 2)
People in group quarters in 2010:
4 people in workers' group living quarters and job corps centers
Fatal accident statistics in 2012:
Fatal accident count: 1
Vehicles involved in fatal accidents: 2
Fatal accidents caused by drunken drivers: 0
Fatalities: 1
Persons involved in fatal accidents: 2
Pedestrians involved in fatal accidents: 0
Fatal accident statistics in 2010:
Fatal accident count: 3
Vehicles involved in fatal accidents: 3
Fatal accidents caused by drunken drivers: 3
Fatalities: 4
Persons involved in fatal accidents: 5
Pedestrians involved in fatal accidents: 0
2003 - 2018 National Fire Incident Reporting System (NFIRS) incidents
According to the data from the years 2003 - 2018 the average number of fires per year is 10. The highest number of reported fire incidents - 27 took place in 2009, and the least - 2 in 2003. The data has a growing trend.
When looking into fire subcategories, the most incidents belonged to: Structure Fires (54.2%), and Outside Fires (35.7%).
Fire incident types reported to NFIRS in Zip Code 28669

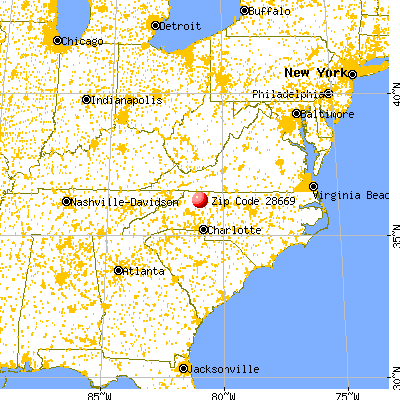


 Nearest zip codes: 28670, 28621, 28659, 28685, 28635, 28642.


 According to the data from the years 2003 - 2018 the average number of fires per year is 10. The highest number of reported fire incidents - 27 took place in 2009, and the least - 2 in 2003. The data has a growing trend.
 When looking into fire subcategories, the most incidents belonged to: Structure Fires (54.2%), and Outside Fires (35.7%).