Estimated zip code population in 2022: 4,959 Zip code population in 2010: 5,497 Zip code population in 2000: 5,310
Houses and condos: 2,529 Renter-occupied apartments: 474
% of renters here:
21%
State:
33%
March 2022 cost of living index in zip code 27011: 79.5 (low, U.S. average is 100)
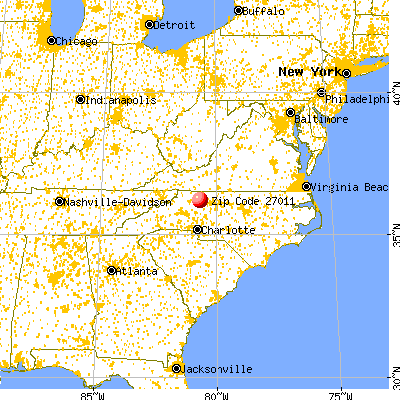
Land area: 53.2 sq. mi. Water area: 0.5 sq. mi.
Population density: 93 people per square mile
(very low).
OSM Map
General Map
Google Map
MSN Map
OSM Map
General Map
Google Map
MSN Map
OSM Map
General Map
Google Map
MSN Map
OSM Map
General Map
Google Map
MSN Map
Please wait while loading the map...
Real estate property taxes paid for housing units in 2022:
This zip code:
0.7% ($1,232)
North Carolina:
0.6% ($1,769)
Median real estate property taxes paid for housing units with mortgages in 2022: $1,394 (0.7%) Median real estate property taxes paid for housing units with no mortgage in 2022: $1,126 (0.7%)
Business Search- 14 Million verified businesses
Males: 2,365
(47.7%)
Females: 2,593
(52.3%)
For population 25 years and over in 27011:
High school or higher: 88.7%
Bachelor's degree or higher: 18.5%
Graduate or professional degree: 2.4%
Unemployed: 0.5%
Mean travel time to work (commute): 31.3 minutes
For population 15 years and over in 27011:
Never married: 25.4%
Now married: 54.6%
Separated: 0.8%
Widowed: 7.6%
Divorced: 11.7%
Zip code 27011 compared to state average:
Median house value below state average.
Unemployed percentage significantly below state average.
Black race population percentage significantly below state average.
Median age significantly above state average.
Foreign-born population percentage significantly below state average.
Renting percentage below state average.
Length of stay since moving in significantly above state average.
Percentage of population with a bachelor's degree or higher below state average.
Estimated median house/condo value in 2022: $182,169
27011:
$182,169
North Carolina:
$280,600
According to our research of North Carolina and other state lists, there were 9 registered sex offenders living in 27011 zip code as of July 17, 2024. The ratio of all residents to sex offenders in zip code 27011 is 620 to 1. The ratio of registered sex offenders to all residents in this zip code is lower than the state average.
Median resident age:
This zip code:
49.1 years
North Carolina median age:
39.2 years
Average household size:
This zip code:
2.2 people
North Carolina:
2.4 people
Averages for the 2020 tax year for zip code 27011, filed in 2021:
Average Adjusted Gross Income (AGI) in 2020: $48,709 (Individual Income Tax Returns)
Here:
$48,709
State:
$70,020
Salary/wage: $43,391 (reported on 80.9% of returns)
Here:
$43,391
State:
$58,387
(% of AGI for various income ranges: 1156.8% for AGIs below $25k, 3700.4% for AGIs $25k-50k, 6803.6% for AGIs $50k-75k, 8549.4% for AGIs $75k-100k, 14293.3% for AGIs $100k-200k)
Taxable interest for individuals: $1,019 (reported on 26.2% of returns)
This zip code:
$1,019
North Carolina:
$1,479
(% of AGI for various income ranges: 21.5% for AGIs below $25k, 15.1% for AGIs $25k-50k, 46.4% for AGIs $50k-75k, 51.8% for AGIs $75k-100k, 144.0% for AGIs $100k-200k)
Ordinary dividends: $3,681 (reported on 12.5% of returns)
Here:
$3,681
State:
$7,888
(% of AGI for various income ranges: 20.5% for AGIs below $25k, 24.7% for AGIs $25k-50k, 65.0% for AGIs $50k-75k, 81.8% for AGIs $75k-100k, 392.0% for AGIs $100k-200k)
Net capital gain/loss in AGI: +$7,655 (reported on 11.3% of returns)
Here:
+$7,655
State:
+$23,652
(% of AGI for various income ranges: 2.6% for AGIs below $25k, 33.6% for AGIs $25k-50k, 65.0% for AGIs $50k-75k, 179.4% for AGIs $75k-100k, 1020.7% for AGIs $100k-200k)
Profit/loss from business: +$9,264 (reported on 15.2% of returns)
Here:
+$9,264
State:
+$11,710
(% of AGI for various income ranges: 204.5% for AGIs below $25k, 141.3% for AGIs $25k-50k, 133.9% for AGIs $50k-75k, 147.6% for AGIs $75k-100k, 587.3% for AGIs $100k-200k)
Taxable individual retirement arrangement distribution: $13,607 (reported on 10.5% of returns)
27011:
$13,607
North Carolina:
$20,247
(% of AGI for various income ranges: 75.2% for AGIs below $25k, 87.8% for AGIs $25k-50k, 160.4% for AGIs $50k-75k, 474.7% for AGIs $75k-100k, 964.0% for AGIs $100k-200k)
Total itemized deductions: $26,256 (reported on 3.5% of returns)
Here:
$26,256
State:
$34,549
(% of AGI for various income ranges: 321.8% for AGIs $50k-75k, 525.3% for AGIs $100k-200k)
Charity contributions: $10,025 (reported on 3.1% of returns)
Here:
$10,025
State:
$13,360
(% of AGI for various income ranges: 26.0% for AGIs $25k-50k, 214.0% for AGIs $100k-200k)
Taxes paid: $6,367 (reported on 3.5% of returns)
27011:
$6,367
State:
$7,586
(% of AGI for various income ranges: 50.4% for AGIs $50k-75k, 147.3% for AGIs $100k-200k)
Earned income credit: $2,076 (reported on 19.1% of returns)
Here:
$2,076
State:
$2,337
(% of AGI for various income ranges: 96.2% for AGIs below $25k, 71.3% for AGIs $25k-50k)
Percentage of individuals using paid preparers for their 2020 taxes: 92.6%
Here:
93%
State:
93%
(% for various income ranges: 92.6% for AGIs below $25k, 94.3% for AGIs $25k-50k, 90.0% for AGIs $50k-75k, 95.8% for AGIs $75k-100k, 91.7% for AGIs $100k-200k, 75.0% for AGIs over 200k)
Averages for the 2012 tax year for zip code 27011, filed in 2013:
Average Adjusted Gross Income (AGI) in 2012: $40,946 (Individual Income Tax Returns)
Here:
$40,946
State:
$54,937
Salary/wage: $35,018 (reported on 82.6% of returns)
Here:
$35,018
State:
$46,336
(% of AGI for various income ranges: 73.3% for AGIs below $25k, 78.5% for AGIs $25k-50k, 78.2% for AGIs $50k-75k, 69.6% for AGIs $75k-100k, 88.6% for AGIs $100k-200k)
Taxable interest for individuals: $891 (reported on 33.0% of returns)
This zip code:
$891
North Carolina:
$1,298
(% of AGI for various income ranges: 1.3% for AGIs below $25k, 0.8% for AGIs $25k-50k, 0.7% for AGIs $50k-75k, 0.4% for AGIs $75k-100k, 0.9% for AGIs $100k-200k)
Ordinary dividends: $3,197 (reported on 13.8% of returns)
Here:
$3,197
State:
$6,213
(% of AGI for various income ranges: 0.9% for AGIs below $25k, 0.8% for AGIs $25k-50k, 0.6% for AGIs $50k-75k, 1.0% for AGIs $75k-100k, 3.2% for AGIs $100k-200k)
Net capital gain/loss in AGI: +$2,090 (reported on 12.9% of returns)
Here:
+$2,090
State:
+$12,740
(% of AGI for various income ranges: 0.7% for AGIs $25k-50k, 0.8% for AGIs $50k-75k, 0.2% for AGIs $75k-100k, 1.9% for AGIs $100k-200k)
Profit/loss from business: +$6,951 (reported on 15.6% of returns)
Here:
+$6,951
State:
+$10,311
(% of AGI for various income ranges: 7.8% for AGIs below $25k, 2.0% for AGIs $25k-50k, 1.4% for AGIs $50k-75k, 1.8% for AGIs $75k-100k, 3.6% for AGIs $100k-200k)
Taxable individual retirement arrangement distribution: $10,338 (reported on 11.6% of returns)
27011:
$10,338
North Carolina:
$15,575
(% of AGI for various income ranges: 3.6% for AGIs below $25k, 3.3% for AGIs $25k-50k, 2.4% for AGIs $50k-75k, 3.3% for AGIs $75k-100k, 3.8% for AGIs $100k-200k)
Total itemized deductions: $18,822 (24% of AGI, reported on 24.1% of returns)
Here:
$18,822
State:
$23,438
Here:
23.6% of AGI
State:
21.5% of AGI
(% of AGI for various income ranges: 7.2% for AGIs below $25k, 8.8% for AGIs $25k-50k, 9.9% for AGIs $50k-75k, 13.4% for AGIs $75k-100k, 16.6% for AGIs $100k-200k, 12.2% for AGIs over 200k)
Charity contributions: $4,158 (reported on 21.4% of returns)
Here:
$4,158
State:
$4,687
(% of AGI for various income ranges: 0.8% for AGIs below $25k, 1.4% for AGIs $25k-50k, 2.1% for AGIs $50k-75k, 2.9% for AGIs $75k-100k, 3.8% for AGIs $100k-200k, 2.3% for AGIs over 200k)
Taxes paid: $6,152 (reported on 24.1% of returns)
27011:
$6,152
State:
$8,823
(% of AGI for various income ranges: 1.1% for AGIs below $25k, 2.0% for AGIs $25k-50k, 2.8% for AGIs $50k-75k, 4.7% for AGIs $75k-100k, 6.5% for AGIs $100k-200k, 7.0% for AGIs over 200k)
Earned income credit: $2,304 (reported on 21.9% of returns)
Here:
$2,304
State:
$2,376
(% of AGI for various income ranges: 7.0% for AGIs below $25k, 1.2% for AGIs $25k-50k)
Percentage of individuals using paid preparers for their 2012 taxes: 65.2%
Here:
65%
State:
53%
(% for various income ranges: 64.6% for AGIs below $25k, 60.0% for AGIs $25k-50k, 66.7% for AGIs $50k-75k, 73.7% for AGIs $75k-100k, 72.7% for AGIs $100k-200k, 100.0% for AGIs over 200k)
Averages for the 2004 tax year for zip code 27011, filed in 2005:
Average Adjusted Gross Income (AGI) in 2004: $34,135 (Individual Income Tax Returns)
Here:
$34,135
State:
$45,376
Salary/wage: $30,982 (reported on 85.3% of returns)
Here:
$30,982
State:
$39,442
(% of AGI for various income ranges: 117.1% for AGIs below $10k, 75.8% for AGIs $10k-25k, 80.1% for AGIs $25k-50k, 81.1% for AGIs $50k-75k, 80.2% for AGIs $75k-100k, 59.0% for AGIs over 100k)
Taxable interest for individuals: $1,092 (reported on 37.5% of returns)
This zip code:
$1,092
North Carolina:
$1,515
(% of AGI for various income ranges: 6.0% for AGIs below $10k, 2.4% for AGIs $10k-25k, 1.0% for AGIs $25k-50k, 0.7% for AGIs $50k-75k, 1.0% for AGIs $75k-100k, 0.6% for AGIs over 100k)
Taxable dividends: $1,494 (reported on 19.7% of returns)
Here:
$1,494
State:
$4,016
(% of AGI for various income ranges: 2.0% for AGIs below $10k, 1.0% for AGIs $10k-25k, 0.8% for AGIs $25k-50k, 0.7% for AGIs $50k-75k, 0.9% for AGIs $75k-100k, 0.9% for AGIs over 100k)
Net capital gain/loss: +$2,720 (reported on 13.0% of returns)
Here:
+$2,720
State:
+$11,152
(% of AGI for various income ranges: -2.5% for AGIs below $10k, 0.4% for AGIs $10k-25k, 0.9% for AGIs $25k-50k, 0.7% for AGIs $50k-75k, 0.0% for AGIs $75k-100k, 4.0% for AGIs over 100k)
Profit/loss from business: +$3,780 (reported on 16.1% of returns)
Here:
+$3,780
State:
+$9,490
(% of AGI for various income ranges: 3.7% for AGIs below $10k, 4.2% for AGIs $10k-25k, 2.1% for AGIs $25k-50k, -0.9% for AGIs $50k-75k, 2.4% for AGIs $75k-100k, 2.5% for AGIs over 100k)
IRA payment deduction: $3,385 (reported on 1.8% of returns)
27011:
$3,385
North Carolina:
$2,967
Total itemized deductions: $15,368 (25% of AGI, reported on 26.9% of returns)
Here:
$15,368
State:
$19,464
Here:
24.9% of AGI
State:
22.7% of AGI
(% of AGI for various income ranges: 9.3% for AGIs below $10k, 8.3% for AGIs $10k-25k, 10.5% for AGIs $25k-50k, 13.8% for AGIs $50k-75k, 15.1% for AGIs $75k-100k, 13.6% for AGIs over 100k)
Charity contributions deductions: $3,303 (5% of AGI, reported on 22.9% of returns)
Here:
$3,303
State:
$4,035
Here:
5.1% of AGI
State:
4.5% of AGI
(% of AGI for various income ranges: 0.8% for AGIs below $10k, 1.0% for AGIs $10k-25k, 1.8% for AGIs $25k-50k, 2.6% for AGIs $50k-75k, 3.3% for AGIs $75k-100k, 2.7% for AGIs over 100k)
Total tax: $4,158 (reported on 70.0% of returns)
27011:
$4,158
State:
$7,257
(% of AGI for various income ranges: 4.4% for AGIs below $10k, 3.5% for AGIs $10k-25k, 5.8% for AGIs $25k-50k, 8.3% for AGIs $50k-75k, 10.2% for AGIs $75k-100k, 18.0% for AGIs over 100k)
Earned income credit: $1,753 (reported on 20.4% of returns)
Here:
$1,753
State:
$1,851
Percentage of individuals using paid preparers for their 2004 taxes: 71.8%
Here:
72%
State:
62%
(% for various income ranges: 66.4% for AGIs below $10k, 73.5% for AGIs $10k-25k, 73.5% for AGIs $25k-50k, 71.5% for AGIs $50k-75k, 68.7% for AGIs $75k-100k, 83.3% for AGIs over 100k)
Likely homosexual households (counted as self-reported same-sex unmarried-partner households)
Lesbian couples: 0.6% of all households
Gay men: 0.0% of all households
Household received Food Stamps/SNAP in the past 12 months: 267 Household did not receive Food Stamps/SNAP in the past 12 months: 1,990
Women who had a birth in the past 12 months: 37 (1 now married, 34 unmarried) Women who did not have a birth in the past 12 months: 1,051 (490 now married, 562 unmarried)
Housing units in zip code 27011 with a mortgage: 914 (77 second mortgage, 81 both second mortgage and home equity loan) Houses without a mortgage: 71
Median monthly owner costs for units with a mortgage: $1,158 Median monthly owner costs for units without a mortgage: $337
Residents with income below the poverty level in 2022:
This zip code:
11.7%
Whole state:
12.8%
Residents with income below 50% of the poverty level in 2022:
This zip code:
6.3%
Whole state:
6.8%
Median number of rooms in houses and condos:
Here:
6.0
State:
6.4
Median number of rooms in apartments:
Here:
4.2
State:
4.4
Notable locations in this zip code not listed on our city pages
Churches in zip code 27011 include: Union Grove Baptist Church (A), Richmond Hill Baptist Church (B), Mount Pleasant United Methodist Church (C), Boonville United Methodist Church (D), Mitchell's Chapel United Methodist Church (E), Boonville First Presbyterian Church (F), Boonville Baptist Church (G), Mount Nebo Holy Church (H), North Oak Ridge Baptist Church (I). Display/hide their locations on the map
Cemeteries: Charity Cemetery (1), Shady Grove Cemetery (2), Richmond Hill Cemetery (3), North Oak Ridge Cemetery (4), Mount Pleasant Cemetery (5), Mitchells Chapel Cemetery (6), Clarks Memorial Cemetery (7). Display/hide their locations on the map
Reservoirs: Deep Creek W/S Number Sixteen (A), Jim Frazier Lake (B), Twiman Candle Lake (C), Arnie Shore Lake (D), Fax Brown Lake (E), Howard Lake (F), Gray Casstevens Lake (G), Deep Creek W/S Structure Number Six B (H). Display/hide their locations on the map
In group quarters: 18 (-1 institutionalized population)
Size of family households: 922 2-persons, 311 3-persons, 210 4-persons, 40 5-persons, 8 6-persons
Size of nonfamily households: 753 1-person, 16 2-persons
488 married couples with children.
317 single-parent households (30 men, 287 women).
94.8% of residents of 27011 zip code speak English at home.
4.5% of residents speak Spanish at home (56% very well, 17% well, 13% not well, 14% not at all).
0.4% of residents speak other Indo-European language at home (100% very well).
Foreign born population: 167 (3.4%) (37.6% of them are naturalized citizens)
This zip code:
3.4%
Whole state:
8.6%
65%Honduras
19%Chile
11%Bhutan
27%American
23%English
8%German
6%Irish
4%Scottish
2%European
1%French
Year of entry for the foreign-born population
992010 or later
102000 to 2009
211990 to 1999
45Before 1990
Facilities with environmental interests located in this zip code:
BOONEVILLE, TOWN OF (110 CAROLINA AVENUE NORTH in BOONVILLE, NC)
STATE MASTER (North Carolina facility info) - DRINKING WATER PROGRAM, -3M05FMYG00A6SWJ4F5QE04UM7K, WASTEWATER FACILITY, -NC0299020, DRINKING WATER PROGRAM STATE MASTER (North Carolina facility info) - -115DA4YG00M69W84AY3V8EAPHE, WASTEWATER FACILITY National Pollutant Discharge Elimination System NON-MAJOR (Tracking pollutant discharge elimination systems) - permit Business SIC classification: SEWERAGE SYSTEMS; NONCLASSIFIABLE ESTABLISHMENTS Alternative names: BOONVILLE, TOWN - WWTP, TOWN OF BOONVILLE
BOONVILLE ELEMENTARY SCHOOL (232 EAST MAIN STREET in BOONVILLE, NC)
STATE MASTER (North Carolina facility info) - UNDERGROUND STORAGE TANK PROGRAM (National Center for Education Statistics) - STATE ID-304 Business SIC classification: NONCLASSIFIABLE ESTABLISHMENTS Organizations: YADKIN COUNTY SCHOOLS (SCHOOL DISTRICT)
ASTORIA BRAID MFG CO INC (WEST MAIN ST #206 in BOONEVILLE, NC)
(Resource Conservation and Recovery Act (tracking hazardous waste)) Organizations: AJ STAMMETTI (CONTACT/OWNER)
, WILLIAM STAMMETTI (CONTACT/OWNER)
BORDEN CHEMICAL/SMITH DOUGLAS (NC HWY 67 in BOONVILLE, NC)
(Resource Conservation and Recovery Act (tracking hazardous waste))
ALEMITE CORP (112 RIVER RD in BOONVILLE, NC)
Conditionally Exempt Small Quantity Generators, less than 100 kg/month of hazardous waste (Resource Conservation and Recovery Act (tracking hazardous waste)) - notification Organizations: BRITISH TIRE & RUBBER INC (CONTACT/OWNER)
CAROLINA ENVIRONMENTAL SPECIALISTS (7925 HWY 601 N in BOONVILLE, NC)
Conditionally Exempt Small Quantity Generators, less than 100 kg/month of hazardous waste (Resource Conservation and Recovery Act (tracking hazardous waste)) - notification Organizations: ROBERT D STANLEY/ROBERT CUMMINGS (CONTACT/OWNER)
Housing units lacking complete plumbing facilities: 1.0% Housing units lacking complete kitchen facilities: 3.3%
80.4%Electricity
9.6%Fuel oil, kerosene, etc.
6.0%Bottled, tank, or LP gas
2.0%Wood
1.3%No fuel used
0.8%Utility gas
Population in 1990: 262. Population change in the 1990s: +5,048 (+1926.7%).
Place of birth for U.S.-born residents:
This state: 3,773
Northeast: 107
Midwest: 233
South: 532
West: 84
68% of the 27011 zip code residents lived in the same house 5 years ago. Out of people who lived in different houses, 59% lived in this county. Out of people who lived in different counties, 50% lived in North Carolina.
97% of the 27011 zip code residents lived in the same house 1 year ago. Out of people who lived in different houses, 34% moved from this county. Out of people who lived in different houses, 57% moved from different county within same state. Out of people who lived in different houses, 28% moved from different state. Out of people who lived in different houses, 2% moved from abroad.
Private vs. public school enrollment:
Students in private schools in grades 1 to 8 (elementary and middle school): 41
Here:
11.6%
North Carolina:
13.8%
Students in private schools in grades 9 to 12 (high school):
Here:
0.0%
North Carolina:
11.9%
Students in private undergraduate colleges:
Here:
0.0%
North Carolina:
19.3%
Occupation by median earnings in the past 12 months ($)
117,724Computer and mathematical occupations
73,531Installation, maintenance, and repair occupations
72,202Management occupations
71,268Health diagnosing and treating practitioners and other technical occupations
68,926Health technologists and technicians
64,186Transportation occupations
Top industries in this zip code by the number of employees in 2005:
Health Care and Social Assistance: Other Individual and Family Services (100-249 employees: 1 establishment)
Professional, Scientific, and Technical Services: Payroll Services (50-99: 1)
Health Care and Social Assistance: Services for the Elderly and Persons with Disabilities (50-99: 1)
Health Care and Social Assistance: Home Health Care Services (20-49: 1)
Construction: New Single-Family Housing Construction (except Operative Builders) (10-19: 1, 1-4: 4)
Other Services (except Public Administration): Religious Organizations (5-9: 2, 1-4: 4)
Wholesale Trade: Automobile and Other Motor Vehicle Merchant Wholesalers (10-19: 1, 1-4: 1)
People in group quarters in 2000:
11 people in other group homes
5 people in homes for the mentally retarded
Fatal accident statistics in 2013:
Fatal accident count: 1
Vehicles involved in fatal accidents: 1
Fatal accidents caused by drunken drivers: 0
Fatalities: 1
Persons involved in fatal accidents: 1
Pedestrians involved in fatal accidents: 0
Fatal accident statistics in 2012:
Fatal accident count: 1
Vehicles involved in fatal accidents: 1
Fatal accidents caused by drunken drivers: 1
Fatalities: 1
Persons involved in fatal accidents: 1
Pedestrians involved in fatal accidents: 0
Home Mortgage Disclosure Act Aggregated Statistics For Year 2009 (Based on 4 partial tracts)
A) FHA, FSA/RHS & VA Home Purchase Loans
B) Conventional Home Purchase Loans
C) Refinancings
D) Home Improvement Loans
E) Loans on Dwellings For 5+ Families
F) Non-occupant Loans on < 5 Family Dwellings (A B C & D)
G) Loans On Manufactured Home Dwelling (A B C & D)
Number
Average Value
Number
Average Value
Number
Average Value
Number
Average Value
Number
Average Value
Number
Average Value
Number
Average Value
LOANS ORIGINATED
30
$125,045
27
$120,002
128
$138,788
4
$24,862
1
$690,340
11
$62,694
20
$58,984
APPLICATIONS APPROVED, NOT ACCEPTED
4
$111,630
3
$78,337
8
$194,345
0
$0
0
$0
1
$13,980
3
$66,097
APPLICATIONS DENIED
6
$94,797
7
$124,086
57
$143,684
5
$68,908
0
$0
4
$73,630
9
$92,711
APPLICATIONS WITHDRAWN
3
$75,323
3
$140,513
23
$190,928
0
$0
0
$0
2
$64,710
3
$102,683
FILES CLOSED FOR INCOMPLETENESS
2
$98,465
0
$0
7
$88,467
1
$145,920
0
$0
0
$0
1
$16,420
Aggregated Statistics For Year 2008 (Based on 4 partial tracts)
A) FHA, FSA/RHS & VA Home Purchase Loans
B) Conventional Home Purchase Loans
C) Refinancings
D) Home Improvement Loans
F) Non-occupant Loans on < 5 Family Dwellings (A B C & D)
G) Loans On Manufactured Home Dwelling (A B C & D)
Number
Average Value
Number
Average Value
Number
Average Value
Number
Average Value
Number
Average Value
Number
Average Value
LOANS ORIGINATED
28
$106,379
37
$149,732
74
$102,983
14
$52,714
16
$139,118
16
$72,798
APPLICATIONS APPROVED, NOT ACCEPTED
0
$0
2
$88,770
21
$109,483
1
$13,220
3
$39,310
2
$41,485
APPLICATIONS DENIED
3
$117,943
13
$97,292
75
$104,421
21
$30,939
6
$63,362
17
$75,567
APPLICATIONS WITHDRAWN
0
$0
4
$121,112
38
$128,614
1
$94,850
0
$0
9
$93,711
FILES CLOSED FOR INCOMPLETENESS
1
$42,560
0
$0
6
$124,603
0
$0
0
$0
1
$118,970
Aggregated Statistics For Year 2007 (Based on 4 partial tracts)
A) FHA, FSA/RHS & VA Home Purchase Loans
B) Conventional Home Purchase Loans
C) Refinancings
D) Home Improvement Loans
F) Non-occupant Loans on < 5 Family Dwellings (A B C & D)
G) Loans On Manufactured Home Dwelling (A B C & D)
Number
Average Value
Number
Average Value
Number
Average Value
Number
Average Value
Number
Average Value
Number
Average Value
LOANS ORIGINATED
17
$100,886
50
$104,721
113
$103,703
12
$56,215
17
$103,856
22
$66,223
APPLICATIONS APPROVED, NOT ACCEPTED
0
$0
7
$78,450
24
$91,059
2
$64,470
3
$58,000
6
$48,835
APPLICATIONS DENIED
0
$0
23
$71,411
113
$111,505
14
$48,159
8
$76,690
15
$79,141
APPLICATIONS WITHDRAWN
0
$0
4
$137,008
39
$105,654
3
$50,860
0
$0
4
$90,720
FILES CLOSED FOR INCOMPLETENESS
1
$24,320
4
$97,308
16
$130,418
0
$0
1
$37,700
0
$0
Aggregated Statistics For Year 2006 (Based on 4 partial tracts)
A) FHA, FSA/RHS & VA Home Purchase Loans
B) Conventional Home Purchase Loans
C) Refinancings
D) Home Improvement Loans
F) Non-occupant Loans on < 5 Family Dwellings (A B C & D)
G) Loans On Manufactured Home Dwelling (A B C & D)
Number
Average Value
Number
Average Value
Number
Average Value
Number
Average Value
Number
Average Value
Number
Average Value
LOANS ORIGINATED
15
$127,882
68
$89,127
140
$87,994
15
$40,309
17
$74,723
17
$45,600
APPLICATIONS APPROVED, NOT ACCEPTED
1
$79,320
12
$115,917
26
$106,140
4
$17,188
1
$15,200
10
$54,807
APPLICATIONS DENIED
3
$53,627
38
$83,806
113
$107,829
28
$61,093
3
$63,747
39
$83,503
APPLICATIONS WITHDRAWN
2
$112,805
9
$99,596
42
$105,941
3
$39,207
1
$113,100
6
$81,347
FILES CLOSED FOR INCOMPLETENESS
0
$0
4
$65,507
14
$132,333
0
$0
1
$60,800
2
$85,480
Aggregated Statistics For Year 2005 (Based on 4 partial tracts)
A) FHA, FSA/RHS & VA Home Purchase Loans
B) Conventional Home Purchase Loans
C) Refinancings
D) Home Improvement Loans
E) Loans on Dwellings For 5+ Families
F) Non-occupant Loans on < 5 Family Dwellings (A B C & D)
G) Loans On Manufactured Home Dwelling (A B C & D)
Number
Average Value
Number
Average Value
Number
Average Value
Number
Average Value
Number
Average Value
Number
Average Value
Number
Average Value
LOANS ORIGINATED
14
$86,463
83
$109,267
120
$81,858
20
$25,748
0
$0
13
$65,507
40
$68,128
APPLICATIONS APPROVED, NOT ACCEPTED
1
$89,600
13
$81,277
25
$82,807
4
$48,308
0
$0
3
$63,647
10
$70,408
APPLICATIONS DENIED
4
$123,065
30
$67,126
126
$107,864
17
$48,096
0
$0
5
$42,666
40
$71,115
APPLICATIONS WITHDRAWN
3
$90,317
19
$95,022
55
$121,780
8
$120,361
1
$177,720
4
$74,838
11
$82,625
FILES CLOSED FOR INCOMPLETENESS
0
$0
1
$111,630
11
$102,888
1
$7,340
0
$0
0
$0
1
$155,690
Aggregated Statistics For Year 2004 (Based on 4 partial tracts)
A) FHA, FSA/RHS & VA Home Purchase Loans
B) Conventional Home Purchase Loans
C) Refinancings
D) Home Improvement Loans
F) Non-occupant Loans on < 5 Family Dwellings (A B C & D)
G) Loans On Manufactured Home Dwelling (A B C & D)
Number
Average Value
Number
Average Value
Number
Average Value
Number
Average Value
Number
Average Value
Number
Average Value
LOANS ORIGINATED
9
$88,944
69
$78,318
144
$90,163
16
$45,032
10
$55,455
37
$60,702
APPLICATIONS APPROVED, NOT ACCEPTED
0
$0
29
$68,033
35
$94,458
9
$26,846
3
$64,810
28
$57,060
APPLICATIONS DENIED
6
$87,483
53
$73,419
107
$97,102
24
$17,666
4
$58,098
62
$59,715
APPLICATIONS WITHDRAWN
1
$88,770
14
$72,984
42
$107,265
0
$0
4
$120,810
4
$68,800
FILES CLOSED FOR INCOMPLETENESS
1
$90,590
1
$134,980
15
$107,635
1
$8,810
0
$0
1
$64,450
Aggregated Statistics For Year 2003 (Based on 4 partial tracts)
A) FHA, FSA/RHS & VA Home Purchase Loans
B) Conventional Home Purchase Loans
C) Refinancings
D) Home Improvement Loans
F) Non-occupant Loans on < 5 Family Dwellings (A B C & D)
Number
Average Value
Number
Average Value
Number
Average Value
Number
Average Value
Number
Average Value
LOANS ORIGINATED
12
$98,350
78
$92,037
265
$103,357
18
$22,441
23
$50,166
APPLICATIONS APPROVED, NOT ACCEPTED
0
$0
17
$69,291
40
$91,437
1
$60,800
3
$48,470
APPLICATIONS DENIED
4
$40,128
45
$67,147
110
$101,697
15
$13,618
14
$41,189
APPLICATIONS WITHDRAWN
3
$121,910
13
$89,616
51
$101,744
1
$110,160
1
$58,370
FILES CLOSED FOR INCOMPLETENESS
1
$164,510
1
$165,970
5
$135,686
0
$0
0
$0
Aggregated Statistics For Year 2002 (Based on 2 partial tracts)
A) FHA, FSA/RHS & VA Home Purchase Loans
B) Conventional Home Purchase Loans
C) Refinancings
D) Home Improvement Loans
F) Non-occupant Loans on < 5 Family Dwellings (A B C & D)
Number
Average Value
Number
Average Value
Number
Average Value
Number
Average Value
Number
Average Value
LOANS ORIGINATED
9
$104,774
47
$90,909
128
$95,288
4
$52,878
12
$51,530
APPLICATIONS APPROVED, NOT ACCEPTED
0
$0
38
$56,781
24
$71,726
1
$41,130
6
$56,060
APPLICATIONS DENIED
0
$0
37
$54,147
69
$90,150
12
$17,992
1
$95,470
APPLICATIONS WITHDRAWN
1
$167,440
6
$126,562
38
$82,176
0
$0
0
$0
FILES CLOSED FOR INCOMPLETENESS
1
$151,290
0
$0
6
$55,325
0
$0
0
$0
Aggregated Statistics For Year 2001 (Based on 2 partial tracts)
A) FHA, FSA/RHS & VA Home Purchase Loans
B) Conventional Home Purchase Loans
C) Refinancings
D) Home Improvement Loans
F) Non-occupant Loans on < 5 Family Dwellings (A B C & D)
Number
Average Value
Number
Average Value
Number
Average Value
Number
Average Value
Number
Average Value
LOANS ORIGINATED
12
$93,758
59
$75,307
103
$88,199
13
$14,236
16
$47,277
APPLICATIONS APPROVED, NOT ACCEPTED
3
$98,410
18
$46,349
22
$63,092
0
$0
0
$0
APPLICATIONS DENIED
0
$0
43
$56,019
78
$80,068
15
$11,261
6
$58,018
APPLICATIONS WITHDRAWN
0
$0
1
$111,630
10
$76,231
4
$47,002
1
$64,630
FILES CLOSED FOR INCOMPLETENESS
0
$0
1
$129,250
7
$111,839
0
$0
0
$0
Aggregated Statistics For Year 2000 (Based on 2 partial tracts)
A) FHA, FSA/RHS & VA Home Purchase Loans
B) Conventional Home Purchase Loans
C) Refinancings
D) Home Improvement Loans
F) Non-occupant Loans on < 5 Family Dwellings (A B C & D)
Number
Average Value
Number
Average Value
Number
Average Value
Number
Average Value
Number
Average Value
LOANS ORIGINATED
7
$97,360
48
$64,046
47
$65,971
21
$16,297
12
$70,012
APPLICATIONS APPROVED, NOT ACCEPTED
3
$64,137
31
$44,017
18
$83,803
7
$49,520
3
$48,960
APPLICATIONS DENIED
0
$0
84
$47,963
54
$61,581
7
$8,813
1
$146,880
APPLICATIONS WITHDRAWN
0
$0
7
$71,131
26
$86,038
1
$138,070
0
$0
FILES CLOSED FOR INCOMPLETENESS
0
$0
1
$110,160
9
$70,992
0
$0
1
$201,230
Aggregated Statistics For Year 1999 (Based on 2 partial tracts)
A) FHA, FSA/RHS & VA Home Purchase Loans
B) Conventional Home Purchase Loans
C) Refinancings
D) Home Improvement Loans
F) Non-occupant Loans on < 5 Family Dwellings (A B C & D)
Detailed PMIC statistics for the following Tracts:0501.02
, 0502.00
2002 - 2018 National Fire Incident Reporting System (NFIRS) incidents
Based on the data from the years 2002 - 2018 the average number of fire incidents per year is 35. The highest number of reported fires - 65 took place in 2014, and the least - 4 in 2003. The data has a growing trend.
When looking into fire subcategories, the most reports belonged to: Structure Fires (46.2%), and Outside Fires (39.9%).
Fire incident types reported to NFIRS in Zip Code 27011


 Nearest zip codes: 28642, 27055, 27020, 27047, 27017, 27018.


 Based on the data from the years 2002 - 2018 the average number of fire incidents per year is 35. The highest number of reported fires - 65 took place in 2014, and the least - 4 in 2003. The data has a growing trend.
 When looking into fire subcategories, the most reports belonged to: Structure Fires (46.2%), and Outside Fires (39.9%).