Estimated zip code population in 2022: 3,057 Zip code population in 2010: 2,701 Zip code population in 2000: 3,465
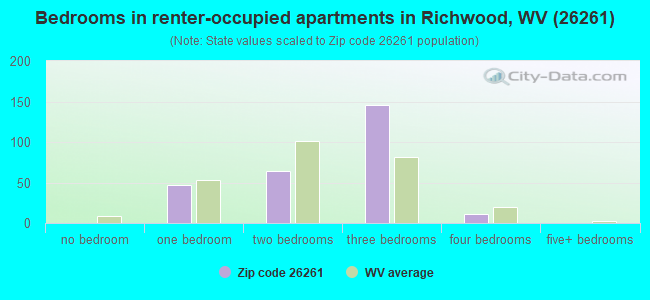
Houses and condos: 1,741 Renter-occupied apartments: 262
% of renters here:
21%
State:
26%
March 2022 cost of living index in zip code 26261: 83.3 (low, U.S. average is 100)
Land area: 98.7 sq. mi. Water area: 0.5 sq. mi.
Population density: 31 people per square mile
(very low).
OSM Map
General Map
Google Map
MSN Map
OSM Map
General Map
Google Map
MSN Map
OSM Map
General Map
Google Map
MSN Map
OSM Map
General Map
Google Map
MSN Map
Please wait while loading the map...
Real estate property taxes paid for housing units in 2022:
This zip code:
0.6% ($360)
West Virginia:
0.5% ($821)
Median real estate property taxes paid for housing units with mortgages in 2022: $859 (0.7%) Median real estate property taxes paid for housing units with no mortgage in 2022: $289 (0.5%)
Business Search- 14 Million verified businesses
Males: 1,375
(45.0%)
Females: 1,683
(55.0%)
For population 25 years and over in 26261:
High school or higher: 88.4%
Bachelor's degree or higher: 12.4%
Graduate or professional degree: 1.1%
Unemployed: 13.4%
Mean travel time to work (commute): 38.5 minutes
For population 15 years and over in 26261:
Never married: 19.5%
Now married: 42.9%
Separated: 1.7%
Widowed: 12.7%
Divorced: 23.3%
Zip code 26261 compared to state average:
Median household income below state average.
Median house value significantly below state average.
Unemployed percentage above state average.
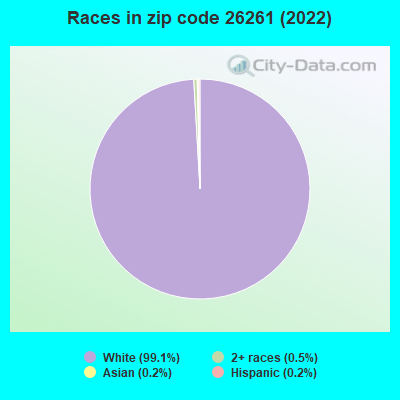
Black race population percentage significantly below state average.
Hispanic race population percentage significantly below state average.
Median age above state average.
Foreign-born population percentage significantly below state average.
Length of stay since moving in significantly above state average.
Number of college students significantly below state average.
Percentage of population with a bachelor's degree or higher below state average.
Averages for the 2020 tax year for zip code 26261, filed in 2021:
Average Adjusted Gross Income (AGI) in 2020: $38,017 (Individual Income Tax Returns)
Here:
$38,017
State:
$56,292
Salary/wage: $31,607 (reported on 78.9% of returns)
Here:
$31,607
State:
$49,093
(% of AGI for various income ranges: 1053.7% for AGIs below $25k, 3325.0% for AGIs $25k-50k, 5732.9% for AGIs $50k-75k, 4775.0% for AGIs $75k-100k)
Taxable interest for individuals: $525 (reported on 15.8% of returns)
This zip code:
$525
West Virginia:
$1,141
(% of AGI for various income ranges: 3.3% for AGIs below $25k, 14.4% for AGIs $25k-50k, 11.4% for AGIs $50k-75k, 38.3% for AGIs $75k-100k)
Ordinary dividends: $2,140 (reported on 6.6% of returns)
Here:
$2,140
State:
$5,456
(% of AGI for various income ranges: 21.1% for AGIs below $25k, 71.4% for AGIs $50k-75k)
Net capital gain/loss in AGI: +$4,300 (reported on 6.6% of returns)
Here:
+$4,300
State:
+$11,656
(% of AGI for various income ranges: 8.5% for AGIs below $25k, 274.3% for AGIs $50k-75k)
Profit/loss from business: +$5,583 (reported on 7.9% of returns)
Here:
+$5,583
State:
+$12,084
(% of AGI for various income ranges: 73.3% for AGIs below $25k, 85.6% for AGIs $25k-50k)
Taxable individual retirement arrangement distribution: $10,100 (reported on 6.6% of returns)
26261:
$10,100
West Virginia:
$15,311
(% of AGI for various income ranges: 315.6% for AGIs $25k-50k)
Earned income credit: $2,589 (reported on 25.0% of returns)
Here:
$2,589
State:
$2,258
(% of AGI for various income ranges: 121.9% for AGIs below $25k, 101.9% for AGIs $25k-50k)
Percentage of individuals using paid preparers for their 2020 taxes: 85.5%
Here:
86%
State:
93%
(% for various income ranges: 86.1% for AGIs below $25k, 81.0% for AGIs $25k-50k, 88.9% for AGIs $50k-75k, 100.0% for AGIs $75k-100k, 80.0% for AGIs $100k-200k)
Averages for the 2012 tax year for zip code 26261, filed in 2013:
Average Adjusted Gross Income (AGI) in 2012: $32,400 (Individual Income Tax Returns)
Here:
$32,400
State:
$48,628
Salary/wage: $29,242 (reported on 82.2% of returns)
Here:
$29,242
State:
$42,328
(% of AGI for various income ranges: 72.6% for AGIs below $25k, 73.8% for AGIs $25k-50k, 86.0% for AGIs $50k-75k, 72.3% for AGIs $75k-100k, 65.7% for AGIs $100k-200k)
Taxable interest for individuals: $810 (reported on 22.2% of returns)
This zip code:
$810
West Virginia:
$1,211
(% of AGI for various income ranges: 0.7% for AGIs below $25k, 1.0% for AGIs $25k-50k, 0.1% for AGIs $50k-75k, 0.7% for AGIs $75k-100k)
Ordinary dividends: $2,929 (reported on 7.8% of returns)
Here:
$2,929
State:
$4,262
(% of AGI for various income ranges: 1.7% for AGIs below $25k, 0.9% for AGIs $25k-50k, 0.5% for AGIs $50k-75k)
Profit/loss from business: +$9,230 (reported on 11.1% of returns)
Here:
+$9,230
State:
+$13,636
(% of AGI for various income ranges: 6.7% for AGIs below $25k, 2.7% for AGIs $25k-50k, 5.4% for AGIs $50k-75k)
Taxable individual retirement arrangement distribution: $9,080 (reported on 5.6% of returns)
26261:
$9,080
West Virginia:
$11,787
Total itemized deductions: $17,520 (22% of AGI, reported on 5.6% of returns)
Here:
$17,520
State:
$21,148
Here:
22.0% of AGI
State:
18.1% of AGI
Charity contributions: $5,600 (reported on 3.3% of returns)
Here:
$5,600
State:
$4,508
Taxes paid: $5,340 (reported on 5.6% of returns)
26261:
$5,340
State:
$8,103
Earned income credit: $2,431 (reported on 28.9% of returns)
Here:
$2,431
State:
$2,140
(% of AGI for various income ranges: 9.1% for AGIs below $25k, 1.2% for AGIs $25k-50k)
Percentage of individuals using paid preparers for their 2012 taxes: 46.7%
Here:
47%
State:
49%
(% for various income ranges: 41.3% for AGIs below $25k, 46.2% for AGIs $25k-50k, 55.6% for AGIs $50k-75k, 60.0% for AGIs $75k-100k, 75.0% for AGIs $100k-200k)
Averages for the 2004 tax year for zip code 26261, filed in 2005:
Average Adjusted Gross Income (AGI) in 2004: $25,989 (Individual Income Tax Returns)
Here:
$25,989
State:
$37,498
Salary/wage: $24,232 (reported on 83.4% of returns)
Here:
$24,232
State:
$33,645
(% of AGI for various income ranges: 70.6% for AGIs below $10k, 78.6% for AGIs $10k-25k, 81.6% for AGIs $25k-50k, 79.2% for AGIs $50k-75k, 83.3% for AGIs $75k-100k, 61.5% for AGIs over 100k)
Taxable interest for individuals: $1,987 (reported on 31.1% of returns)
This zip code:
$1,987
West Virginia:
$1,465
(% of AGI for various income ranges: 2.7% for AGIs below $10k, 2.1% for AGIs $10k-25k, 2.1% for AGIs $25k-50k, 1.4% for AGIs $50k-75k, 4.9% for AGIs $75k-100k, 3.4% for AGIs over 100k)
Taxable dividends: $1,639 (reported on 12.1% of returns)
Here:
$1,639
State:
$2,913
(% of AGI for various income ranges: 0.4% for AGIs below $10k, 1.0% for AGIs $10k-25k, 1.0% for AGIs $25k-50k, 0.8% for AGIs $50k-75k, 0.2% for AGIs over 100k)
Net capital gain/loss: +$1,230 (reported on 7.4% of returns)
Here:
+$1,230
State:
+$6,331
(% of AGI for various income ranges: 0.1% for AGIs below $10k, -0.1% for AGIs $10k-25k, 0.4% for AGIs $25k-50k, -0.1% for AGIs $50k-75k, 2.2% for AGIs over 100k)
Profit/loss from business: +$9,046 (reported on 13.0% of returns)
Here:
+$9,046
State:
+$11,074
(% of AGI for various income ranges: 8.6% for AGIs below $10k, 1.6% for AGIs $10k-25k, 2.3% for AGIs $25k-50k, 0.0% for AGIs $50k-75k, 26.9% for AGIs over 100k)
IRA payment deduction: $2,308 (reported on 1.3% of returns)
26261:
$2,308
West Virginia:
$2,796
Total itemized deductions: $16,828 (23% of AGI, reported on 5.8% of returns)
Here:
$16,828
State:
$16,976
Here:
22.7% of AGI
State:
19.0% of AGI
Charity contributions deductions: $4,095 (5% of AGI, reported on 4.2% of returns)
Here:
$4,095
State:
$3,529
Here:
5.1% of AGI
State:
3.7% of AGI
(% of AGI for various income ranges: 0.4% for AGIs $10k-25k, 1.2% for AGIs $50k-75k, 2.9% for AGIs over 100k)
Total tax: $3,142 (reported on 63.9% of returns)
26261:
$3,142
State:
$5,372
(% of AGI for various income ranges: 2.2% for AGIs below $10k, 3.3% for AGIs $10k-25k, 6.4% for AGIs $25k-50k, 9.0% for AGIs $50k-75k, 11.3% for AGIs $75k-100k, 18.1% for AGIs over 100k)
Earned income credit: $1,850 (reported on 23.3% of returns)
Here:
$1,850
State:
$1,662
Percentage of individuals using paid preparers for their 2004 taxes: 50.7%
Here:
51%
State:
55%
(% for various income ranges: 40.4% for AGIs below $10k, 52.2% for AGIs $10k-25k, 56.6% for AGIs $25k-50k, 55.7% for AGIs $50k-75k, 44.4% for AGIs $75k-100k, 86.4% for AGIs over 100k)
Household received Food Stamps/SNAP in the past 12 months: 394 Household did not receive Food Stamps/SNAP in the past 12 months: 859
Women who had a birth in the past 12 months: 8 (8 now married, 0 unmarried) Women who did not have a birth in the past 12 months: 640 (202 now married, 439 unmarried)
Housing units in zip code 26261 with a mortgage: 266 (2 second mortgage, 3 home equity loan) Houses without a mortgage: 5
Median monthly owner costs for units with a mortgage: $1,084 Median monthly owner costs for units without a mortgage: $299
Residents with income below the poverty level in 2022:
This zip code:
30.9%
Whole state:
17.9%
Residents with income below 50% of the poverty level in 2022:
This zip code:
21.8%
Whole state:
9.7%
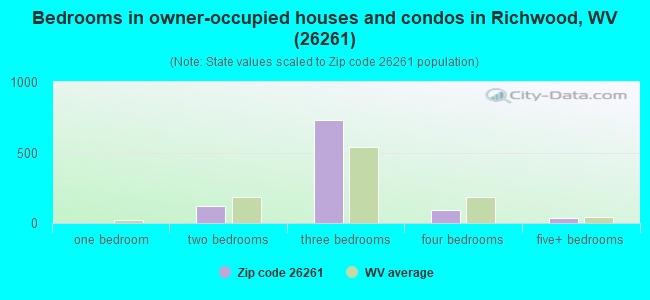
Median number of rooms in houses and condos:
Here:
7.2
State:
6.5
Median number of rooms in apartments:
Here:
5.5
State:
4.7
Notable locations in this zip code not listed on our city pages
Notable locations in zip code 26261: Woodbine Picnic Area (A), Coal Siding (B), Camp Splinter (C), Cherry Hill Country Club Golf Course (D), Gauley Ranger Station (E), Richwood Volunteer Fire Department (F), Redi Care Incorporated Station 2 (G). Display/hide their locations on the map
Churches in zip code 26261 include: Hinkle Mountain United Methodist Church (A), Namo Chapel (B), Little Laurel Church (C), Riverside Baptist Church (D), Richwood Presbyterian Church (E), Richwood Christian Church (F), LaFrank United Methodist Church (G), Holy Family Catholic Church (H), First United Methodist Church (I). Display/hide their locations on the map
Cemeteries: Baber Cemetery (1), Taylor Cemetery (2), Mountain View Memorial Park (3), Hinkle Mountain Cemetery (4), Richwood Cemetery (5). Display/hide their locations on the map
Streams, rivers, and creeks: Spring Run (A), Linn Branch (B), Laurel Creek (C), Joes Branch (D), Jackson Run (E), Jackeman Run (F), Improvement Branch (G), Holcomb Run (H), Hogcamp Run (I). Display/hide their locations on the map
In group quarters: 82 (-1 institutionalized population)
Size of family households: 359 2-persons, 69 3-persons, 109 4-persons, 20 5-persons, 71 6-persons
Size of nonfamily households: 511 1-person, 70 2-persons, 24 3-persons
371 married couples with children.
104 single-parent households (23 men, 81 women).
99.2% of residents of 26261 zip code speak English at home.
0.2% of residents speak Spanish at home (100% very well).
0.5% of residents speak other Indo-European language at home (100% very well).
0.3% of residents speak Asian or Pacific Island language at home (44% very well, 56% well).
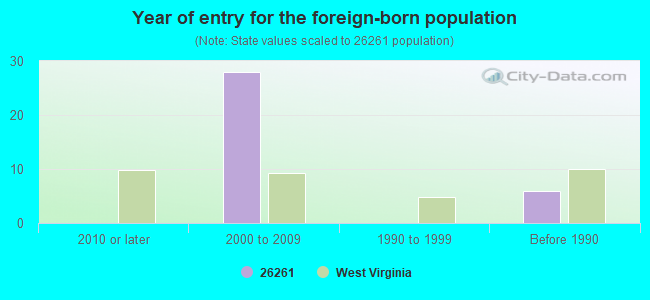
Foreign born population: 8 (0.3%) (87.1% of them are naturalized citizens)
This zip code:
0.3%
Whole state:
1.8%
43%Japan
29%Malaysia
23%Irish
19%German
19%English
18%American
5%Dutch
4%Italian
1%European
Year of entry for the foreign-born population
02010 or later
282000 to 2009
01990 to 1999
6Before 1990
Facilities with environmental interests located in this zip code:
(Integrated Compliance Information System) - ICIS-03-1981-0109, FORMAL ENFORCEMENT ACTION National Pollutant Discharge Elimination System NON-MAJOR (Tracking pollutant discharge elimination systems) - permit (Resource Conservation and Recovery Act (tracking hazardous waste)) TRI REPORTER (Tracking of toxic chemicals releasing facilities) Business SIC classification: SAWMILLS AND PLANING MILLS, GENERAL Business NAICS classification: SAWMILLS. Organizations: GEORGIA-PACIFIC CORP. (CONTACT/OPERATOR)
Alternative names: GEORGIA-PACIFIC CORP, GEORGIA PACIFIC CORP. - RICHWOOD WV, GEORGIA PACIFIC CORP. - RICHWOOD WV, GEORGIA PACIFIC - RICHWOOD WV, RICHWOOD SAWMILL
CHERRY RIVER ELEMENTARY SCHOOL (RIVERSIDE DRIVE in RICHWOOD, WV)
(Geographic Names Information System) (National Center for Education Statistics) - STATE ID-62204 Organizations: NICHOLAS COUNTY SCHOOL DIST (SCHOOL DISTRICT)
GEORGIA PACIFIC CORP. - RICHWOOD WV (108 E. MAIN ST. in RICHWOOD, WV)
CRITERIA AND HAZARDOUS AIR POLLUTANT INVENTORY (Inventory of air pollution sources) Business SIC classification: SAWMILLS AND PLANING MILLS, GENERAL
Housing units lacking complete plumbing facilities: 6.0% Housing units lacking complete kitchen facilities: 3.9%
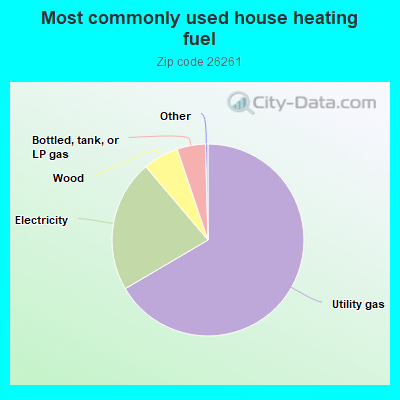
66.6%Utility gas
22.3%Electricity
6.0%Wood
4.8%Bottled, tank, or LP gas
Population in 1990: 4,129.
Place of birth for U.S.-born residents:
This state: 2,374
Northeast: 95
Midwest: 274
South: 225
West: 38
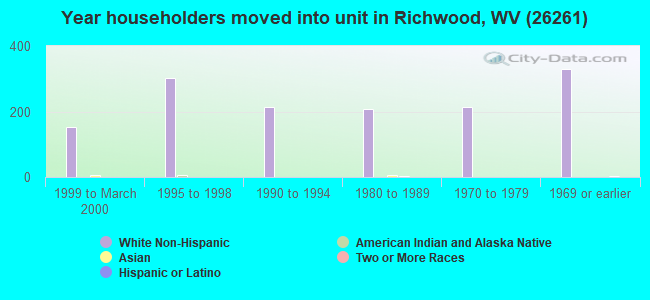
63% of the 26261 zip code residents lived in the same house 5 years ago. Out of people who lived in different houses, 63% lived in this county. Out of people who lived in different counties, 50% lived in West Virginia.
91% of the 26261 zip code residents lived in the same house 1 year ago. Out of people who lived in different houses, 78% moved from this county. Out of people who lived in different houses, 19% moved from different state.
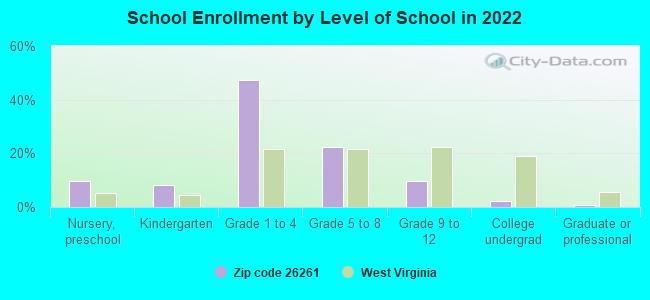
Private vs. public school enrollment:
Students in private schools in grades 1 to 8 (elementary and middle school): 20
Here:
6.2%
West Virginia:
12.2%
Students in private schools in grades 9 to 12 (high school): 5
Here:
11.8%
West Virginia:
8.8%
Students in private undergraduate colleges:
Here:
0.0%
West Virginia:
17.3%
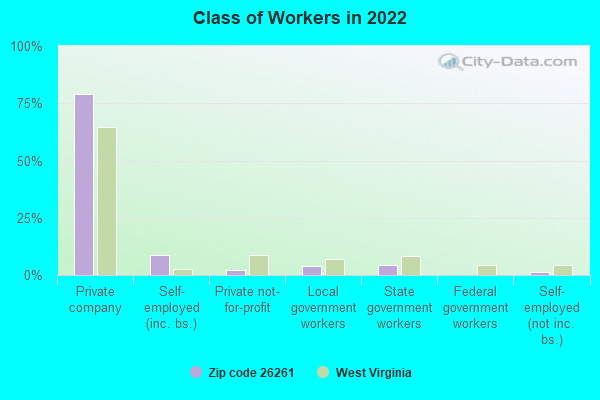
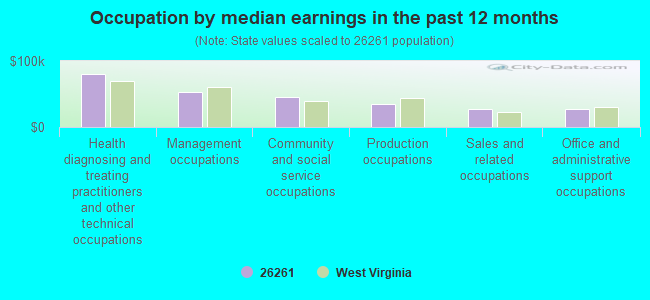
Occupation by median earnings in the past 12 months ($)
80,823Health diagnosing and treating practitioners and other technical occupations
52,433Management occupations
44,869Community and social service occupations
34,703Production occupations
26,918Sales and related occupations
26,823Office and administrative support occupations
Top industries in this zip code by the number of employees in 2005:
Health Care and Social Assistance: General Medical and Surgical Hospitals (100-249 employees: 1 establishment)
Finance and Insurance: Commercial Banking (20-49: 1, 1-4: 1)
Health Care and Social Assistance: Offices of Dentists (10-19: 1, 5-9: 2)
Accommodation and Food Services: Full-Service Restaurants (10-19: 1, 1-4: 1)
People in group quarters in 2010:
87 people in nursing facilities/skilled-nursing facilities
2 people in other noninstitutional facilities
People in group quarters in 2000:
118 people in nursing homes
2 people in religious group quarters
Fatal accident statistics in 2010:
Fatal accident count: 1
Vehicles involved in fatal accidents: 1
Fatal accidents caused by drunken drivers: 1
Fatalities: 1
Persons involved in fatal accidents: 2
Pedestrians involved in fatal accidents: 0
2003 - 2018 National Fire Incident Reporting System (NFIRS) incidents
According to the data from the years 2003 - 2018 the average number of fires per year is 14. The highest number of fire incidents - 29 took place in 2015, and the least - 5 in 2004. The data has an increasing trend.
When looking into fire subcategories, the most reports belonged to: Structure Fires (65.4%), and Outside Fires (13.9%).
Fire incident types reported to NFIRS in Zip Code 26261

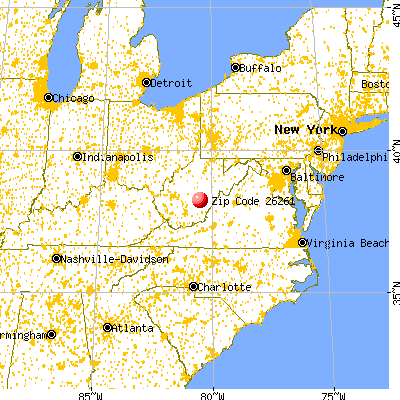


 Nearest zip codes: 26202, 26676, 26208, 26205, 25984, 24991.


 According to the data from the years 2003 - 2018 the average number of fires per year is 14. The highest number of fire incidents - 29 took place in 2015, and the least - 5 in 2004. The data has an increasing trend.
 When looking into fire subcategories, the most reports belonged to: Structure Fires (65.4%), and Outside Fires (13.9%).