Estimated zip code population in 2022: 1,298 Zip code population in 2010: 1,214 Zip code population in 2000: 1,200
Houses and condos: 646 Renter-occupied apartments: 13
% of renters here:
2%
State:
26%
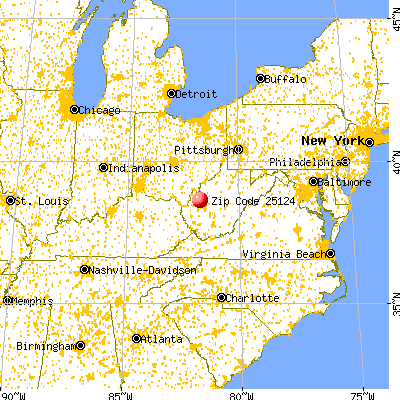
March 2022 cost of living index in zip code 25124: 82.8 (low, U.S. average is 100)
Land area: 29.8 sq. mi. Water area: 0.0 sq. mi.
Population density: 44 people per square mile
(very low).
OSM Map
General Map
Google Map
MSN Map
OSM Map
General Map
Google Map
MSN Map
OSM Map
General Map
Google Map
MSN Map
OSM Map
General Map
Google Map
MSN Map
Please wait while loading the map...
Real estate property taxes paid for housing units in 2022:
This zip code:
0.6% ($894)
West Virginia:
0.5% ($821)
Median real estate property taxes paid for housing units with mortgages in 2022: $489 (0.3%) Median real estate property taxes paid for housing units with no mortgage in 2022: $904 (0.6%)
Business Search- 14 Million verified businesses
Males: 683
(52.6%)
Females: 615
(47.4%)
For population 25 years and over in 25124:
High school or higher: 82.7%
Bachelor's degree or higher: 2.9%
Graduate or professional degree: 1.5%
Mean travel time to work (commute): 40.9 minutes
For population 15 years and over in 25124:
Never married: 13.1%
Now married: 67.7%
Separated: 5.0%
Widowed: 7.6%
Divorced: 6.5%
Zip code 25124 compared to state average:
Unemployed percentage significantly below state average.
Black race population percentage significantly below state average.
Hispanic race population percentage significantly below state average.
Median age significantly above state average.
Foreign-born population percentage significantly below state average.
Renting percentage significantly below state average.
Length of stay since moving in significantly above state average.
House age significantly below state average.
Percentage of population with a bachelor's degree or higher significantly below state average.
Estimated median house/condo value in 2022: $149,356
25124:
$149,356
West Virginia:
$155,100
According to our research of West Virginia and other state lists, there were 6 registered sex offenders living in 25124 zip code as of July 03, 2024. The ratio of all residents to sex offenders in zip code 25124 is 262 to 1.
Median resident age:
This zip code:
63.2 years
West Virginia median age:
42.9 years
Average household size:
This zip code:
2.1 people
West Virginia:
2.3 people
Averages for the 2020 tax year for zip code 25124, filed in 2021:
Average Adjusted Gross Income (AGI) in 2020: $58,360 (Individual Income Tax Returns)
Here:
$58,360
State:
$56,292
Salary/wage: $54,762 (reported on 80.8% of returns)
Here:
$54,762
State:
$49,093
(% of AGI for various income ranges: 1013.6% for AGIs below $25k, 3138.3% for AGIs $25k-50k, 6051.7% for AGIs $50k-75k, 7832.5% for AGIs $75k-100k, 18925.0% for AGIs $100k-200k)
Taxable interest for individuals: $436 (reported on 26.9% of returns)
This zip code:
$436
West Virginia:
$1,141
(% of AGI for various income ranges: 14.5% for AGIs below $25k, 14.2% for AGIs $25k-50k, 20.0% for AGIs $50k-75k, 15.0% for AGIs $75k-100k, 16.7% for AGIs $100k-200k)
Ordinary dividends: $1,580 (reported on 9.6% of returns)
Here:
$1,580
State:
$5,456
(% of AGI for various income ranges: 197.5% for AGIs $75k-100k)
Net capital gain/loss in AGI: +$860 (reported on 9.6% of returns)
Here:
+$860
State:
+$11,656
(% of AGI for various income ranges: 107.5% for AGIs $75k-100k)
Profit/loss from business: +$7,150 (reported on 7.7% of returns)
Here:
+$7,150
State:
+$12,084
(% of AGI for various income ranges: 476.7% for AGIs $50k-75k)
Taxable individual retirement arrangement distribution: $11,675 (reported on 7.7% of returns)
25124:
$11,675
West Virginia:
$15,311
(% of AGI for various income ranges: 389.2% for AGIs $25k-50k)
Earned income credit: $2,014 (reported on 13.5% of returns)
Here:
$2,014
State:
$2,258
(% of AGI for various income ranges: 69.1% for AGIs below $25k, 54.2% for AGIs $25k-50k)
Percentage of individuals using paid preparers for their 2020 taxes: 94.2%
Here:
94%
State:
93%
(% for various income ranges: 93.8% for AGIs below $25k, 92.9% for AGIs $25k-50k, 87.5% for AGIs $50k-75k, 100.0% for AGIs $75k-100k, 100.0% for AGIs $100k-200k)
Averages for the 2012 tax year for zip code 25124, filed in 2013:
Average Adjusted Gross Income (AGI) in 2012: $45,300 (Individual Income Tax Returns)
Here:
$45,300
State:
$48,628
Salary/wage: $44,155 (reported on 82.4% of returns)
Here:
$44,155
State:
$42,328
(% of AGI for various income ranges: 64.4% for AGIs below $25k, 79.4% for AGIs $25k-50k, 79.5% for AGIs $50k-75k, 83.2% for AGIs $75k-100k, 85.5% for AGIs $100k-200k)
Taxable interest for individuals: $478 (reported on 35.3% of returns)
This zip code:
$478
West Virginia:
$1,211
(% of AGI for various income ranges: 2.2% for AGIs below $25k, 0.2% for AGIs $25k-50k, 0.2% for AGIs $50k-75k, 17.5% for AGIs $75k-100k)
Ordinary dividends: $600 (reported on 9.8% of returns)
Here:
$600
State:
$4,262
Net capital gain/loss in AGI: +$533 (reported on 5.9% of returns)
Here:
+$533
State:
+$8,875
Profit/loss from business: +$4,214 (reported on 13.7% of returns)
Here:
+$4,214
State:
+$13,636
Taxable individual retirement arrangement distribution: $5,050 (reported on 7.8% of returns)
25124:
$5,050
West Virginia:
$11,787
Total itemized deductions: $19,822 (21% of AGI, reported on 17.6% of returns)
Here:
$19,822
State:
$21,148
Here:
21.2% of AGI
State:
18.1% of AGI
Charity contributions: $2,980 (reported on 9.8% of returns)
Here:
$2,980
State:
$4,508
Taxes paid: $6,467 (reported on 17.6% of returns)
25124:
$6,467
State:
$8,103
Earned income credit: $1,930 (reported on 19.6% of returns)
Here:
$1,930
State:
$2,140
(% of AGI for various income ranges: 5.2% for AGIs below $25k, 1.1% for AGIs $25k-50k)
Percentage of individuals using paid preparers for their 2012 taxes: 51.0%
Here:
51%
State:
49%
(% for various income ranges: 50.0% for AGIs below $25k, 50.0% for AGIs $25k-50k, 57.1% for AGIs $50k-75k, 40.0% for AGIs $75k-100k, 60.0% for AGIs $100k-200k)
Averages for the 2004 tax year for zip code 25124, filed in 2005:
Average Adjusted Gross Income (AGI) in 2004: $37,564 (Individual Income Tax Returns)
Here:
$37,564
State:
$37,498
Salary/wage: $36,585 (reported on 86.6% of returns)
Here:
$36,585
State:
$33,645
(% of AGI for various income ranges: 80.3% for AGIs below $10k, 66.9% for AGIs $10k-25k, 83.6% for AGIs $25k-50k, 91.1% for AGIs $50k-75k, 96.3% for AGIs $75k-100k, 81.6% for AGIs over 100k)
Taxable interest for individuals: $720 (reported on 39.9% of returns)
This zip code:
$720
West Virginia:
$1,465
(% of AGI for various income ranges: 5.9% for AGIs below $10k, 2.3% for AGIs $10k-25k, 0.6% for AGIs $25k-50k, 0.2% for AGIs $50k-75k, 0.2% for AGIs $75k-100k, 0.7% for AGIs over 100k)
Taxable dividends: $222 (reported on 9.9% of returns)
Here:
$222
State:
$2,913
Net capital gain/loss: +$2,000 (reported on 7.7% of returns)
Here:
+$2,000
State:
+$6,331
Profit/loss from business: +$6,298 (reported on 12.5% of returns)
Here:
+$6,298
State:
+$11,074
Total itemized deductions: $15,156 (21% of AGI, reported on 14.0% of returns)
Here:
$15,156
State:
$16,976
Here:
21.3% of AGI
State:
19.0% of AGI
Charity contributions deductions: $1,529 (2% of AGI, reported on 7.5% of returns)
Here:
$1,529
State:
$3,529
Here:
1.9% of AGI
State:
3.7% of AGI
Total tax: $3,992 (reported on 78.1% of returns)
25124:
$3,992
State:
$5,372
(% of AGI for various income ranges: 2.4% for AGIs below $10k, 3.4% for AGIs $10k-25k, 5.9% for AGIs $25k-50k, 8.1% for AGIs $50k-75k, 10.2% for AGIs $75k-100k, 16.1% for AGIs over 100k)
Earned income credit: $1,632 (reported on 14.9% of returns)
Here:
$1,632
State:
$1,662
Percentage of individuals using paid preparers for their 2004 taxes: 59.2%
Here:
59%
State:
55%
(% for various income ranges: 54.1% for AGIs below $10k, 59.7% for AGIs $10k-25k, 65.0% for AGIs $25k-50k, 53.8% for AGIs $50k-75k, 50.0% for AGIs $75k-100k, 60.9% for AGIs over 100k)
Household received Food Stamps/SNAP in the past 12 months: 37 Household did not receive Food Stamps/SNAP in the past 12 months: 587
Women who did not have a birth in the past 12 months: 196 (111 now married, 84 unmarried)
Housing units in zip code 25124 with a mortgage: 81 Median monthly owner costs for units with a mortgage: $1,011 Median monthly owner costs for units without a mortgage: $339
Residents with income below the poverty level in 2022:
This zip code:
7.2%
Whole state:
17.9%
Residents with income below 50% of the poverty level in 2022:
This zip code:
7.2%
Whole state:
9.7%
Median number of rooms in houses and condos:
Here:
6.1
State:
6.5
Notable locations in this zip code not listed on our city pages
Cemeteries: Mount Zion Cemetery (1), Center Point Cemetery (2), Barnette Chapel Cemetery (3), Bowles Cemetery (4), Warner Cemetery (5), Bowles Ridge Church Cemetery (6), Scott Cemetery (7). Display/hide their locations on the map
Streams, rivers, and creeks: Stumpy Run (A), Sigman Fork (B), Painters Branch (C), Hill Branch (D), Harris Branch (E), Clendenin Creek (F), Clear Fork (G), Cherry Fork (H). Display/hide their locations on the map
Housing units lacking complete kitchen facilities: 1.5%
47.3%Electricity
42.4%Utility gas
8.5%Bottled, tank, or LP gas
2.1%Wood
Population in 1990: 1,050. Population change in the 1990s: +150 (+14.3%).
Place of birth for U.S.-born residents:
This state: 1,157
Northeast: 12
Midwest: 38
South: 74
63% of the 25124 zip code residents lived in the same house 5 years ago. Out of people who lived in different houses, 51% lived in this county. Out of people who lived in different counties, 50% lived in West Virginia.
97% of the 25124 zip code residents lived in the same house 1 year ago. Out of people who lived in different houses, 103% moved from this county.
Private vs. public school enrollment:
Students in private schools in grades 1 to 8 (elementary and middle school):
Here:
0.0%
West Virginia:
12.2%
Students in private schools in grades 9 to 12 (high school):
Here:
0.0%
West Virginia:
8.8%
Students in private undergraduate colleges:
Here:
0.0%
West Virginia:
17.3%
Occupation by median earnings in the past 12 months ($)
42,946Sales and related occupations
20,703Office and administrative support occupations
Top industries in this zip code by the number of employees in 2005:
Construction: New Single-Family Housing Construction (except Operative Builders) (5-9 employees: 1 establishment, 1-4 employees: 2 establishments)
Construction: Poured Concrete Foundation and Structure Contractors (5-9: 1)
Construction: Masonry Contractors (5-9: 1)
Administrative and Support and Waste Management and Remediation Services: Landscaping Services (5-9: 1)
Construction: Site Preparation Contractors (1-4: 1)
Other Services (except Public Administration): Beauty Salons (1-4: 1)
Other Services (except Public Administration): Religious Organizations (1-4: 1)
Home Mortgage Disclosure Act Aggregated Statistics For Year 2009 (Based on 2 partial tracts)
A) FHA, FSA/RHS & VA Home Purchase Loans
B) Conventional Home Purchase Loans
C) Refinancings
D) Home Improvement Loans
F) Non-occupant Loans on < 5 Family Dwellings (A B C & D)
G) Loans On Manufactured Home Dwelling (A B C & D)
Number
Average Value
Number
Average Value
Number
Average Value
Number
Average Value
Number
Average Value
Number
Average Value
LOANS ORIGINATED
8
$104,215
15
$117,449
49
$107,372
8
$40,694
4
$89,248
11
$66,744
APPLICATIONS APPROVED, NOT ACCEPTED
1
$89,810
0
$0
2
$125,355
1
$82,320
1
$124,230
0
$0
APPLICATIONS DENIED
4
$93,362
5
$44,454
10
$110,314
4
$49,582
4
$41,350
5
$40,712
APPLICATIONS WITHDRAWN
3
$76,337
3
$128,723
9
$89,476
1
$173,630
1
$48,650
1
$77,830
FILES CLOSED FOR INCOMPLETENESS
1
$96,540
0
$0
4
$95,608
0
$0
0
$0
0
$0
Aggregated Statistics For Year 2008 (Based on 2 partial tracts)
A) FHA, FSA/RHS & VA Home Purchase Loans
B) Conventional Home Purchase Loans
C) Refinancings
D) Home Improvement Loans
F) Non-occupant Loans on < 5 Family Dwellings (A B C & D)
G) Loans On Manufactured Home Dwelling (A B C & D)
Number
Average Value
Number
Average Value
Number
Average Value
Number
Average Value
Number
Average Value
Number
Average Value
LOANS ORIGINATED
4
$109,452
18
$105,192
45
$84,503
10
$37,719
3
$101,783
10
$51,714
APPLICATIONS APPROVED, NOT ACCEPTED
0
$0
2
$106,275
4
$52,575
4
$44,342
0
$0
4
$67,170
APPLICATIONS DENIED
2
$107,395
8
$62,491
29
$86,686
9
$48,313
0
$0
7
$50,036
APPLICATIONS WITHDRAWN
1
$125,730
4
$126,480
7
$98,574
1
$18,710
0
$0
0
$0
FILES CLOSED FOR INCOMPLETENESS
0
$0
1
$47,150
1
$86,810
0
$0
0
$0
0
$0
Aggregated Statistics For Year 2007 (Based on 2 partial tracts)
A) FHA, FSA/RHS & VA Home Purchase Loans
B) Conventional Home Purchase Loans
C) Refinancings
D) Home Improvement Loans
F) Non-occupant Loans on < 5 Family Dwellings (A B C & D)
G) Loans On Manufactured Home Dwelling (A B C & D)
Number
Average Value
Number
Average Value
Number
Average Value
Number
Average Value
Number
Average Value
Number
Average Value
LOANS ORIGINATED
2
$105,150
35
$93,892
26
$79,330
14
$13,097
5
$95,346
13
$37,362
APPLICATIONS APPROVED, NOT ACCEPTED
1
$20,960
4
$58,562
4
$106,272
2
$16,840
0
$0
2
$52,760
APPLICATIONS DENIED
0
$0
18
$76,212
28
$104,856
4
$89,248
0
$0
12
$57,877
APPLICATIONS WITHDRAWN
1
$73,340
2
$78,210
4
$66,420
0
$0
1
$53,140
1
$29,940
FILES CLOSED FOR INCOMPLETENESS
0
$0
1
$110,760
2
$148,555
0
$0
0
$0
0
$0
Aggregated Statistics For Year 2006 (Based on 2 partial tracts)
A) FHA, FSA/RHS & VA Home Purchase Loans
B) Conventional Home Purchase Loans
C) Refinancings
D) Home Improvement Loans
F) Non-occupant Loans on < 5 Family Dwellings (A B C & D)
G) Loans On Manufactured Home Dwelling (A B C & D)
Number
Average Value
Number
Average Value
Number
Average Value
Number
Average Value
Number
Average Value
Number
Average Value
LOANS ORIGINATED
3
$97,293
31
$81,575
55
$77,112
16
$40,461
3
$47,897
16
$37,420
APPLICATIONS APPROVED, NOT ACCEPTED
2
$68,480
5
$76,636
10
$58,151
3
$21,953
0
$0
7
$57,520
APPLICATIONS DENIED
0
$0
19
$54,869
33
$78,809
7
$21,917
1
$18,710
18
$55,922
APPLICATIONS WITHDRAWN
1
$160,160
3
$37,420
8
$107,301
2
$104,775
0
$0
3
$49,143
FILES CLOSED FOR INCOMPLETENESS
0
$0
1
$54,630
2
$110,015
0
$0
0
$0
0
$0
Aggregated Statistics For Year 2005 (Based on 2 partial tracts)
A) FHA, FSA/RHS & VA Home Purchase Loans
B) Conventional Home Purchase Loans
C) Refinancings
D) Home Improvement Loans
E) Loans on Dwellings For 5+ Families
F) Non-occupant Loans on < 5 Family Dwellings (A B C & D)
G) Loans On Manufactured Home Dwelling (A B C & D)
Number
Average Value
Number
Average Value
Number
Average Value
Number
Average Value
Number
Average Value
Number
Average Value
Number
Average Value
LOANS ORIGINATED
4
$69,975
39
$75,838
49
$83,958
16
$22,124
1
$104,780
5
$73,792
24
$43,781
APPLICATIONS APPROVED, NOT ACCEPTED
0
$0
4
$48,832
13
$85,893
5
$18,560
0
$0
1
$51,640
5
$29,188
APPLICATIONS DENIED
7
$66,073
16
$51,406
38
$102,038
10
$30,909
0
$0
1
$83,820
22
$50,041
APPLICATIONS WITHDRAWN
0
$0
4
$121,990
15
$139,302
1
$396,650
0
$0
0
$0
4
$61,370
FILES CLOSED FOR INCOMPLETENESS
0
$0
3
$72,347
2
$149,680
0
$0
0
$0
0
$0
0
$0
Aggregated Statistics For Year 2004 (Based on 2 partial tracts)
A) FHA, FSA/RHS & VA Home Purchase Loans
B) Conventional Home Purchase Loans
C) Refinancings
D) Home Improvement Loans
F) Non-occupant Loans on < 5 Family Dwellings (A B C & D)
G) Loans On Manufactured Home Dwelling (A B C & D)
Number
Average Value
Number
Average Value
Number
Average Value
Number
Average Value
Number
Average Value
Number
Average Value
LOANS ORIGINATED
4
$75,588
32
$73,647
48
$75,448
12
$24,011
6
$48,522
22
$42,149
APPLICATIONS APPROVED, NOT ACCEPTED
0
$0
7
$60,727
10
$60,546
1
$2,250
1
$63,610
2
$41,535
APPLICATIONS DENIED
3
$70,850
19
$46,716
33
$103,030
17
$24,565
1
$59,870
21
$41,625
APPLICATIONS WITHDRAWN
1
$121,240
7
$106,166
9
$94,963
1
$121,990
0
$0
2
$39,665
FILES CLOSED FOR INCOMPLETENESS
0
$0
2
$120,120
4
$103,652
0
$0
0
$0
0
$0
Aggregated Statistics For Year 2003 (Based on 2 partial tracts)
A) FHA, FSA/RHS & VA Home Purchase Loans
B) Conventional Home Purchase Loans
C) Refinancings
D) Home Improvement Loans
E) Loans on Dwellings For 5+ Families
F) Non-occupant Loans on < 5 Family Dwellings (A B C & D)
Number
Average Value
Number
Average Value
Number
Average Value
Number
Average Value
Number
Average Value
Number
Average Value
LOANS ORIGINATED
1
$68,850
31
$75,951
74
$65,161
19
$18,592
1
$119,740
3
$55,630
APPLICATIONS APPROVED, NOT ACCEPTED
0
$0
7
$51,853
13
$112,663
1
$22,450
0
$0
1
$28,440
APPLICATIONS DENIED
0
$0
18
$40,663
41
$71,080
11
$14,084
0
$0
0
$0
APPLICATIONS WITHDRAWN
1
$114,510
4
$85,880
13
$75,358
1
$14,970
0
$0
0
$0
FILES CLOSED FOR INCOMPLETENESS
0
$0
1
$62,870
4
$133,215
0
$0
0
$0
0
$0
Aggregated Statistics For Year 2002 (Based on 2 partial tracts)
A) FHA, FSA/RHS & VA Home Purchase Loans
B) Conventional Home Purchase Loans
C) Refinancings
D) Home Improvement Loans
F) Non-occupant Loans on < 5 Family Dwellings (A B C & D)
Number
Average Value
Number
Average Value
Number
Average Value
Number
Average Value
Number
Average Value
LOANS ORIGINATED
1
$127,230
21
$73,949
54
$62,699
16
$19,131
4
$45,465
APPLICATIONS APPROVED, NOT ACCEPTED
0
$0
9
$69,269
10
$64,437
1
$26,190
0
$0
APPLICATIONS DENIED
1
$130,970
19
$53,294
34
$71,274
8
$12,910
0
$0
APPLICATIONS WITHDRAWN
1
$47,150
5
$63,314
7
$72,809
1
$22,450
1
$125,730
FILES CLOSED FOR INCOMPLETENESS
0
$0
1
$47,900
6
$97,167
0
$0
0
$0
Aggregated Statistics For Year 2001 (Based on 2 partial tracts)
A) FHA, FSA/RHS & VA Home Purchase Loans
B) Conventional Home Purchase Loans
C) Refinancings
D) Home Improvement Loans
E) Loans on Dwellings For 5+ Families
F) Non-occupant Loans on < 5 Family Dwellings (A B C & D)
Number
Average Value
Number
Average Value
Number
Average Value
Number
Average Value
Number
Average Value
Number
Average Value
LOANS ORIGINATED
2
$83,820
27
$64,806
46
$75,963
9
$7,900
1
$133,960
1
$72,590
APPLICATIONS APPROVED, NOT ACCEPTED
0
$0
12
$50,517
10
$58,226
0
$0
0
$0
0
$0
APPLICATIONS DENIED
1
$140,700
18
$35,716
17
$85,229
4
$4,302
0
$0
1
$14,970
APPLICATIONS WITHDRAWN
1
$136,210
7
$65,324
9
$63,364
1
$5,240
0
$0
0
$0
FILES CLOSED FOR INCOMPLETENESS
2
$77,460
0
$0
1
$123,490
0
$0
0
$0
0
$0
Aggregated Statistics For Year 2000 (Based on 2 partial tracts)
A) FHA, FSA/RHS & VA Home Purchase Loans
B) Conventional Home Purchase Loans
C) Refinancings
D) Home Improvement Loans
E) Loans on Dwellings For 5+ Families
F) Non-occupant Loans on < 5 Family Dwellings (A B C & D)
Number
Average Value
Number
Average Value
Number
Average Value
Number
Average Value
Number
Average Value
Number
Average Value
LOANS ORIGINATED
1
$56,130
34
$61,897
27
$72,484
16
$28,299
1
$140,700
1
$41,160
APPLICATIONS APPROVED, NOT ACCEPTED
4
$39,478
11
$48,374
9
$58,376
1
$37,420
0
$0
0
$0
APPLICATIONS DENIED
2
$27,690
39
$30,684
16
$56,785
5
$4,192
0
$0
1
$116,000
APPLICATIONS WITHDRAWN
1
$104,030
1
$35,920
10
$59,124
1
$11,230
0
$0
1
$35,920
FILES CLOSED FOR INCOMPLETENESS
0
$0
0
$0
2
$43,780
0
$0
0
$0
0
$0
Aggregated Statistics For Year 1999 (Based on 1 partial tract)
A) FHA, FSA/RHS & VA Home Purchase Loans
B) Conventional Home Purchase Loans
C) Refinancings
D) Home Improvement Loans
F) Non-occupant Loans on < 5 Family Dwellings (A B C & D)
Detailed PMIC statistics for the following Tracts:0201.00
2003 - 2018 National Fire Incident Reporting System (NFIRS) incidents
Based on the data from the years 2003 - 2018 the average number of fire incidents per year is 9. The highest number of fire incidents - 20 took place in 2014, and the least - 2 in 2004. The data has a growing trend.
When looking into fire subcategories, the most reports belonged to: Structure Fires (62.3%), and Outside Fires (23.2%).
Fire incident types reported to NFIRS in Zip Code 25124


 Nearest zip codes: 25245, 25159, 25168, 25109, 25011, 25033.


 Based on the data from the years 2003 - 2018 the average number of fire incidents per year is 9. The highest number of fire incidents - 20 took place in 2014, and the least - 2 in 2004. The data has a growing trend.
 When looking into fire subcategories, the most reports belonged to: Structure Fires (62.3%), and Outside Fires (23.2%).