Estimated zip code population in 2022: 2,792 Zip code population in 2010: 2,582 Zip code population in 2000: 2,457
Houses and condos: 2,111 Renter-occupied apartments: 123
% of renters here:
10%
State:
33%
March 2022 cost of living index in zip code 24137: 84.3 (less than average, U.S. average is 100)
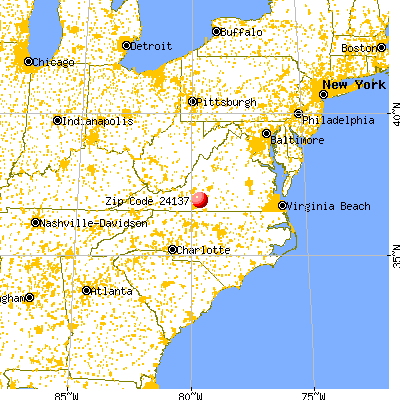
Land area: 74.2 sq. mi. Water area: 4.4 sq. mi.
Population density: 38 people per square mile
(very low).
OSM Map
General Map
Google Map
MSN Map
OSM Map
General Map
Google Map
MSN Map
OSM Map
General Map
Google Map
MSN Map
OSM Map
General Map
Google Map
MSN Map
Please wait while loading the map...
Real estate property taxes paid for housing units in 2022:
This zip code:
0.5% ($1,020)
Virginia:
0.7% ($2,617)
Median real estate property taxes paid for housing units with mortgages in 2022: $1,914 (0.4%) Median real estate property taxes paid for housing units with no mortgage in 2022: $684 (0.1%)
Business Search- 14 Million verified businesses
Males: 1,438
(51.5%)
Females: 1,353
(48.5%)
For population 25 years and over in 24137:
High school or higher: 84.0%
Bachelor's degree or higher: 23.1%
Graduate or professional degree: 7.4%
Unemployed: 0.4%
Mean travel time to work (commute): 32.5 minutes
For population 15 years and over in 24137:
Never married: 30.4%
Now married: 58.7%
Separated: 2.8%
Widowed: 2.8%
Divorced: 5.3%
Zip code 24137 compared to state average:
Median house value below state average.
Unemployed percentage significantly below state average.
Black race population percentage significantly below state average.
Hispanic race population percentage below state average.
Median age significantly above state average.
Renting percentage significantly below state average.
Length of stay since moving in significantly above state average.
Number of college students significantly below state average.
Percentage of population with a bachelor's degree or higher below state average.
Estimated median house/condo value in 2022: $186,724
24137:
$186,724
Virginia:
$365,700
According to our research of Virginia and other state lists, there were 8 registered sex offenders living in 24137 zip code as of July 05, 2024. The ratio of all residents to sex offenders in zip code 24137 is 317 to 1. The ratio of registered sex offenders to all residents in this zip code is near the state average.
Median resident age:
This zip code:
58.0 years
Virginia median age:
39.0 years
Average household size:
This zip code:
2.2 people
Virginia:
2.5 people
Averages for the 2020 tax year for zip code 24137, filed in 2021:
Average Adjusted Gross Income (AGI) in 2020: $87,061 (Individual Income Tax Returns)
Here:
$87,061
State:
$86,446
Salary/wage: $64,996 (reported on 71.4% of returns)
Here:
$64,996
State:
$71,185
(% of AGI for various income ranges: 1022.1% for AGIs below $25k, 3315.0% for AGIs $25k-50k, 5900.0% for AGIs $50k-75k, 8318.3% for AGIs $75k-100k, 11081.1% for AGIs $100k-200k)
Taxable interest for individuals: $2,200 (reported on 40.2% of returns)
This zip code:
$2,200
Virginia:
$1,805
(% of AGI for various income ranges: 38.8% for AGIs below $25k, 43.6% for AGIs $25k-50k, 102.7% for AGIs $50k-75k, 105.0% for AGIs $75k-100k, 326.7% for AGIs $100k-200k)
Ordinary dividends: $8,221 (reported on 29.5% of returns)
Here:
$8,221
State:
$8,327
(% of AGI for various income ranges: 52.5% for AGIs below $25k, 99.1% for AGIs $25k-50k, 119.1% for AGIs $50k-75k, 421.7% for AGIs $75k-100k, 862.2% for AGIs $100k-200k)
Net capital gain/loss in AGI: +$20,218 (reported on 25.0% of returns)
Here:
+$20,218
State:
+$24,644
(% of AGI for various income ranges: 33.8% for AGIs below $25k, 28.6% for AGIs $25k-50k, 47.3% for AGIs $50k-75k, 348.3% for AGIs $75k-100k, 1535.6% for AGIs $100k-200k)
Profit/loss from business: +$15,582 (reported on 15.2% of returns)
Here:
+$15,582
State:
+$12,836
(% of AGI for various income ranges: 100.0% for AGIs below $25k, 85.5% for AGIs $25k-50k, 272.7% for AGIs $50k-75k, 371.7% for AGIs $75k-100k, 406.7% for AGIs $100k-200k)
Taxable individual retirement arrangement distribution: $25,532 (reported on 17.0% of returns)
24137:
$25,532
Virginia:
$21,535
(% of AGI for various income ranges: 130.0% for AGIs below $25k, 145.5% for AGIs $25k-50k, 500.9% for AGIs $50k-75k, 1040.0% for AGIs $75k-100k, 3382.2% for AGIs $100k-200k)
Total itemized deductions: $44,636 (reported on 9.8% of returns)
Here:
$44,636
State:
$33,287
(% of AGI for various income ranges: 733.6% for AGIs $50k-75k, 1651.1% for AGIs $100k-200k)
Charity contributions: $12,030 (reported on 8.9% of returns)
Here:
$12,030
State:
$10,381
(% of AGI for various income ranges: 72.7% for AGIs $25k-50k, 421.1% for AGIs $100k-200k)
Taxes paid: $8,373 (reported on 9.8% of returns)
24137:
$8,373
State:
$8,284
(% of AGI for various income ranges: 129.1% for AGIs $50k-75k, 420.0% for AGIs $100k-200k)
Earned income credit: $2,156 (reported on 16.1% of returns)
Here:
$2,156
State:
$2,214
(% of AGI for various income ranges: 95.0% for AGIs below $25k, 72.7% for AGIs $25k-50k)
Percentage of individuals using paid preparers for their 2020 taxes: 94.6%
Here:
95%
State:
92%
(% for various income ranges: 94.3% for AGIs below $25k, 96.3% for AGIs $25k-50k, 93.8% for AGIs $50k-75k, 100.0% for AGIs $75k-100k, 93.8% for AGIs $100k-200k, 87.5% for AGIs over 200k)
Averages for the 2012 tax year for zip code 24137, filed in 2013:
Average Adjusted Gross Income (AGI) in 2012: $66,218 (Individual Income Tax Returns)
Here:
$66,218
State:
$71,192
Salary/wage: $44,171 (reported on 75.9% of returns)
Here:
$44,171
State:
$59,229
(% of AGI for various income ranges: 67.0% for AGIs below $25k, 73.8% for AGIs $25k-50k, 62.8% for AGIs $50k-75k, 61.6% for AGIs $75k-100k, 48.2% for AGIs $100k-200k, 29.9% for AGIs over 200k)
Taxable interest for individuals: $2,867 (reported on 44.4% of returns)
This zip code:
$2,867
Virginia:
$1,600
(% of AGI for various income ranges: 4.3% for AGIs below $25k, 1.2% for AGIs $25k-50k, 1.2% for AGIs $50k-75k, 1.5% for AGIs $75k-100k, 2.4% for AGIs $100k-200k, 1.9% for AGIs over 200k)
Ordinary dividends: $8,518 (reported on 25.9% of returns)
Here:
$8,518
State:
$6,959
(% of AGI for various income ranges: 2.7% for AGIs below $25k, 1.3% for AGIs $25k-50k, 3.2% for AGIs $50k-75k, 1.4% for AGIs $75k-100k, 6.8% for AGIs $100k-200k, 3.1% for AGIs over 200k)
Net capital gain/loss in AGI: +$18,904 (reported on 24.1% of returns)
Here:
+$18,904
State:
+$16,672
(% of AGI for various income ranges: 1.2% for AGIs below $25k, 0.7% for AGIs $25k-50k, 3.8% for AGIs $50k-75k, 2.6% for AGIs $100k-200k, 17.5% for AGIs over 200k)
Profit/loss from business: +$10,724 (reported on 15.7% of returns)
Here:
+$10,724
State:
+$14,116
(% of AGI for various income ranges: 8.5% for AGIs below $25k, 2.8% for AGIs $25k-50k, 7.1% for AGIs $50k-75k, 3.6% for AGIs $100k-200k)
Taxable individual retirement arrangement distribution: $22,279 (reported on 17.6% of returns)
24137:
$22,279
Virginia:
$16,667
(% of AGI for various income ranges: 3.1% for AGIs below $25k, 2.4% for AGIs $25k-50k, 4.3% for AGIs $50k-75k, 6.1% for AGIs $75k-100k, 19.6% for AGIs $100k-200k)
Total itemized deductions: $27,824 (20% of AGI, reported on 30.6% of returns)
Here:
$27,824
State:
$26,596
Here:
19.8% of AGI
State:
20.1% of AGI
(% of AGI for various income ranges: 9.5% for AGIs below $25k, 7.5% for AGIs $25k-50k, 14.3% for AGIs $50k-75k, 12.8% for AGIs $75k-100k, 20.7% for AGIs $100k-200k, 10.3% for AGIs over 200k)
Charity contributions: $4,854 (reported on 25.9% of returns)
Here:
$4,854
State:
$4,443
(% of AGI for various income ranges: 1.2% for AGIs $25k-50k, 2.2% for AGIs $50k-75k, 2.2% for AGIs $75k-100k, 3.1% for AGIs $100k-200k, 1.6% for AGIs over 200k)
Taxes paid: $9,861 (reported on 30.6% of returns)
24137:
$9,861
State:
$9,951
(% of AGI for various income ranges: 1.6% for AGIs below $25k, 1.5% for AGIs $25k-50k, 3.1% for AGIs $50k-75k, 3.6% for AGIs $75k-100k, 7.2% for AGIs $100k-200k, 5.8% for AGIs over 200k)
Earned income credit: $2,214 (reported on 19.4% of returns)
Here:
$2,214
State:
$2,211
(% of AGI for various income ranges: 7.6% for AGIs below $25k, 1.1% for AGIs $25k-50k)
Percentage of individuals using paid preparers for their 2012 taxes: 69.4%
Here:
69%
State:
46%
(% for various income ranges: 64.1% for AGIs below $25k, 67.9% for AGIs $25k-50k, 78.6% for AGIs $50k-75k, 66.7% for AGIs $75k-100k, 72.7% for AGIs $100k-200k, 100.0% for AGIs over 200k)
Averages for the 2004 tax year for zip code 24137, filed in 2005:
Average Adjusted Gross Income (AGI) in 2004: $71,903 (Individual Income Tax Returns)
Here:
$71,903
State:
$56,704
Salary/wage: $43,408 (reported on 80.2% of returns)
Here:
$43,408
State:
$48,441
(% of AGI for various income ranges: 128.0% for AGIs below $10k, 74.7% for AGIs $10k-25k, 71.6% for AGIs $25k-50k, 77.0% for AGIs $50k-75k, 56.9% for AGIs $75k-100k, 32.9% for AGIs over 100k)
Taxable interest for individuals: $2,807 (reported on 51.9% of returns)
This zip code:
$2,807
Virginia:
$1,688
(% of AGI for various income ranges: 11.3% for AGIs below $10k, 3.6% for AGIs $10k-25k, 2.0% for AGIs $25k-50k, 1.9% for AGIs $50k-75k, 3.0% for AGIs $75k-100k, 1.6% for AGIs over 100k)
Taxable dividends: $7,437 (reported on 26.1% of returns)
Here:
$7,437
State:
$4,028
(% of AGI for various income ranges: 4.2% for AGIs below $10k, 1.7% for AGIs $10k-25k, 2.0% for AGIs $25k-50k, 1.6% for AGIs $50k-75k, 6.7% for AGIs $75k-100k, 2.6% for AGIs over 100k)
Net capital gain/loss: +$54,965 (reported on 23.3% of returns)
Here:
+$54,965
State:
+$14,375
(% of AGI for various income ranges: 0.2% for AGIs below $10k, 0.8% for AGIs $10k-25k, 2.6% for AGIs $25k-50k, 1.5% for AGIs $50k-75k, 1.5% for AGIs $75k-100k, 28.6% for AGIs over 100k)
Profit/loss from business: +$16,214 (reported on 14.5% of returns)
Here:
+$16,214
State:
+$13,342
(% of AGI for various income ranges: 5.0% for AGIs below $10k, 4.5% for AGIs $10k-25k, 3.4% for AGIs $25k-50k, 3.8% for AGIs $50k-75k, 3.5% for AGIs over 100k)
Profit/loss from farming: +$506 (reported on 7.9% of returns)
Here:
+$506
State:
-$5,267
(% of AGI for various income ranges: 1.0% for AGIs below $10k, 1.5% for AGIs $10k-25k, 1.3% for AGIs $25k-50k, -0.8% for AGIs $50k-75k, -1.1% for AGIs $75k-100k)
IRA payment deduction: $2,800 (reported on 2.7% of returns)
24137:
$2,800
Virginia:
$2,943
Total itemized deductions: $26,376 (16% of AGI, reported on 29.8% of returns)
Here:
$26,376
State:
$21,492
Here:
16.0% of AGI
State:
21.0% of AGI
(% of AGI for various income ranges: 9.3% for AGIs $10k-25k, 10.9% for AGIs $25k-50k, 11.3% for AGIs $50k-75k, 18.7% for AGIs $75k-100k, 10.1% for AGIs over 100k)
Charity contributions deductions: $6,898 (4% of AGI, reported on 26.0% of returns)
Here:
$6,898
State:
$3,794
Here:
3.8% of AGI
State:
3.5% of AGI
(% of AGI for various income ranges: 0.7% for AGIs $10k-25k, 1.2% for AGIs $25k-50k, 2.2% for AGIs $50k-75k, 3.0% for AGIs $75k-100k, 3.0% for AGIs over 100k)
Total tax: $15,390 (reported on 75.3% of returns)
24137:
$15,390
State:
$9,537
(% of AGI for various income ranges: 3.2% for AGIs below $10k, 4.2% for AGIs $10k-25k, 6.6% for AGIs $25k-50k, 8.7% for AGIs $50k-75k, 9.4% for AGIs $75k-100k, 21.9% for AGIs over 100k)
Earned income credit: $1,554 (reported on 16.8% of returns)
Here:
$1,554
State:
$1,734
Percentage of individuals using paid preparers for their 2004 taxes: 76.3%
Here:
76%
State:
52%
(% for various income ranges: 73.0% for AGIs below $10k, 77.3% for AGIs $10k-25k, 78.6% for AGIs $25k-50k, 75.0% for AGIs $50k-75k, 70.0% for AGIs $75k-100k, 80.7% for AGIs over 100k)
Household received Food Stamps/SNAP in the past 12 months: 22 Household did not receive Food Stamps/SNAP in the past 12 months: 1,222
Women who had a birth in the past 12 months: 74 (39 now married, 33 unmarried) Women who did not have a birth in the past 12 months: 425 (136 now married, 291 unmarried)
Housing units in zip code 24137 with a mortgage: 443 (47 second mortgage, 46 both second mortgage and home equity loan) Houses without a mortgage: 23
Median monthly owner costs for units with a mortgage: $1,698 Median monthly owner costs for units without a mortgage: $287
Residents with income below the poverty level in 2022:
This zip code:
7.2%
Whole state:
10.6%
Residents with income below 50% of the poverty level in 2022:
This zip code:
5.6%
Whole state:
5.2%
Median number of rooms in houses and condos:
Here:
6.4
State:
7.0
Median number of rooms in apartments:
Here:
5.5
State:
4.3
Notable locations in this zip code not listed on our city pages
Notable locations in zip code 24137: Adams Store (A), Hodges Mill (B), Parkers Store (C), Truevine (D), Cool Branch Volunteer Fire Department (E). Display/hide their locations on the map
Churches in zip code 24137 include: Rising Sun Church (A), Boones Chapel (B), Cool Spring Church (C), Forrest Hill Church (D), Franklin Grove Church (E), Galilee Church (F), Mount Carmel Church (G), Mount Parris Church (H), Mount Zion Church (I). Display/hide their locations on the map
Cemeteries: Belcher Cemetery (1), Carter Cemetery (2), Young Cemetery (3), Wingfield Cemetery (4), Walker-Rigney Cemetery (5), Walker Cemetery (6), Rogers Cemetery (7). Display/hide their locations on the map
Streams, rivers, and creeks: Ward Branch (A), Turkey Creek (B), Tanyard Branch (C), Swiftwater Branch (D), Strawfield Creek (E), Guthrie Branch (F), Poplar Branch (G), Polecat Creek (H), Polecat Branch (I). Display/hide their locations on the map
In group quarters: 4 (-1 institutionalized population)
Size of family households: 489 2-persons, 179 3-persons, 46 4-persons, 47 5-persons, 66 6-persons
Size of nonfamily households: 378 1-person, 63 2-persons
153 married couples with children.
74 single-parent households (14 men, 60 women).
94.7% of residents of 24137 zip code speak English at home.
4.7% of residents speak Spanish at home (44% very well, 31% well, 25% not well).
0.6% of residents speak other Indo-European language at home (100% very well).
Foreign born population: 325 (11.7%) (69.6% of them are naturalized citizens)
This zip code:
11.7%
Whole state:
12.7%
19%Costa Rica
16%Romania
12%Honduras
3%Kuwait
19%American
17%Irish
17%English
6%German
3%Swedish
3%British
3%Russian
Year of entry for the foreign-born population
1202010 or later
522000 to 2009
1351990 to 1999
24Before 1990
Housing units lacking complete plumbing facilities: 4.3% Housing units lacking complete kitchen facilities: 5.3%
83.8%Electricity
9.6%Bottled, tank, or LP gas
2.8%Wood
2.6%Utility gas
1.4%Fuel oil, kerosene, etc.
Population in 1990: 1,768. Population change in the 1990s: +689 (+39.0%).
Place of birth for U.S.-born residents:
This state: 1,690
Northeast: 250
Midwest: 159
South: 318
West: 31
63% of the 24137 zip code residents lived in the same house 5 years ago. Out of people who lived in different houses, 43% lived in this county. Out of people who lived in different counties, 50% lived in Virginia.
97% of the 24137 zip code residents lived in the same house 1 year ago. Out of people who lived in different houses, 10% moved from this county. Out of people who lived in different houses, 48% moved from different county within same state. Out of people who lived in different houses, 62% moved from different state.
Private vs. public school enrollment:
Students in private schools in grades 1 to 8 (elementary and middle school): 7
Here:
14.0%
Virginia:
13.2%
Students in private schools in grades 9 to 12 (high school): 58
Here:
53.6%
Virginia:
10.2%
Students in private undergraduate colleges: 19
Here:
70.9%
Virginia:
18.7%
Occupation by median earnings in the past 12 months ($)
93,139Management occupations
89,963Sales and related occupations
47,211Education, training, and library occupations
36,498Material moving occupations
34,375Construction and extraction occupations
20,040Transportation occupations
Top industries in this zip code by the number of employees in 2005:
Accommodation and Food Services: Limited-Service Restaurants (20-49 employees: 1 establishment)
Construction: Electrical Contractors (5-9: 1)
Other Services (except Public Administration): Religious Organizations (5-9: 1)
Arts, Entertainment, and Recreation: Marinas (1-4: 3)
Construction: New Single-Family Housing Construction (except Operative Builders) (1-4: 2)
Real Estate and Rental and Leasing: Lessors of Other Real Estate Property (1-4: 2)
Construction: Framing Contractors (1-4: 1)
People in group quarters in 2010:
9 people in workers' group living quarters and job corps centers
Fatal accident statistics in 2014:
Fatal accident count: 1
Vehicles involved in fatal accidents: 1
Fatal accidents caused by drunken drivers: 1
Fatalities: 1
Persons involved in fatal accidents: 1
Pedestrians involved in fatal accidents: 0
Home Mortgage Disclosure Act Aggregated Statistics For Year 2009 (Based on 4 partial tracts)
A) FHA, FSA/RHS & VA Home Purchase Loans
B) Conventional Home Purchase Loans
C) Refinancings
D) Home Improvement Loans
E) Loans on Dwellings For 5+ Families
F) Non-occupant Loans on < 5 Family Dwellings (A B C & D)
G) Loans On Manufactured Home Dwelling (A B C & D)
Number
Average Value
Number
Average Value
Number
Average Value
Number
Average Value
Number
Average Value
Number
Average Value
Number
Average Value
LOANS ORIGINATED
10
$119,771
24
$211,621
93
$150,438
10
$56,956
1
$629,060
19
$276,782
18
$85,341
APPLICATIONS APPROVED, NOT ACCEPTED
0
$0
2
$165,705
9
$126,826
1
$4,820
0
$0
1
$385,150
1
$146,760
APPLICATIONS DENIED
1
$129,320
4
$376,965
52
$128,471
5
$6,430
0
$0
3
$93,730
14
$93,676
APPLICATIONS WITHDRAWN
4
$117,540
3
$132,840
22
$151,938
2
$4,825
0
$0
2
$237,975
3
$91,210
FILES CLOSED FOR INCOMPLETENESS
1
$80,980
1
$118,330
5
$120,770
1
$685,560
0
$0
1
$685,560
1
$61,320
Aggregated Statistics For Year 2008 (Based on 4 partial tracts)
A) FHA, FSA/RHS & VA Home Purchase Loans
B) Conventional Home Purchase Loans
C) Refinancings
D) Home Improvement Loans
F) Non-occupant Loans on < 5 Family Dwellings (A B C & D)
G) Loans On Manufactured Home Dwelling (A B C & D)
Number
Average Value
Number
Average Value
Number
Average Value
Number
Average Value
Number
Average Value
Number
Average Value
LOANS ORIGINATED
9
$121,412
18
$132,382
81
$131,973
21
$36,536
14
$125,797
24
$76,713
APPLICATIONS APPROVED, NOT ACCEPTED
1
$84,060
2
$70,280
8
$101,899
0
$0
1
$57,880
4
$64,375
APPLICATIONS DENIED
0
$0
7
$81,461
58
$115,158
17
$51,742
2
$167,970
19
$70,916
APPLICATIONS WITHDRAWN
1
$207,390
2
$177,570
20
$135,944
1
$13,780
2
$173,865
4
$103,072
FILES CLOSED FOR INCOMPLETENESS
3
$104,270
1
$75,790
5
$110,558
2
$89,460
0
$0
3
$103,033
Aggregated Statistics For Year 2007 (Based on 4 partial tracts)
A) FHA, FSA/RHS & VA Home Purchase Loans
B) Conventional Home Purchase Loans
C) Refinancings
D) Home Improvement Loans
F) Non-occupant Loans on < 5 Family Dwellings (A B C & D)
G) Loans On Manufactured Home Dwelling (A B C & D)
Number
Average Value
Number
Average Value
Number
Average Value
Number
Average Value
Number
Average Value
Number
Average Value
LOANS ORIGINATED
8
$99,745
44
$136,362
89
$124,924
24
$35,482
17
$176,324
33
$76,720
APPLICATIONS APPROVED, NOT ACCEPTED
1
$141,250
7
$116,927
20
$111,642
2
$55,770
1
$75,380
4
$75,790
APPLICATIONS DENIED
5
$122,296
13
$102,871
83
$105,526
18
$51,992
2
$191,985
22
$81,103
APPLICATIONS WITHDRAWN
0
$0
8
$102,402
47
$141,384
3
$10,507
3
$489,910
5
$70,730
FILES CLOSED FOR INCOMPLETENESS
1
$52,160
0
$0
9
$100,307
0
$0
0
$0
0
$0
Aggregated Statistics For Year 2006 (Based on 4 partial tracts)
A) FHA, FSA/RHS & VA Home Purchase Loans
B) Conventional Home Purchase Loans
C) Refinancings
D) Home Improvement Loans
F) Non-occupant Loans on < 5 Family Dwellings (A B C & D)
G) Loans On Manufactured Home Dwelling (A B C & D)
Number
Average Value
Number
Average Value
Number
Average Value
Number
Average Value
Number
Average Value
Number
Average Value
LOANS ORIGINATED
12
$107,726
56
$154,075
103
$116,969
25
$59,537
28
$207,652
33
$83,830
APPLICATIONS APPROVED, NOT ACCEPTED
1
$121,950
7
$115,959
17
$114,432
4
$38,945
2
$71,340
5
$82,054
APPLICATIONS DENIED
6
$103,647
19
$200,899
81
$108,014
27
$33,210
9
$200,452
35
$63,923
APPLICATIONS WITHDRAWN
3
$102,203
7
$124,530
54
$110,986
5
$31,832
1
$143,990
7
$98,423
FILES CLOSED FOR INCOMPLETENESS
0
$0
2
$191,435
6
$142,570
1
$20,670
0
$0
0
$0
Aggregated Statistics For Year 2005 (Based on 4 partial tracts)
A) FHA, FSA/RHS & VA Home Purchase Loans
B) Conventional Home Purchase Loans
C) Refinancings
D) Home Improvement Loans
F) Non-occupant Loans on < 5 Family Dwellings (A B C & D)
G) Loans On Manufactured Home Dwelling (A B C & D)
Number
Average Value
Number
Average Value
Number
Average Value
Number
Average Value
Number
Average Value
Number
Average Value
LOANS ORIGINATED
8
$86,619
47
$121,905
87
$103,054
19
$39,138
17
$154,826
29
$61,218
APPLICATIONS APPROVED, NOT ACCEPTED
0
$0
11
$140,248
19
$89,678
4
$36,925
3
$224,577
6
$56,752
APPLICATIONS DENIED
2
$61,085
23
$83,176
99
$86,127
17
$25,673
7
$116,916
33
$64,848
APPLICATIONS WITHDRAWN
2
$84,920
10
$109,881
51
$92,351
6
$71,085
4
$99,745
7
$65,119
FILES CLOSED FOR INCOMPLETENESS
0
$0
1
$278,620
10
$119,514
1
$33,760
0
$0
1
$79,240
Aggregated Statistics For Year 2004 (Based on 4 partial tracts)
A) FHA, FSA/RHS & VA Home Purchase Loans
B) Conventional Home Purchase Loans
C) Refinancings
D) Home Improvement Loans
E) Loans on Dwellings For 5+ Families
F) Non-occupant Loans on < 5 Family Dwellings (A B C & D)
G) Loans On Manufactured Home Dwelling (A B C & D)
Number
Average Value
Number
Average Value
Number
Average Value
Number
Average Value
Number
Average Value
Number
Average Value
Number
Average Value
LOANS ORIGINATED
10
$92,780
44
$107,622
120
$92,575
19
$37,437
0
$0
20
$122,895
28
$58,331
APPLICATIONS APPROVED, NOT ACCEPTED
1
$113,000
7
$75,129
24
$84,965
0
$0
0
$0
1
$210,730
10
$66,685
APPLICATIONS DENIED
4
$95,082
20
$70,706
87
$86,923
13
$25,375
0
$0
2
$96,160
37
$63,033
APPLICATIONS WITHDRAWN
0
$0
3
$92,777
52
$94,082
5
$31,152
1
$165,360
1
$149,570
11
$71,371
FILES CLOSED FOR INCOMPLETENESS
3
$114,143
0
$0
7
$82,404
1
$33,760
0
$0
0
$0
1
$104,040
Aggregated Statistics For Year 2003 (Based on 2 partial tracts)
A) FHA, FSA/RHS & VA Home Purchase Loans
B) Conventional Home Purchase Loans
C) Refinancings
D) Home Improvement Loans
F) Non-occupant Loans on < 5 Family Dwellings (A B C & D)
Number
Average Value
Number
Average Value
Number
Average Value
Number
Average Value
Number
Average Value
LOANS ORIGINATED
2
$52,790
9
$109,382
26
$103,296
5
$11,748
7
$159,914
APPLICATIONS APPROVED, NOT ACCEPTED
0
$0
1
$30,380
6
$76,508
0
$0
1
$146,100
APPLICATIONS DENIED
0
$0
5
$64,008
14
$73,247
2
$14,055
1
$12,660
APPLICATIONS WITHDRAWN
0
$0
1
$77,480
6
$90,013
1
$17,220
0
$0
FILES CLOSED FOR INCOMPLETENESS
0
$0
0
$0
0
$0
0
$0
0
$0
Aggregated Statistics For Year 2002 (Based on 2 partial tracts)
A) FHA, FSA/RHS & VA Home Purchase Loans
B) Conventional Home Purchase Loans
C) Refinancings
D) Home Improvement Loans
F) Non-occupant Loans on < 5 Family Dwellings (A B C & D)
Number
Average Value
Number
Average Value
Number
Average Value
Number
Average Value
Number
Average Value
LOANS ORIGINATED
1
$50,130
6
$99,845
16
$89,759
3
$14,600
5
$122,296
APPLICATIONS APPROVED, NOT ACCEPTED
0
$0
1
$46,340
4
$109,510
0
$0
1
$98,750
APPLICATIONS DENIED
0
$0
3
$43,213
16
$62,746
2
$11,140
1
$46,590
APPLICATIONS WITHDRAWN
1
$76,470
1
$11,900
6
$88,113
1
$26,330
1
$28,860
FILES CLOSED FOR INCOMPLETENESS
0
$0
1
$46,080
1
$30,890
0
$0
0
$0
Aggregated Statistics For Year 2001 (Based on 2 partial tracts)
A) FHA, FSA/RHS & VA Home Purchase Loans
B) Conventional Home Purchase Loans
C) Refinancings
D) Home Improvement Loans
F) Non-occupant Loans on < 5 Family Dwellings (A B C & D)
Number
Average Value
Number
Average Value
Number
Average Value
Number
Average Value
Number
Average Value
LOANS ORIGINATED
2
$61,905
5
$103,660
16
$80,961
3
$8,777
3
$162,217
APPLICATIONS APPROVED, NOT ACCEPTED
0
$0
2
$39,880
3
$78,747
1
$30,380
1
$46,840
APPLICATIONS DENIED
0
$0
5
$46,134
16
$57,208
2
$14,685
0
$0
APPLICATIONS WITHDRAWN
0
$0
1
$95,960
5
$66,946
0
$0
0
$0
FILES CLOSED FOR INCOMPLETENESS
0
$0
0
$0
2
$51,020
0
$0
0
$0
Aggregated Statistics For Year 2000 (Based on 2 partial tracts)
A) FHA, FSA/RHS & VA Home Purchase Loans
B) Conventional Home Purchase Loans
C) Refinancings
D) Home Improvement Loans
F) Non-occupant Loans on < 5 Family Dwellings (A B C & D)
Number
Average Value
Number
Average Value
Number
Average Value
Number
Average Value
Number
Average Value
LOANS ORIGINATED
1
$63,810
7
$84,460
8
$108,655
4
$5,380
3
$76,043
APPLICATIONS APPROVED, NOT ACCEPTED
0
$0
3
$43,720
1
$86,340
1
$11,650
0
$0
APPLICATIONS DENIED
0
$0
7
$44,889
9
$50,556
2
$14,430
0
$0
APPLICATIONS WITHDRAWN
1
$94,440
1
$39,500
4
$54,058
0
$0
0
$0
FILES CLOSED FOR INCOMPLETENESS
0
$0
0
$0
1
$26,080
0
$0
0
$0
Aggregated Statistics For Year 1999 (Based on 1 partial tract)
B) Conventional Home Purchase Loans
C) Refinancings
D) Home Improvement Loans
F) Non-occupant Loans on < 5 Family Dwellings (A B C & D)
Detailed PMIC statistics for the following Tracts:0103.00
, 0209.00
2002 - 2018 National Fire Incident Reporting System (NFIRS) incidents
Based on the data from the years 2002 - 2018 the average number of fires per year is 23. The highest number of reported fire incidents - 53 took place in 2005, and the least - 4 in 2017. The data has a decreasing trend.
When looking into fire subcategories, the most reports belonged to: Structure Fires (47.7%), and Outside Fires (38.6%).
Fire incident types reported to NFIRS in Zip Code 24137


+$506
-$5,267
(% of AGI for various income ranges: 1.0% for AGIs below $10k, 1.5% for AGIs $10k-25k, 1.3% for AGIs $25k-50k, -0.8% for AGIs $50k-75k, -1.1% for AGIs $75k-100k)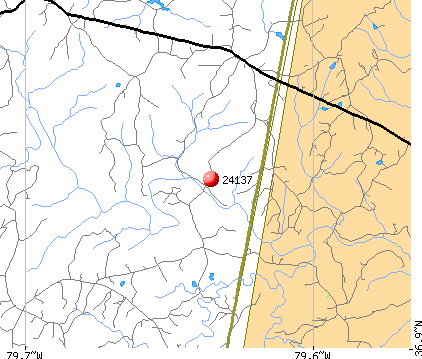 Nearest zip codes: 24176, 24530, 24161, 24092, 24139, 24184.


 Based on the data from the years 2002 - 2018 the average number of fires per year is 23. The highest number of reported fire incidents - 53 took place in 2005, and the least - 4 in 2017. The data has a decreasing trend.
 When looking into fire subcategories, the most reports belonged to: Structure Fires (47.7%), and Outside Fires (38.6%).