Estimated zip code population in 2022: 1,800 Zip code population in 2010: 1,990 Zip code population in 2000: 1,729
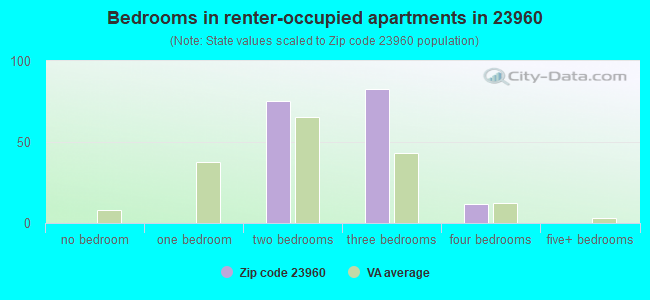
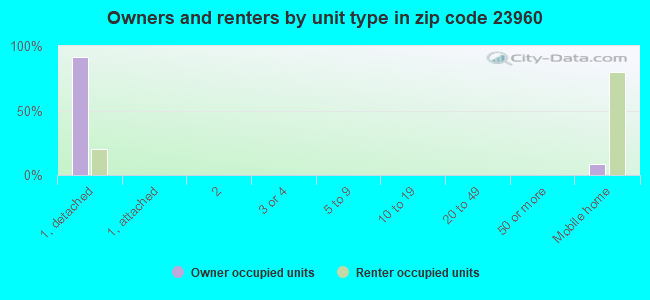
Houses and condos: 881 Renter-occupied apartments: 172
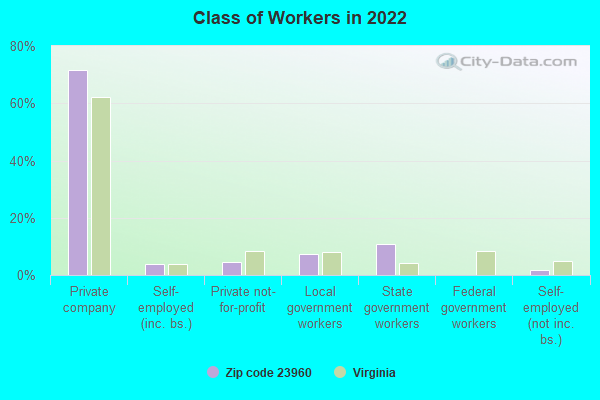
% of renters here:
23%
State:
33%
March 2022 cost of living index in zip code 23960: 82.8 (low, U.S. average is 100)
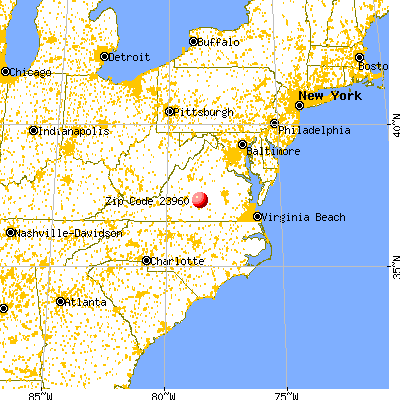
Land area: 43.0 sq. mi. Water area: 0.2 sq. mi.
Population density: 42 people per square mile
(very low).
OSM Map
General Map
Google Map
MSN Map
OSM Map
General Map
Google Map
MSN Map
OSM Map
General Map
Google Map
MSN Map
OSM Map
General Map
Google Map
MSN Map
Please wait while loading the map...
Real estate property taxes paid for housing units in 2022:
This zip code:
0.4% ($622)
Virginia:
0.7% ($2,617)
Median real estate property taxes paid for housing units with mortgages in 2022: $592 (0.3%) Median real estate property taxes paid for housing units with no mortgage in 2022: $1,172 (0.8%)
Business Search- 14 Million verified businesses
Males: 797
(44.3%)
Females: 1,002
(55.7%)
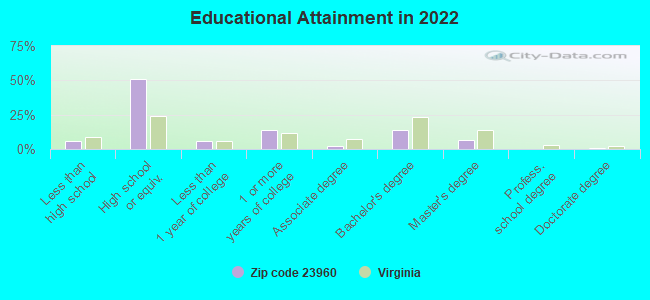
For population 25 years and over in 23960:
High school or higher: 93.8%
Bachelor's degree or higher: 21.0%
Graduate or professional degree: 7.5%
Unemployed: 2.0%
Mean travel time to work (commute): 26.8 minutes
For population 15 years and over in 23960:
Never married: 24.7%
Now married: 55.8%
Separated: 1.0%
Widowed: 9.4%
Divorced: 9.2%
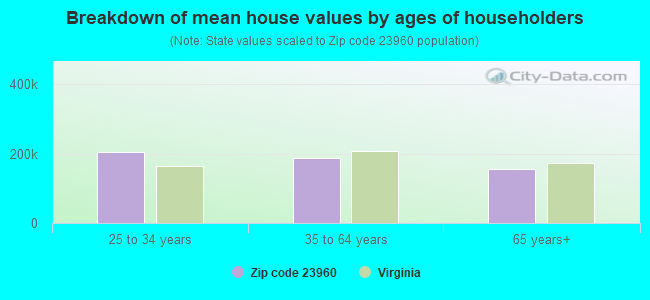
Zip code 23960 compared to state average:
Median house value below state average.
Unemployed percentage below state average.
Hispanic race population percentage significantly below state average.
Foreign-born population percentage significantly below state average.
Length of stay since moving in significantly below state average.
Percentage of population with a bachelor's degree or higher below state average.
Averages for the 2020 tax year for zip code 23960, filed in 2021:
Average Adjusted Gross Income (AGI) in 2020: $45,135 (Individual Income Tax Returns)
Here:
$45,135
State:
$86,446
Salary/wage: $37,692 (reported on 80.7% of returns)
Here:
$37,692
State:
$71,185
(% of AGI for various income ranges: 1192.1% for AGIs below $25k, 3587.4% for AGIs $25k-50k, 7055.7% for AGIs $50k-75k, 10270.0% for AGIs $75k-100k, 16505.0% for AGIs $100k-200k)
Taxable interest for individuals: $547 (reported on 21.6% of returns)
This zip code:
$547
Virginia:
$1,805
(% of AGI for various income ranges: 5.8% for AGIs below $25k, 15.7% for AGIs $25k-50k, 11.4% for AGIs $50k-75k, 10.0% for AGIs $75k-100k, 105.0% for AGIs $100k-200k)
Ordinary dividends: $3,250 (reported on 9.1% of returns)
Here:
$3,250
State:
$8,327
(% of AGI for various income ranges: 25.7% for AGIs $25k-50k, 80.0% for AGIs $50k-75k, 362.5% for AGIs $100k-200k)
Net capital gain/loss in AGI: +$15,275 (reported on 9.1% of returns)
Here:
+$15,275
State:
+$24,644
(% of AGI for various income ranges: 19.2% for AGIs below $25k, 211.4% for AGIs $50k-75k, 2570.0% for AGIs $100k-200k)
Profit/loss from business: +$5,375 (reported on 13.6% of returns)
Here:
+$5,375
State:
+$12,836
(% of AGI for various income ranges: 77.1% for AGIs below $25k, 109.1% for AGIs $25k-50k, 522.5% for AGIs $75k-100k)
Taxable individual retirement arrangement distribution: $15,420 (reported on 5.7% of returns)
23960:
$15,420
Virginia:
$21,535
(% of AGI for various income ranges: 123.3% for AGIs below $25k, 1187.5% for AGIs $75k-100k)
Total itemized deductions: $28,900 (reported on 4.5% of returns)
Here:
$28,900
State:
$33,287
(% of AGI for various income ranges: 1651.4% for AGIs $50k-75k)
Charity contributions: $6,875 (reported on 4.5% of returns)
Here:
$6,875
State:
$10,381
(% of AGI for various income ranges: 392.9% for AGIs $50k-75k)
Taxes paid: $5,725 (reported on 4.5% of returns)
23960:
$5,725
State:
$8,284
(% of AGI for various income ranges: 32.9% for AGIs below $25k, 375.0% for AGIs $75k-100k)
Earned income credit: $2,132 (reported on 21.6% of returns)
Here:
$2,132
State:
$2,214
(% of AGI for various income ranges: 104.2% for AGIs below $25k, 67.4% for AGIs $25k-50k)
Percentage of individuals using paid preparers for their 2020 taxes: 90.9%
Here:
91%
State:
92%
(% for various income ranges: 93.5% for AGIs below $25k, 90.0% for AGIs $25k-50k, 90.9% for AGIs $50k-75k, 85.7% for AGIs $75k-100k, 88.9% for AGIs $100k-200k)
Averages for the 2012 tax year for zip code 23960, filed in 2013:
Average Adjusted Gross Income (AGI) in 2012: $35,328 (Individual Income Tax Returns)
Here:
$35,328
State:
$71,192
Salary/wage: $30,485 (reported on 86.7% of returns)
Here:
$30,485
State:
$59,229
(% of AGI for various income ranges: 78.5% for AGIs below $25k, 79.5% for AGIs $25k-50k, 76.2% for AGIs $50k-75k, 80.2% for AGIs $75k-100k, 53.5% for AGIs $100k-200k)
Taxable interest for individuals: $453 (reported on 22.9% of returns)
This zip code:
$453
Virginia:
$1,600
(% of AGI for various income ranges: 0.6% for AGIs below $25k, 0.3% for AGIs $25k-50k, 0.1% for AGIs $50k-75k, 0.4% for AGIs $75k-100k)
Ordinary dividends: $1,486 (reported on 8.4% of returns)
Here:
$1,486
State:
$6,959
Net capital gain/loss in AGI: +$500 (reported on 7.2% of returns)
Here:
+$500
State:
+$16,672
Profit/loss from business: +$9,790 (reported on 12.0% of returns)
Here:
+$9,790
State:
+$14,116
(% of AGI for various income ranges: 5.7% for AGIs below $25k, 3.6% for AGIs $25k-50k, 6.1% for AGIs $50k-75k)
Taxable individual retirement arrangement distribution: $8,360 (reported on 6.0% of returns)
23960:
$8,360
Virginia:
$16,667
Total itemized deductions: $17,644 (28% of AGI, reported on 21.7% of returns)
Here:
$17,644
State:
$26,596
Here:
28.4% of AGI
State:
20.1% of AGI
(% of AGI for various income ranges: 14.9% for AGIs $25k-50k, 11.1% for AGIs $50k-75k, 12.1% for AGIs $75k-100k, 14.4% for AGIs $100k-200k)
Charity contributions: $4,320 (reported on 18.1% of returns)
Here:
$4,320
State:
$4,443
(% of AGI for various income ranges: 3.3% for AGIs $25k-50k, 1.5% for AGIs $50k-75k, 2.4% for AGIs $75k-100k, 3.6% for AGIs $100k-200k)
Taxes paid: $3,978 (reported on 21.7% of returns)
23960:
$3,978
State:
$9,951
(% of AGI for various income ranges: 2.3% for AGIs $25k-50k, 2.1% for AGIs $50k-75k, 4.0% for AGIs $75k-100k, 4.4% for AGIs $100k-200k)
Earned income credit: $2,467 (reported on 28.9% of returns)
Here:
$2,467
State:
$2,211
(% of AGI for various income ranges: 9.1% for AGIs below $25k, 1.3% for AGIs $25k-50k)
Percentage of individuals using paid preparers for their 2012 taxes: 55.4%
Here:
55%
State:
46%
(% for various income ranges: 52.5% for AGIs below $25k, 50.0% for AGIs $25k-50k, 60.0% for AGIs $50k-75k, 66.7% for AGIs $75k-100k, 100.0% for AGIs $100k-200k)
Averages for the 2004 tax year for zip code 23960, filed in 2005:
Average Adjusted Gross Income (AGI) in 2004: $30,075 (Individual Income Tax Returns)
Here:
$30,075
State:
$56,704
Salary/wage: $27,124 (reported on 88.7% of returns)
Here:
$27,124
State:
$48,441
(% of AGI for various income ranges: 111.0% for AGIs below $10k, 85.3% for AGIs $10k-25k, 82.5% for AGIs $25k-50k, 80.4% for AGIs $50k-75k, 80.3% for AGIs $75k-100k, 55.4% for AGIs over 100k)
Taxable interest for individuals: $1,418 (reported on 26.1% of returns)
This zip code:
$1,418
Virginia:
$1,688
(% of AGI for various income ranges: 1.5% for AGIs below $10k, 1.1% for AGIs $10k-25k, 1.0% for AGIs $25k-50k, 0.8% for AGIs $50k-75k, 0.0% for AGIs $75k-100k, 3.7% for AGIs over 100k)
Taxable dividends: $1,337 (reported on 11.2% of returns)
Here:
$1,337
State:
$4,028
(% of AGI for various income ranges: 0.4% for AGIs $10k-25k, 0.5% for AGIs $25k-50k, 0.5% for AGIs $50k-75k, 1.0% for AGIs over 100k)
Net capital gain/loss: +$1,571 (reported on 8.2% of returns)
Here:
+$1,571
State:
+$14,375
(% of AGI for various income ranges: -1.0% for AGIs below $10k, 1.0% for AGIs $25k-50k, -0.1% for AGIs $50k-75k, 1.8% for AGIs $75k-100k)
Profit/loss from business: +$7,424 (reported on 12.8% of returns)
Here:
+$7,424
State:
+$13,342
(% of AGI for various income ranges: 5.2% for AGIs below $10k, 4.7% for AGIs $10k-25k, 4.4% for AGIs $25k-50k, 2.8% for AGIs $50k-75k)
IRA payment deduction: $2,467 (reported on 1.9% of returns)
23960:
$2,467
Virginia:
$2,943
Total itemized deductions: $15,051 (27% of AGI, reported on 20.4% of returns)
Here:
$15,051
State:
$21,492
Here:
26.8% of AGI
State:
21.0% of AGI
(% of AGI for various income ranges: 5.5% for AGIs $10k-25k, 12.2% for AGIs $25k-50k, 10.5% for AGIs $50k-75k, 10.0% for AGIs $75k-100k, 14.0% for AGIs over 100k)
Charity contributions deductions: $3,604 (6% of AGI, reported on 18.0% of returns)
Here:
$3,604
State:
$3,794
Here:
6.4% of AGI
State:
3.5% of AGI
(% of AGI for various income ranges: 1.0% for AGIs $10k-25k, 2.3% for AGIs $25k-50k, 2.1% for AGIs $50k-75k, 1.5% for AGIs $75k-100k, 5.0% for AGIs over 100k)
Total tax: $3,429 (reported on 66.3% of returns)
23960:
$3,429
State:
$9,537
(% of AGI for various income ranges: 2.0% for AGIs below $10k, 3.4% for AGIs $10k-25k, 5.8% for AGIs $25k-50k, 8.6% for AGIs $50k-75k, 10.7% for AGIs $75k-100k, 15.9% for AGIs over 100k)
Earned income credit: $1,970 (reported on 29.8% of returns)
Here:
$1,970
State:
$1,734
Percentage of individuals using paid preparers for their 2004 taxes: 65.9%
Here:
66%
State:
52%
(% for various income ranges: 63.1% for AGIs below $10k, 68.8% for AGIs $10k-25k, 63.3% for AGIs $25k-50k, 69.1% for AGIs $50k-75k, 56.0% for AGIs $75k-100k, 78.9% for AGIs over 100k)
Household received Food Stamps/SNAP in the past 12 months: 220 Household did not receive Food Stamps/SNAP in the past 12 months: 557
Women who had a birth in the past 12 months: 86 (7 now married, 73 unmarried) Women who did not have a birth in the past 12 months: 355 (226 now married, 126 unmarried)
Housing units in zip code 23960 with a mortgage: 428 (20 second mortgage, 19 both second mortgage and home equity loan) Median monthly owner costs for units with a mortgage: $963 Median monthly owner costs for units without a mortgage: $434
Residents with income below the poverty level in 2022:
This zip code:
19.5%
Whole state:
10.6%
Residents with income below 50% of the poverty level in 2022:
This zip code:
6.4%
Whole state:
5.2%
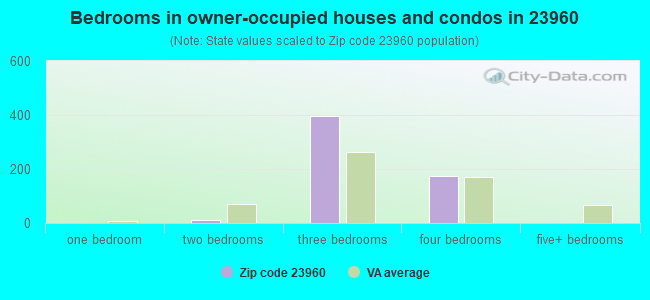
Median number of rooms in houses and condos:
Here:
6.2
State:
7.0
Median number of rooms in apartments:
Here:
4.6
State:
4.3
Notable locations in this zip code not listed on our city pages
Churches in zip code 23960 include: Appomattox Presbyterian Church (A), Saint James Church (B), Saint Pauls Church (C), Sulphur Spring Church (D), Prospect Methodist Church (E), Little Rock Church (F), Olive Branch Church (G), Peaks Church (H). Display/hide their locations on the map
Cemeteries: Sulphur Spring Cemetery (1), Sleepy Hollow Cemetery (2), Olive Branch Cemetery (3), Prospect Cemetery (4), Little Rock Cemetery (5). Display/hide their locations on the map
Streams, rivers, and creeks: Vaughans Creek (A), Rattler Branch (B), Plum Creek (C), Horsepen Creek (D), Harris Creek (E), Camp Branch (F), Cabin Branch (G). Display/hide their locations on the map
Size of family households: 209 2-persons, 227 3-persons, 76 4-persons, 85 5-persons, 13 7-or-more-persons
Size of nonfamily households: 127 1-person, 7 2-persons
241 married couples with children.
213 single-parent households (65 men, 148 women).
97.8% of residents of 23960 zip code speak English at home.
1.4% of residents speak other Indo-European language at home (58% very well, 42% not well).
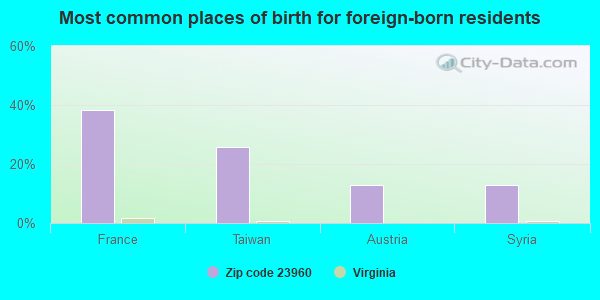
Foreign born population: 40 (2.2%) (71.5% of them are naturalized citizens)
This zip code:
2.2%
Whole state:
12.7%
38%France
26%Taiwan
13%Austria
13%Syria
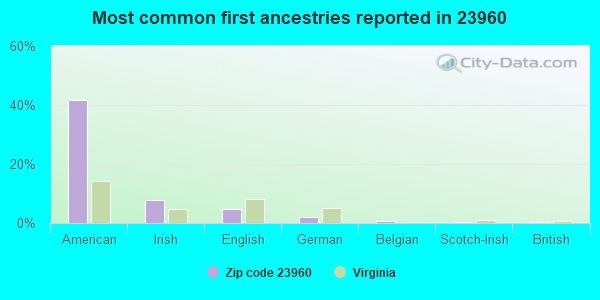
42%American
8%Irish
5%English
2%German
1%Belgian
0%Scotch-Irish
0%British
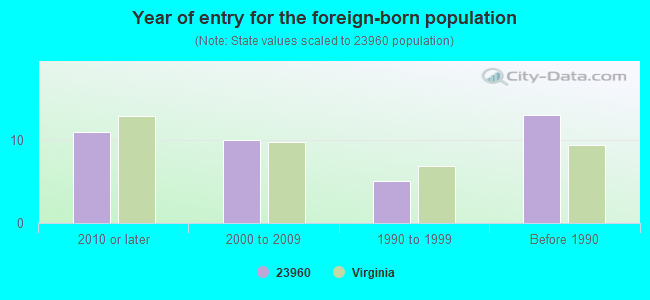
Year of entry for the foreign-born population
112010 or later
102000 to 2009
51990 to 1999
13Before 1990
Private school in in zip code 23960 not listed on the city page:
PROSPECT CHRISTIAN ACADEMY (Students: 14, Location: 4307 W PRINCE EDWARD HWY, Grades: UG)
Facilities with environmental interests located in this zip code:
B & F AUTO AND TRUCK PARTS INC (ROUTE 460 EAST in PROSPECT, VA)
AIR MINOR (AIRS/AFS) Business SIC classification: MOTOR VEHICLE PARTS, USED; GENERAL AUTOMOTIVE REPAIR SHOPS; AUTOMOTIVE REPAIR SHOPS
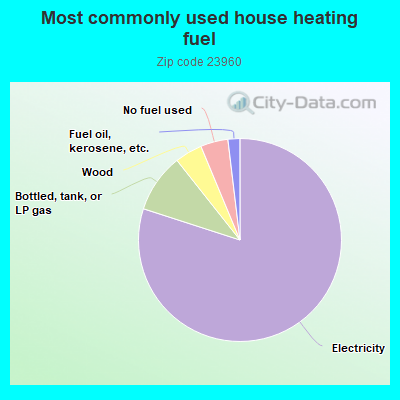
80.3%Electricity
9.4%Bottled, tank, or LP gas
4.4%Wood
4.4%No fuel used
1.9%Fuel oil, kerosene, etc.
Population in 1990: 1,661. Population change in the 1990s: +68 (+4.1%).
Place of birth for U.S.-born residents:
This state: 1,435
Northeast: 139
Midwest: 3
South: 81
West: 90
61% of the 23960 zip code residents lived in the same house 5 years ago. Out of people who lived in different houses, 54% lived in this county. Out of people who lived in different counties, 50% lived in Virginia.
95% of the 23960 zip code residents lived in the same house 1 year ago. Out of people who lived in different houses, 60% moved from this county. Out of people who lived in different houses, 28% moved from different county within same state. Out of people who lived in different houses, 12% moved from different state.
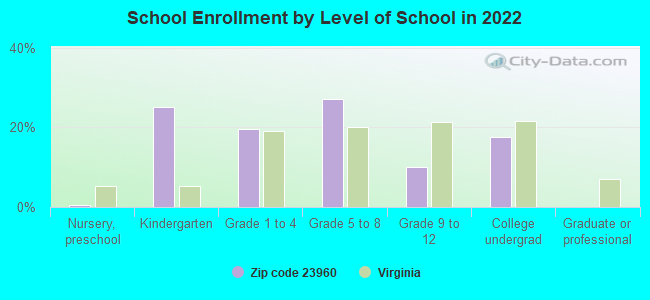
Private vs. public school enrollment:
Students in private schools in grades 1 to 8 (elementary and middle school): 1
Here:
0.6%
Virginia:
13.2%
Students in private schools in grades 9 to 12 (high school): 2
Here:
6.7%
Virginia:
10.2%
Students in private undergraduate colleges: 41
Here:
57.7%
Virginia:
18.7%
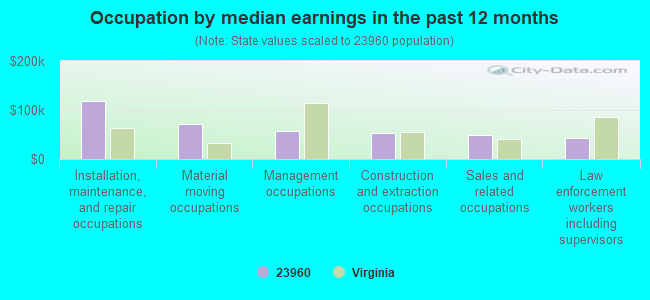
Occupation by median earnings in the past 12 months ($)
119,274Installation, maintenance, and repair occupations
70,524Material moving occupations
57,662Management occupations
52,128Construction and extraction occupations
49,036Sales and related occupations
43,171Law enforcement workers including supervisors
Top industries in this zip code by the number of employees in 2005:
Health Care and Social Assistance: Child Day Care Services (5-9 employees: 1 establishment)
Other Services (except Public Administration): Religious Organizations (1-4: 2)
Construction: Framing Contractors (1-4: 2)
Construction: Flooring Contractors (1-4: 1)
Fatal accident statistics in 2013:
Fatal accident count: 2
Vehicles involved in fatal accidents: 3
Fatal accidents caused by drunken drivers: 0
Fatalities: 2
Persons involved in fatal accidents: 5
Pedestrians involved in fatal accidents: 1
Fatal accident statistics in 2011:
Fatal accident count: 1
Vehicles involved in fatal accidents: 2
Fatal accidents caused by drunken drivers: 2
Fatalities: 2
Persons involved in fatal accidents: 3
Pedestrians involved in fatal accidents: 0
2004 - 2018 National Fire Incident Reporting System (NFIRS) incidents
According to the data from the years 2004 - 2018 the average number of fires per year is 17. The highest number of fires - 25 took place in 2009, and the least - 9 in 2011. The data has a dropping trend.
When looking into fire subcategories, the most incidents belonged to: Structure Fires (50.0%), and Outside Fires (31.5%).
Fire incident types reported to NFIRS in Zip Code 23960


 Nearest zip codes: 23958, 23943, 23901, 23934, 23909, 24522.


 (Students: 14, Location: 4307 W PRINCE EDWARD HWY, Grades: UG)

 According to the data from the years 2004 - 2018 the average number of fires per year is 17. The highest number of fires - 25 took place in 2009, and the least - 9 in 2011. The data has a dropping trend.
 When looking into fire subcategories, the most incidents belonged to: Structure Fires (50.0%), and Outside Fires (31.5%).