Estimated zip code population in 2022: 1,516 Zip code population in 2010: 1,469 Zip code population in 2000: 2,523
Houses and condos: 605 Renter-occupied apartments: 145
% of renters here:
25%
State:
33%
March 2022 cost of living index in zip code 22733: 127.4 (high, U.S. average is 100)
Land area: 47.5 sq. mi. Water area: 0.3 sq. mi.
Population density: 32 people per square mile
(very low).
OSM Map
General Map
Google Map
MSN Map
OSM Map
General Map
Google Map
MSN Map
OSM Map
General Map
Google Map
MSN Map
OSM Map
General Map
Google Map
MSN Map
Please wait while loading the map...
Real estate property taxes paid for housing units in 2022:
This zip code:
0.5% ($1,834)
Virginia:
0.7% ($2,617)
Median real estate property taxes paid for housing units with mortgages in 2022: $1,902 Median real estate property taxes paid for housing units with no mortgage in 2022: $1,846
Business Search- 14 Million verified businesses
Males: 697
(46.0%)
Females: 818
(54.0%)
For population 25 years and over in 22733:
High school or higher: 91.9%
Bachelor's degree or higher: 24.2%
Graduate or professional degree: 11.6%
Unemployed: 5.3%
Mean travel time to work (commute): 44.0 minutes
For population 15 years and over in 22733:
Never married: 27.0%
Now married: 57.7%
Separated: 2.8%
Widowed: 8.0%
Divorced: 4.5%
Zip code 22733 compared to state average:
Median age significantly above state average.
Foreign-born population percentage below state average.
Percentage of population with a bachelor's degree or higher below state average.
Estimated median house/condo value in 2022: $370,220
22733:
$370,220
Virginia:
$365,700
According to our research of Virginia and other state lists, there were 5 registered sex offenders living in 22733 zip code as of July 08, 2024. The ratio of all residents to sex offenders in zip code 22733 is 401 to 1. The ratio of registered sex offenders to all residents in this zip code is near the state average.
Median resident age:
This zip code:
48.8 years
Virginia median age:
39.0 years
Average household size:
This zip code:
2.5 people
Virginia:
2.5 people
Averages for the 2020 tax year for zip code 22733, filed in 2021:
Average Adjusted Gross Income (AGI) in 2020: $79,345 (Individual Income Tax Returns)
Here:
$79,345
State:
$86,446
Salary/wage: $55,198 (reported on 80.0% of returns)
Here:
$55,198
State:
$71,185
(% of AGI for various income ranges: 1242.1% for AGIs below $25k, 3919.0% for AGIs $25k-50k, 6865.0% for AGIs $50k-75k, 8938.0% for AGIs $75k-100k, 11751.4% for AGIs $100k-200k)
Taxable interest for individuals: $2,400 (reported on 24.6% of returns)
This zip code:
$2,400
Virginia:
$1,805
(% of AGI for various income ranges: 10.0% for AGIs below $25k, 31.7% for AGIs $50k-75k, 210.0% for AGIs $100k-200k)
Ordinary dividends: $17,092 (reported on 18.5% of returns)
Here:
$17,092
State:
$8,327
(% of AGI for various income ranges: 75.0% for AGIs below $25k, 118.3% for AGIs $50k-75k, 744.3% for AGIs $100k-200k)
Net capital gain/loss in AGI: +$23,720 (reported on 15.4% of returns)
Here:
+$23,720
State:
+$24,644
(% of AGI for various income ranges: 181.7% for AGIs $50k-75k, 545.7% for AGIs $100k-200k)
Profit/loss from business: +$10,027 (reported on 16.9% of returns)
Here:
+$10,027
State:
+$12,836
(% of AGI for various income ranges: 230.7% for AGIs below $25k, 201.0% for AGIs $25k-50k, 827.1% for AGIs $100k-200k)
Taxable individual retirement arrangement distribution: $22,300 (reported on 7.7% of returns)
22733:
$22,300
Virginia:
$21,535
(% of AGI for various income ranges: 155.7% for AGIs below $25k, 1281.4% for AGIs $100k-200k)
Total itemized deductions: $43,883 (reported on 9.2% of returns)
Here:
$43,883
State:
$33,287
(% of AGI for various income ranges: 493.0% for AGIs $25k-50k, 3057.1% for AGIs $100k-200k)
Charity contributions: $20,840 (reported on 7.7% of returns)
Here:
$20,840
State:
$10,381
(% of AGI for various income ranges: 1488.6% for AGIs $100k-200k)
Taxes paid: $8,417 (reported on 9.2% of returns)
22733:
$8,417
State:
$8,284
(% of AGI for various income ranges: 121.0% for AGIs $25k-50k, 548.6% for AGIs $100k-200k)
Earned income credit: $1,973 (reported on 16.9% of returns)
Here:
$1,973
State:
$2,214
(% of AGI for various income ranges: 111.4% for AGIs below $25k, 61.0% for AGIs $25k-50k)
Percentage of individuals using paid preparers for their 2020 taxes: 89.2%
Here:
89%
State:
92%
(% for various income ranges: 90.5% for AGIs below $25k, 85.7% for AGIs $25k-50k, 88.9% for AGIs $50k-75k, 85.7% for AGIs $75k-100k, 90.0% for AGIs $100k-200k, 100.0% for AGIs over 200k)
Averages for the 2012 tax year for zip code 22733, filed in 2013:
Average Adjusted Gross Income (AGI) in 2012: $58,620 (Individual Income Tax Returns)
Here:
$58,620
State:
$71,192
Salary/wage: $40,363 (reported on 83.1% of returns)
Here:
$40,363
State:
$59,229
(% of AGI for various income ranges: 72.0% for AGIs below $25k, 78.2% for AGIs $25k-50k, 66.0% for AGIs $50k-75k, 62.9% for AGIs $75k-100k, 98.9% for AGIs $100k-200k)
Taxable interest for individuals: $1,785 (reported on 33.9% of returns)
This zip code:
$1,785
Virginia:
$1,600
(% of AGI for various income ranges: 2.2% for AGIs below $25k, 1.0% for AGIs $25k-50k, 0.6% for AGIs $50k-75k, 0.8% for AGIs $75k-100k, 0.7% for AGIs $100k-200k, 1.3% for AGIs over 200k)
Ordinary dividends: $10,945 (reported on 18.6% of returns)
Here:
$10,945
State:
$6,959
(% of AGI for various income ranges: 0.6% for AGIs below $25k, 2.5% for AGIs $25k-50k, 0.6% for AGIs $75k-100k, 12.8% for AGIs $100k-200k)
Net capital gain/loss in AGI: +$1,200 (reported on 13.6% of returns)
Here:
+$1,200
State:
+$16,672
(% of AGI for various income ranges: 0.6% for AGIs $75k-100k, 0.7% for AGIs over 200k)
Profit/loss from business: +$15,260 (reported on 16.9% of returns)
Here:
+$15,260
State:
+$14,116
(% of AGI for various income ranges: 13.9% for AGIs below $25k, 5.9% for AGIs $50k-75k, 10.3% for AGIs $100k-200k)
Taxable individual retirement arrangement distribution: $15,280 (reported on 8.5% of returns)
22733:
$15,280
Virginia:
$16,667
Total itemized deductions: $26,350 (22% of AGI, reported on 33.9% of returns)
Here:
$26,350
State:
$26,596
Here:
22.2% of AGI
State:
20.1% of AGI
(% of AGI for various income ranges: 20.4% for AGIs $25k-50k, 16.2% for AGIs $50k-75k, 20.3% for AGIs $75k-100k, 14.6% for AGIs $100k-200k, 15.5% for AGIs over 200k)
Charity contributions: $6,260 (reported on 25.4% of returns)
Here:
$6,260
State:
$4,443
(% of AGI for various income ranges: 1.7% for AGIs $25k-50k, 0.9% for AGIs $50k-75k, 2.3% for AGIs $75k-100k, 2.5% for AGIs $100k-200k, 5.3% for AGIs over 200k)
Taxes paid: $9,335 (reported on 33.9% of returns)
22733:
$9,335
State:
$9,951
(% of AGI for various income ranges: 4.0% for AGIs $25k-50k, 5.9% for AGIs $50k-75k, 5.3% for AGIs $75k-100k, 5.5% for AGIs $100k-200k, 7.7% for AGIs over 200k)
Earned income credit: $2,354 (reported on 22.0% of returns)
Here:
$2,354
State:
$2,211
(% of AGI for various income ranges: 7.7% for AGIs below $25k, 1.0% for AGIs $25k-50k)
Percentage of individuals using paid preparers for their 2012 taxes: 57.6%
Here:
58%
State:
46%
(% for various income ranges: 57.7% for AGIs below $25k, 53.8% for AGIs $25k-50k, 66.7% for AGIs $50k-75k, 50.0% for AGIs $75k-100k, 50.0% for AGIs $100k-200k, 100.0% for AGIs over 200k)
Averages for the 2004 tax year for zip code 22733, filed in 2005:
Average Adjusted Gross Income (AGI) in 2004: $48,510 (Individual Income Tax Returns)
Here:
$48,510
State:
$56,704
Salary/wage: $35,275 (reported on 83.8% of returns)
Here:
$35,275
State:
$48,441
(% of AGI for various income ranges: 138.7% for AGIs below $10k, 83.7% for AGIs $10k-25k, 74.8% for AGIs $25k-50k, 79.0% for AGIs $50k-75k, 67.2% for AGIs $75k-100k, 34.5% for AGIs over 100k)
Taxable interest for individuals: $2,208 (reported on 37.1% of returns)
This zip code:
$2,208
Virginia:
$1,688
(% of AGI for various income ranges: 7.1% for AGIs below $10k, 0.4% for AGIs $10k-25k, 1.6% for AGIs $25k-50k, 1.0% for AGIs $50k-75k, 1.9% for AGIs $75k-100k, 2.1% for AGIs over 100k)
Taxable dividends: $6,746 (reported on 21.6% of returns)
Here:
$6,746
State:
$4,028
(% of AGI for various income ranges: 5.5% for AGIs below $10k, 0.4% for AGIs $10k-25k, 1.1% for AGIs $25k-50k, 0.5% for AGIs $50k-75k, 1.9% for AGIs $75k-100k, 6.2% for AGIs over 100k)
Net capital gain/loss: +$20,873 (reported on 17.5% of returns)
Here:
+$20,873
State:
+$14,375
(% of AGI for various income ranges: -1.9% for AGIs below $10k, 0.1% for AGIs $25k-50k, 1.1% for AGIs $50k-75k, 2.6% for AGIs $75k-100k, 18.5% for AGIs over 100k)
Profit/loss from business: +$11,298 (reported on 14.4% of returns)
Here:
+$11,298
State:
+$13,342
(% of AGI for various income ranges: -3.8% for AGIs below $10k, -1.1% for AGIs $10k-25k, 4.2% for AGIs $25k-50k, 1.2% for AGIs $50k-75k, 14.7% for AGIs $75k-100k)
Self-employed pension: $22,600 (reported on 1.7% of returns)
Here:
$22,600
Virginia:
$17,430
Total itemized deductions: $20,095 (22% of AGI, reported on 32.6% of returns)
Here:
$20,095
State:
$21,492
Here:
21.5% of AGI
State:
21.0% of AGI
(% of AGI for various income ranges: 7.5% for AGIs $10k-25k, 15.1% for AGIs $25k-50k, 14.7% for AGIs $50k-75k, 16.8% for AGIs $75k-100k, 12.5% for AGIs over 100k)
Charity contributions deductions: $4,819 (5% of AGI, reported on 26.6% of returns)
Here:
$4,819
State:
$3,794
Here:
4.8% of AGI
State:
3.5% of AGI
(% of AGI for various income ranges: 5.0% for AGIs below $10k, 1.9% for AGIs $25k-50k, 1.6% for AGIs $50k-75k, 2.5% for AGIs $75k-100k, 4.1% for AGIs over 100k)
Total tax: $7,928 (reported on 73.7% of returns)
22733:
$7,928
State:
$9,537
(% of AGI for various income ranges: 2.4% for AGIs below $10k, 3.2% for AGIs $10k-25k, 6.7% for AGIs $25k-50k, 7.9% for AGIs $50k-75k, 10.4% for AGIs $75k-100k, 19.6% for AGIs over 100k)
Earned income credit: $1,588 (reported on 17.5% of returns)
Here:
$1,588
State:
$1,734
Percentage of individuals using paid preparers for their 2004 taxes: 66.2%
Here:
66%
State:
52%
(% for various income ranges: 56.5% for AGIs below $10k, 67.4% for AGIs $10k-25k, 69.5% for AGIs $25k-50k, 63.3% for AGIs $50k-75k, 64.9% for AGIs $75k-100k, 86.7% for AGIs over 100k)
Household received Food Stamps/SNAP in the past 12 months: 151 Household did not receive Food Stamps/SNAP in the past 12 months: 443
Women who did not have a birth in the past 12 months: 375 (206 now married, 167 unmarried)
Housing units in zip code 22733 with a mortgage: 205 (38 second mortgage, 35 home equity loan, 11 both second mortgage and home equity loan) Median monthly owner costs for units with a mortgage: $1,838 Median monthly owner costs for units without a mortgage: $509
Residents with income below the poverty level in 2022:
This zip code:
18.0%
Whole state:
10.6%
Residents with income below 50% of the poverty level in 2022:
This zip code:
11.7%
Whole state:
5.2%
Median number of rooms in houses and condos:
Here:
6.4
State:
7.0
Median number of rooms in apartments:
Here:
5.0
State:
4.3
Notable locations in this zip code not listed on our city pages
Churches in zip code 22733 include: All Saints Church (A), Cedar Grove Church (B), Crooked Run Church (C), White Oak Run Church (D), Hopewell Church (E), Emmanuel Episcopal Church (F), Emmanuel Church (G). Display/hide their locations on the map
In group quarters: 41 (-1 institutionalized population)
Size of family households: 281 2-persons, 108 3-persons, 77 4-persons, 55 5-persons
Size of nonfamily households: 51 1-person
102 married couples with children.
69 single-parent households (21 men, 48 women).
90.0% of residents of 22733 zip code speak English at home.
9.0% of residents speak Spanish at home (60% very well, 40% well).
0.4% of residents speak other Indo-European language at home (100% well).
Foreign born population: 108 (7.2%) (28.3% of them are naturalized citizens)
This zip code:
7.2%
Whole state:
12.7%
109%Chile
19%English
8%Irish
6%American
1%European
1%Italian
1%British
Year of entry for the foreign-born population
942010 or later
02000 to 2009
01990 to 1999
27Before 1990
61.6%Electricity
20.4%Fuel oil, kerosene, etc.
9.1%Wood
8.0%Bottled, tank, or LP gas
1.2%No fuel used
Population in 1990: 1,216. Population change in the 1990s: +1,307 (+107.5%).
Place of birth for U.S.-born residents:
This state: 1,018
Northeast: 14
Midwest: 90
South: 218
West: 55
52% of the 22733 zip code residents lived in the same house 5 years ago. Out of people who lived in different houses, 48% lived in this county. Out of people who lived in different counties, 50% lived in Virginia.
86% of the 22733 zip code residents lived in the same house 1 year ago. Out of people who lived in different houses, 31% moved from this county. Out of people who lived in different houses, 20% moved from different county within same state. Out of people who lived in different houses, 48% moved from different state.
Private vs. public school enrollment:
Students in private schools in grades 1 to 8 (elementary and middle school): 55
Here:
34.6%
Virginia:
13.2%
Students in private schools in grades 9 to 12 (high school): 50
Here:
59.5%
Virginia:
10.2%
Students in private undergraduate colleges: 9
Here:
12.0%
Virginia:
18.7%
Occupation by median earnings in the past 12 months ($)
87,882Transportation occupations
80,009Management occupations
45,585Building and grounds cleaning and maintenance occupations
35,547Construction and extraction occupations
28,573Office and administrative support occupations
14,800Sales and related occupations
Top industries in this zip code by the number of employees in 2005:
Educational Services: All Other Miscellaneous Schools and Instruction (50-99 employees: 1 establishment)
Health Care and Social Assistance: Offices of Physicians (except Mental Health Specialists) (10-19: 1)
Administrative and Support and Waste Management and Remediation Services: Landscaping Services (5-9: 1, 1-4: 1)
Other Services (except Public Administration): Automotive Body, Paint, and Interior Repair and Maintenance (5-9: 1)
Mining: Crushed and Broken Granite Mining and Quarrying (5-9: 1)
Arts, Entertainment, and Recreation: All Other Amusement and Recreation Industries (1-4: 1)
Other Services (except Public Administration): Environment, Conservation and Wildlife Organizations (1-4: 1)
Construction: New Single-Family Housing Construction (except Operative Builders) (1-4: 1)
People in group quarters in 2010:
148 people in correctional facilities intended for juveniles
People in group quarters in 2000:
1,223 people in federal prisons and detention centers
144 people in homes for abused, dependent, and neglected children
50 people in college dormitories (includes college quarters off campus)
Fatal accident statistics in 2013:
Fatal accident count: 1
Vehicles involved in fatal accidents: 1
Fatal accidents caused by drunken drivers: 0
Fatalities: 1
Persons involved in fatal accidents: 1
Pedestrians involved in fatal accidents: 0
Fatal accident statistics in 2012:
Fatal accident count: 3
Vehicles involved in fatal accidents: 4
Fatal accidents caused by drunken drivers: 0
Fatalities: 3
Persons involved in fatal accidents: 4
Pedestrians involved in fatal accidents: 0
Home Mortgage Disclosure Act Aggregated Statistics For Year 2003 (Based on 2 partial tracts)
A) FHA, FSA/RHS & VA Home Purchase Loans
B) Conventional Home Purchase Loans
C) Refinancings
D) Home Improvement Loans
F) Non-occupant Loans on < 5 Family Dwellings (A B C & D)
Number
Average Value
Number
Average Value
Number
Average Value
Number
Average Value
Number
Average Value
LOANS ORIGINATED
13
$149,038
70
$149,552
249
$134,790
11
$40,865
21
$87,764
APPLICATIONS APPROVED, NOT ACCEPTED
1
$206,680
8
$162,938
41
$119,300
3
$11,623
3
$104,610
APPLICATIONS DENIED
1
$221,270
9
$168,503
103
$127,489
7
$23,459
3
$153,007
APPLICATIONS WITHDRAWN
3
$157,443
8
$171,259
48
$145,556
3
$38,673
3
$83,267
FILES CLOSED FOR INCOMPLETENESS
0
$0
3
$158,290
12
$143,231
0
$0
1
$90,660
Detailed HMDA statistics for the following Tracts:9905.00
Private Mortgage Insurance Companies Aggregated Statistics For Year 2003 (Based on 2 partial tracts)
A) Conventional Home Purchase Loans
B) Refinancings
C) Non-occupant Loans on < 5 Family Dwellings (A & B)
Number
Average Value
Number
Average Value
Number
Average Value
LOANS ORIGINATED
14
$185,898
18
$146,666
2
$90,660
APPLICATIONS APPROVED, NOT ACCEPTED
1
$77,350
7
$192,374
0
$0
APPLICATIONS DENIED
0
$0
0
$0
0
$0
APPLICATIONS WITHDRAWN
0
$0
2
$148,675
0
$0
FILES CLOSED FOR INCOMPLETENESS
0
$0
0
$0
0
$0
Detailed PMIC statistics for the following Tracts:9905.00
2004 - 2018 National Fire Incident Reporting System (NFIRS) incidents
According to the data from the years 2004 - 2018 the average number of fires per year is 8. The highest number of reported fire incidents - 17 took place in 2014, and the least - 2 in 2004. The data has a growing trend.
When looking into fire subcategories, the most incidents belonged to: Outside Fires (45.5%), and Structure Fires (38.0%).
Fire incident types reported to NFIRS in Zip Code 22733

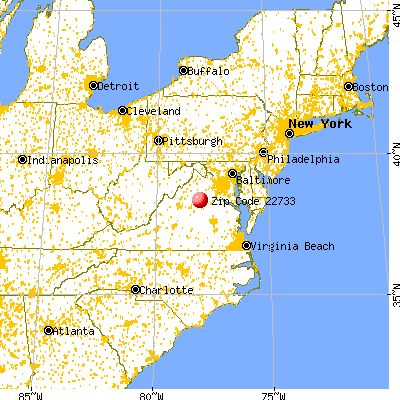


 Nearest zip codes: 22729, 22948, 22989, 22701, 22960, 22730.


 According to the data from the years 2004 - 2018 the average number of fires per year is 8. The highest number of reported fire incidents - 17 took place in 2014, and the least - 2 in 2004. The data has a growing trend.
 When looking into fire subcategories, the most incidents belonged to: Outside Fires (45.5%), and Structure Fires (38.0%).