Estimated zip code population in 2022: 7,449 Zip code population in 2010: 6,467 Zip code population in 2000: 5,261
Houses and condos: 3,359 Renter-occupied apartments: 1,014
% of renters here:
32%
State:
32%
March 2022 cost of living index in zip code 21875: 91.7 (less than average, U.S. average is 100)
Land area: 23.5 sq. mi. Water area: 0.0 sq. mi.
Population density: 317 people per square mile
(very low).
OSM Map
General Map
Google Map
MSN Map
OSM Map
General Map
Google Map
MSN Map
OSM Map
General Map
Google Map
MSN Map
OSM Map
General Map
Google Map
MSN Map
Please wait while loading the map...
Real estate property taxes paid for housing units in 2022:
This zip code:
0.8% ($1,839)
Maryland:
0.9% ($3,777)
Median real estate property taxes paid for housing units with mortgages in 2022: $1,978 (0.9%) Median real estate property taxes paid for housing units with no mortgage in 2022: $1,495 (0.7%)
Business Search- 14 Million verified businesses
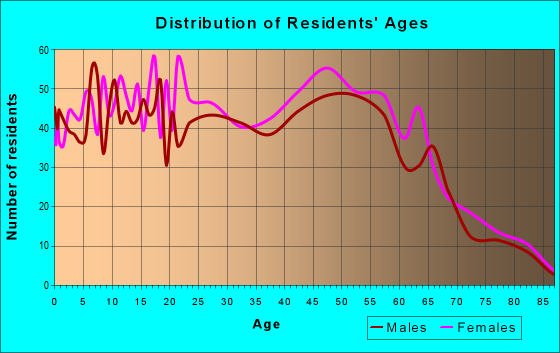
Males: 3,596
(48.3%)
Females: 3,853
(51.7%)
For population 25 years and over in 21875:
High school or higher: 85.5%
Bachelor's degree or higher: 27.0%
Graduate or professional degree: 8.2%
Unemployed: 6.2%
Mean travel time to work (commute): 22.0 minutes
For population 15 years and over in 21875:
Never married: 34.0%
Now married: 47.2%
Separated: 1.6%
Widowed: 3.2%
Divorced: 13.9%
Zip code 21875 compared to state average:
Median house value below state average.
Black race population percentage below state average.
Foreign-born population percentage below state average.
Percentage of population with a bachelor's degree or higher below state average.
Averages for the 2020 tax year for zip code 21875, filed in 2021:
Average Adjusted Gross Income (AGI) in 2020: $55,338 (Individual Income Tax Returns)
Here:
$55,338
State:
$86,905
Salary/wage: $50,678 (reported on 83.5% of returns)
Here:
$50,678
State:
$73,953
(% of AGI for various income ranges: 1138.6% for AGIs below $25k, 3511.5% for AGIs $25k-50k, 6631.0% for AGIs $50k-75k, 10017.8% for AGIs $75k-100k, 18412.4% for AGIs $100k-200k, 48450.0% for AGIs over 200k)
Taxable interest for individuals: $1,004 (reported on 27.5% of returns)
This zip code:
$1,004
Maryland:
$1,528
(% of AGI for various income ranges: 8.6% for AGIs below $25k, 15.1% for AGIs $25k-50k, 32.1% for AGIs $50k-75k, 58.7% for AGIs $75k-100k, 64.0% for AGIs $100k-200k, 1150.0% for AGIs over 200k)
Ordinary dividends: $3,166 (reported on 11.9% of returns)
Here:
$3,166
State:
$8,028
(% of AGI for various income ranges: 11.9% for AGIs below $25k, 19.3% for AGIs $25k-50k, 33.3% for AGIs $50k-75k, 98.3% for AGIs $75k-100k, 156.4% for AGIs $100k-200k, 1013.3% for AGIs over 200k)
Net capital gain/loss in AGI: +$10,371 (reported on 9.9% of returns)
Here:
+$10,371
State:
+$25,238
(% of AGI for various income ranges: 19.3% for AGIs $25k-50k, 41.2% for AGIs $50k-75k, 79.6% for AGIs $75k-100k, 441.6% for AGIs $100k-200k, 6456.7% for AGIs over 200k)
Profit/loss from business: +$8,561 (reported on 16.5% of returns)
Here:
+$8,561
State:
+$11,398
(% of AGI for various income ranges: 171.3% for AGIs below $25k, 180.7% for AGIs $25k-50k, 261.2% for AGIs $50k-75k, 164.3% for AGIs $75k-100k, 273.2% for AGIs $100k-200k)
Taxable individual retirement arrangement distribution: $12,727 (reported on 8.7% of returns)
21875:
$12,727
Maryland:
$20,944
(% of AGI for various income ranges: 45.2% for AGIs below $25k, 78.9% for AGIs $25k-50k, 175.0% for AGIs $50k-75k, 267.4% for AGIs $75k-100k, 611.2% for AGIs $100k-200k)
Total itemized deductions: $24,838 (reported on 9.3% of returns)
Here:
$24,838
State:
$30,672
(% of AGI for various income ranges: 149.2% for AGIs $25k-50k, 386.7% for AGIs $50k-75k, 695.7% for AGIs $75k-100k, 1008.4% for AGIs $100k-200k, 3813.3% for AGIs over 200k)
Charity contributions: $8,016 (reported on 7.2% of returns)
Here:
$8,016
State:
$9,065
(% of AGI for various income ranges: 23.7% for AGIs $25k-50k, 73.3% for AGIs $50k-75k, 207.4% for AGIs $75k-100k, 257.2% for AGIs $100k-200k, 1360.0% for AGIs over 200k)
Taxes paid: $7,372 (reported on 9.3% of returns)
21875:
$7,372
State:
$8,475
(% of AGI for various income ranges: 29.9% for AGIs $25k-50k, 112.6% for AGIs $50k-75k, 219.6% for AGIs $75k-100k, 327.6% for AGIs $100k-200k, 1166.7% for AGIs over 200k)
Earned income credit: $2,303 (reported on 16.8% of returns)
Here:
$2,303
State:
$2,151
(% of AGI for various income ranges: 95.4% for AGIs below $25k, 75.4% for AGIs $25k-50k)
Percentage of individuals using paid preparers for their 2020 taxes: 92.8%
Here:
93%
State:
90%
(% for various income ranges: 90.3% for AGIs below $25k, 94.4% for AGIs $25k-50k, 93.0% for AGIs $50k-75k, 91.4% for AGIs $75k-100k, 95.3% for AGIs $100k-200k, 100.0% for AGIs over 200k)
Averages for the 2012 tax year for zip code 21875, filed in 2013:
Average Adjusted Gross Income (AGI) in 2012: $45,359 (Individual Income Tax Returns)
Here:
$45,359
State:
$72,703
Salary/wage: $40,921 (reported on 86.5% of returns)
Here:
$40,921
State:
$62,228
(% of AGI for various income ranges: 75.2% for AGIs below $25k, 80.6% for AGIs $25k-50k, 79.9% for AGIs $50k-75k, 81.3% for AGIs $75k-100k, 77.5% for AGIs $100k-200k, 58.8% for AGIs over 200k)
Taxable interest for individuals: $827 (reported on 33.7% of returns)
This zip code:
$827
Maryland:
$1,413
(% of AGI for various income ranges: 1.4% for AGIs below $25k, 0.6% for AGIs $25k-50k, 0.5% for AGIs $50k-75k, 0.4% for AGIs $75k-100k, 0.7% for AGIs $100k-200k)
Ordinary dividends: $1,768 (reported on 13.5% of returns)
Here:
$1,768
State:
$6,933
(% of AGI for various income ranges: 0.7% for AGIs below $25k, 0.3% for AGIs $25k-50k, 0.4% for AGIs $50k-75k, 0.7% for AGIs $75k-100k, 0.7% for AGIs $100k-200k)
Net capital gain/loss in AGI: +$2,374 (reported on 8.9% of returns)
Here:
+$2,374
State:
+$14,830
(% of AGI for various income ranges: 0.4% for AGIs $50k-75k, 0.3% for AGIs $75k-100k, 1.6% for AGIs $100k-200k)
Profit/loss from business: +$6,860 (reported on 13.9% of returns)
Here:
+$6,860
State:
+$12,606
(% of AGI for various income ranges: 7.2% for AGIs below $25k, 3.3% for AGIs $25k-50k, 0.6% for AGIs $50k-75k, 1.3% for AGIs $75k-100k, 1.0% for AGIs $100k-200k)
Taxable individual retirement arrangement distribution: $11,974 (reported on 8.9% of returns)
21875:
$11,974
Maryland:
$17,065
(% of AGI for various income ranges: 3.0% for AGIs below $25k, 2.2% for AGIs $25k-50k, 1.8% for AGIs $50k-75k, 2.8% for AGIs $75k-100k, 2.9% for AGIs $100k-200k)
Total itemized deductions: $18,859 (24% of AGI, reported on 34.3% of returns)
Here:
$18,859
State:
$27,886
Here:
24.4% of AGI
State:
22.8% of AGI
(% of AGI for various income ranges: 8.9% for AGIs below $25k, 12.4% for AGIs $25k-50k, 15.3% for AGIs $50k-75k, 15.1% for AGIs $75k-100k, 17.6% for AGIs $100k-200k, 10.8% for AGIs over 200k)
Charity contributions: $3,099 (reported on 27.1% of returns)
Here:
$3,099
State:
$4,452
(% of AGI for various income ranges: 0.7% for AGIs below $25k, 1.6% for AGIs $25k-50k, 2.1% for AGIs $50k-75k, 1.8% for AGIs $75k-100k, 2.5% for AGIs $100k-200k, 1.4% for AGIs over 200k)
Taxes paid: $6,869 (reported on 34.0% of returns)
21875:
$6,869
State:
$11,690
(% of AGI for various income ranges: 1.4% for AGIs below $25k, 3.4% for AGIs $25k-50k, 5.0% for AGIs $50k-75k, 6.1% for AGIs $75k-100k, 7.2% for AGIs $100k-200k, 7.0% for AGIs over 200k)
Earned income credit: $2,198 (reported on 21.1% of returns)
Here:
$2,198
State:
$2,199
(% of AGI for various income ranges: 7.1% for AGIs below $25k, 1.1% for AGIs $25k-50k)
Percentage of individuals using paid preparers for their 2012 taxes: 49.2%
Here:
49%
State:
52%
(% for various income ranges: 44.7% for AGIs below $25k, 48.1% for AGIs $25k-50k, 50.0% for AGIs $50k-75k, 57.1% for AGIs $75k-100k, 59.3% for AGIs $100k-200k, 100.0% for AGIs over 200k)
Averages for the 2004 tax year for zip code 21875, filed in 2005:
Average Adjusted Gross Income (AGI) in 2004: $38,709 (Individual Income Tax Returns)
Here:
$38,709
State:
$60,339
Salary/wage: $35,292 (reported on 88.6% of returns)
Here:
$35,292
State:
$52,211
(% of AGI for various income ranges: 134.4% for AGIs below $10k, 82.8% for AGIs $10k-25k, 84.9% for AGIs $25k-50k, 80.5% for AGIs $50k-75k, 85.6% for AGIs $75k-100k, 68.7% for AGIs over 100k)
Taxable interest for individuals: $1,477 (reported on 39.2% of returns)
This zip code:
$1,477
Maryland:
$1,701
(% of AGI for various income ranges: 4.2% for AGIs below $10k, 1.6% for AGIs $10k-25k, 0.7% for AGIs $25k-50k, 1.5% for AGIs $50k-75k, 0.7% for AGIs $75k-100k, 2.6% for AGIs over 100k)
Taxable dividends: $1,879 (reported on 16.6% of returns)
Here:
$1,879
State:
$4,235
(% of AGI for various income ranges: 1.8% for AGIs below $10k, 0.9% for AGIs $10k-25k, 0.2% for AGIs $25k-50k, 0.9% for AGIs $50k-75k, 1.0% for AGIs $75k-100k, 1.1% for AGIs over 100k)
Net capital gain/loss: +$5,337 (reported on 10.8% of returns)
Here:
+$5,337
State:
+$15,888
(% of AGI for various income ranges: -1.8% for AGIs below $10k, -0.4% for AGIs $10k-25k, 0.2% for AGIs $25k-50k, 0.7% for AGIs $50k-75k, 1.4% for AGIs $75k-100k, 4.7% for AGIs over 100k)
Profit/loss from business: +$7,246 (reported on 14.4% of returns)
Here:
+$7,246
State:
+$12,221
(% of AGI for various income ranges: 9.9% for AGIs below $10k, 5.7% for AGIs $10k-25k, 3.1% for AGIs $25k-50k, 2.2% for AGIs $50k-75k, 1.2% for AGIs $75k-100k, 1.9% for AGIs over 100k)
IRA payment deduction: $2,594 (reported on 2.7% of returns)
21875:
$2,594
Maryland:
$2,968
(% of AGI for various income ranges: 0.2% for AGIs $10k-25k, 0.3% for AGIs $25k-50k, 0.1% for AGIs $50k-75k, 0.4% for AGIs $75k-100k)
Total itemized deductions: $15,694 (22% of AGI, reported on 35.0% of returns)
Here:
$15,694
State:
$22,960
Here:
22.3% of AGI
State:
23.3% of AGI
(% of AGI for various income ranges: 14.4% for AGIs below $10k, 7.9% for AGIs $10k-25k, 12.9% for AGIs $25k-50k, 15.8% for AGIs $50k-75k, 17.0% for AGIs $75k-100k, 15.1% for AGIs over 100k)
Charity contributions deductions: $2,669 (4% of AGI, reported on 30.3% of returns)
Here:
$2,669
State:
$4,031
Here:
3.7% of AGI
State:
3.9% of AGI
(% of AGI for various income ranges: 1.3% for AGIs below $10k, 0.9% for AGIs $10k-25k, 1.9% for AGIs $25k-50k, 2.2% for AGIs $50k-75k, 3.0% for AGIs $75k-100k, 2.2% for AGIs over 100k)
Total tax: $5,061 (reported on 73.6% of returns)
21875:
$5,061
State:
$10,167
(% of AGI for various income ranges: 3.7% for AGIs below $10k, 4.0% for AGIs $10k-25k, 6.5% for AGIs $25k-50k, 8.4% for AGIs $50k-75k, 10.0% for AGIs $75k-100k, 16.6% for AGIs over 100k)
Earned income credit: $1,688 (reported on 18.8% of returns)
Here:
$1,688
State:
$1,700
Percentage of individuals using paid preparers for their 2004 taxes: 56.4%
Here:
56%
State:
55%
(% for various income ranges: 44.8% for AGIs below $10k, 56.3% for AGIs $10k-25k, 58.0% for AGIs $25k-50k, 62.6% for AGIs $50k-75k, 59.8% for AGIs $75k-100k, 70.9% for AGIs over 100k)
Household received Food Stamps/SNAP in the past 12 months: 542 Household did not receive Food Stamps/SNAP in the past 12 months: 2,663
Women who had a birth in the past 12 months: 78 (79 now married, 0 unmarried) Women who did not have a birth in the past 12 months: 1,735 (708 now married, 1,026 unmarried)
Housing units in zip code 21875 with a mortgage: 1,442 (62 second mortgage, 46 both second mortgage and home equity loan) Houses without a mortgage: 63
Median monthly owner costs for units with a mortgage: $1,407 Median monthly owner costs for units without a mortgage: $553
Residents with income below the poverty level in 2022:
This zip code:
10.9%
Whole state:
9.6%
Residents with income below 50% of the poverty level in 2022:
This zip code:
4.0%
Whole state:
4.7%
Median number of rooms in houses and condos:
Here:
6.6
State:
7.3
Median number of rooms in apartments:
Here:
4.1
State:
4.2
Notable locations in this zip code not listed on our city pages
Notable locations in zip code 21875: Oakwood Sodding Farm (A), Wood Creek Golf Links (B), Town of Delmar Wastewater Treatment Plant (C), Delmar Police Department (D), Delmar Town Hall (E). Display/hide their locations on the map
Churches in zip code 21875 include: Delmar Wesleyans Church (A), Union United Methodist Church (B), Holy Redeemer Catholic Church (C), New Life Family Restoration Church (D). Display/hide their locations on the map
Streams, rivers, and creeks: Jackson Branch (A), Mayer Branch (B), Andrews Branch (C), Leonard Pond Run (D), Tilghman Branch (E), Wood Creek (F). Display/hide their locations on the map
In group quarters: 5 (-1 institutionalized population)
Size of family households: 911 2-persons, 498 3-persons, 492 4-persons, 144 5-persons, 29 6-persons, 32 7-or-more-persons
Size of nonfamily households: 899 1-person, 175 2-persons, 5 3-persons
832 married couples with children.
690 single-parent households (16 men, 674 women).
83.1% of residents of 21875 zip code speak English at home.
9.8% of residents speak Spanish at home (66% very well, 5% well, 19% not well, 9% not at all).
2.6% of residents speak other Indo-European language at home (90% very well, 10% well).
3.8% of residents speak Asian or Pacific Island language at home (79% very well, 5% well, 16% not well).
Foreign born population: 654 (8.8%) (42.3% of them are naturalized citizens)
This zip code:
8.8%
Whole state:
16.7%
28%Japan
24%Guatemala
23%Honduras
8%Bhutan
7%Dominica
6%Uruguay
5%Syria
14%American
12%English
5%German
5%European
4%Irish
2%Turkish
1%Russian
Year of entry for the foreign-born population
1312010 or later
1872000 to 2009
1141990 to 1999
225Before 1990
Facilities with environmental interests located in this zip code:
BROWNING FERRIS (9140 OCEAN HIGHWAY in DELMAR, MD)
AIR MINOR (AIRS/AFS) STATE MASTER (Maryland Permits tracking) - NPDES STORMWATER PERMIT, OIL CONTROL STATE MASTER (Maryland Air Emissions Database) - AIR MINOR Conditionally Exempt Small Quantity Generators, less than 100 kg/month of hazardous waste (Resource Conservation and Recovery Act (tracking hazardous waste)) - notification Business SIC classification: REFUSE SYSTEMS Organizations: B F I WASTE SYS (CONTACT/OWNER)
Alternative names: B F I WASTE SYS, BFI WASTE SYSTEMS - OCEAN HIGHWAY, BFI WASTE SYSTEMS OF NORTH AMERICA - DELMAR
AIR MINOR (AIRS/AFS) STATE MASTER (Maryland Air Emissions Database) - AIR MINOR Business SIC classification: GASOLINE SERVICE STATIONS Alternative names: CIGO - 403 BASTITE BOULEVARD
P & A ENGINEERING - ROUTE 13 (ROUTE 13 @ OAK HAVEN AVENUE in DELMAR, MD)
AIR MINOR (AIRS/AFS) STATE MASTER (Maryland Air Emissions Database) - AIR MINOR Business SIC classification: ASPHALT PAVING MIXTURES AND BLOCKS
7-11 STORE - 8640 0CEAN HIGHWAY (8640 OCEAN HIGHWAY in DELMAR, MD)
STATE MASTER (Maryland Air Emissions Database) - AIR MINOR Conditionally Exempt Small Quantity Generators, less than 100 kg/month of hazardous waste (Resource Conservation and Recovery Act (tracking hazardous waste)) - notification Business SIC classification: GROCERY STORES Organizations: THE SOUTHLAND CORPORATION (CONTACT/OWNER)
Alternative names: 7-ELEVEN #32676
BARR TRANSPORTATION CENTER (9367 OCEAN HIGHWAY in DELMAR, MD)
TRANSPORTER (Resource Conservation and Recovery Act (tracking hazardous waste)) - notification Business NAICS classification: ALL OTHER MOTOR VEHICLE DEALERS. Organizations: BARR INTERNATIONAL INC (CONTACT/OPERATOR)
, RICHARD S. BARR (CONTACT/OWNER)
, WICOMICO WHITE SALES CO (CONTACT/OWNER)
Alternative names: BARR FREIGHTLINER
PRINCESS ANNE FOODS (503 S MARYLAND AVE in DELMAR, MD)
AIR MINOR (AIRS/AFS) Business SIC classification: GENERAL CONTRACTORS-INDUSTRIAL BUILDINGS AND WAREHOUSES
Housing units lacking complete plumbing facilities: 0.5%
67.0%Electricity
19.8%Utility gas
7.7%Bottled, tank, or LP gas
4.4%Fuel oil, kerosene, etc.
0.8%Wood
Population in 1990: 3,712. Population change in the 1990s: +1,549 (+41.7%).
Place of birth for U.S.-born residents:
This state: 4,640
Northeast: 530
Midwest: 306
South: 1,187
West: 72
62% of the 21875 zip code residents lived in the same house 5 years ago. Out of people who lived in different houses, 53% lived in this county. Out of people who lived in different counties, 50% lived in Maryland.
93% of the 21875 zip code residents lived in the same house 1 year ago. Out of people who lived in different houses, 49% moved from this county. Out of people who lived in different houses, 43% moved from different county within same state. Out of people who lived in different houses, 12% moved from different state.
Private vs. public school enrollment:
Students in private schools in grades 1 to 8 (elementary and middle school): 83
Here:
13.5%
Maryland:
15.2%
Students in private schools in grades 9 to 12 (high school):
Here:
0.0%
Maryland:
14.4%
Students in private undergraduate colleges: 76
Here:
16.1%
Maryland:
20.2%
Occupation by median earnings in the past 12 months ($)
80,483Installation, maintenance, and repair occupations
73,134Health diagnosing and treating practitioners and other technical occupations
70,598Management occupations
67,580Transportation occupations
56,859Business and financial operations occupations
55,550Construction and extraction occupations
Top industries in this zip code by the number of employees in 2005:
Construction: Highway, Street, and Bridge Construction (50-99 employees: 1 establishment, 10-19 employees: 2 establishments)
Wholesale Trade: Automobile and Other Motor Vehicle Merchant Wholesalers (20-49: 1, 10-19: 1)
Finance and Insurance: Commercial Banking (20-49: 1)
Wholesale Trade: Farm and Garden Machinery and Equipment Merchant Wholesalers (20-49: 1)
Administrative and Support and Waste Management and Remediation Services: Solid Waste Collection (20-49: 1)
Construction: Glass and Glazing Contractors (20-49: 1)
People in group quarters in 2010:
4 people in group homes intended for adults
People in group quarters in 2000:
30 people in other group homes
Fatal accident statistics in 2014:
Fatal accident count: 3
Vehicles involved in fatal accidents: 5
Fatal accidents caused by drunken drivers: 2
Fatalities: 3
Persons involved in fatal accidents: 5
Pedestrians involved in fatal accidents: 0
Fatal accident statistics in 2013:
Fatal accident count: 1
Vehicles involved in fatal accidents: 2
Fatal accidents caused by drunken drivers: 1
Fatalities: 1
Persons involved in fatal accidents: 4
Pedestrians involved in fatal accidents: 0
Home Mortgage Disclosure Act Aggregated Statistics For Year 2009 (Based on 6 partial tracts)
A) FHA, FSA/RHS & VA Home Purchase Loans
B) Conventional Home Purchase Loans
C) Refinancings
D) Home Improvement Loans
F) Non-occupant Loans on < 5 Family Dwellings (A B C & D)
G) Loans On Manufactured Home Dwelling (A B C & D)
Number
Average Value
Number
Average Value
Number
Average Value
Number
Average Value
Number
Average Value
Number
Average Value
LOANS ORIGINATED
54
$164,027
40
$138,286
233
$156,657
17
$81,290
22
$127,664
10
$53,353
APPLICATIONS APPROVED, NOT ACCEPTED
3
$100,880
2
$115,930
21
$155,099
4
$46,288
2
$106,305
2
$45,600
APPLICATIONS DENIED
13
$162,993
9
$107,106
121
$159,332
19
$52,925
8
$98,215
5
$42,916
APPLICATIONS WITHDRAWN
1
$204,950
4
$157,502
61
$175,553
3
$30,080
4
$69,318
0
$0
FILES CLOSED FOR INCOMPLETENESS
2
$136,775
0
$0
10
$181,576
1
$244,320
0
$0
0
$0
Aggregated Statistics For Year 2008 (Based on 6 partial tracts)
A) FHA, FSA/RHS & VA Home Purchase Loans
B) Conventional Home Purchase Loans
C) Refinancings
D) Home Improvement Loans
E) Loans on Dwellings For 5+ Families
F) Non-occupant Loans on < 5 Family Dwellings (A B C & D)
G) Loans On Manufactured Home Dwelling (A B C & D)
Number
Average Value
Number
Average Value
Number
Average Value
Number
Average Value
Number
Average Value
Number
Average Value
Number
Average Value
LOANS ORIGINATED
40
$173,866
76
$146,907
187
$173,172
32
$67,631
1
$38,491,390
29
$182,717
10
$87,159
APPLICATIONS APPROVED, NOT ACCEPTED
0
$0
10
$98,532
32
$168,661
9
$37,597
0
$0
6
$130,678
7
$42,610
APPLICATIONS DENIED
9
$159,707
20
$94,545
174
$165,851
37
$66,048
0
$0
7
$124,560
17
$50,458
APPLICATIONS WITHDRAWN
4
$211,530
5
$195,212
67
$167,681
8
$123,632
0
$0
6
$90,005
2
$148,425
FILES CLOSED FOR INCOMPLETENESS
1
$146,750
4
$127,272
12
$160,090
0
$0
0
$0
0
$0
0
$0
Aggregated Statistics For Year 2007 (Based on 6 partial tracts)
A) FHA, FSA/RHS & VA Home Purchase Loans
B) Conventional Home Purchase Loans
C) Refinancings
D) Home Improvement Loans
E) Loans on Dwellings For 5+ Families
F) Non-occupant Loans on < 5 Family Dwellings (A B C & D)
G) Loans On Manufactured Home Dwelling (A B C & D)
Number
Average Value
Number
Average Value
Number
Average Value
Number
Average Value
Number
Average Value
Number
Average Value
Number
Average Value
LOANS ORIGINATED
22
$175,574
169
$147,406
255
$153,409
53
$89,296
1
$1,221,600
57
$146,802
22
$83,686
APPLICATIONS APPROVED, NOT ACCEPTED
2
$164,140
21
$123,709
47
$169,060
5
$92,294
0
$0
14
$119,905
7
$49,409
APPLICATIONS DENIED
1
$182,860
49
$128,229
204
$180,735
40
$93,540
0
$0
21
$142,238
21
$61,501
APPLICATIONS WITHDRAWN
1
$256,200
19
$175,616
124
$171,435
10
$122,969
0
$0
12
$185,000
1
$143,050
FILES CLOSED FOR INCOMPLETENESS
0
$0
3
$170,563
20
$183,866
7
$95,903
0
$0
3
$100,683
0
$0
Aggregated Statistics For Year 2006 (Based on 6 partial tracts)
A) FHA, FSA/RHS & VA Home Purchase Loans
B) Conventional Home Purchase Loans
C) Refinancings
D) Home Improvement Loans
F) Non-occupant Loans on < 5 Family Dwellings (A B C & D)
G) Loans On Manufactured Home Dwelling (A B C & D)
Number
Average Value
Number
Average Value
Number
Average Value
Number
Average Value
Number
Average Value
Number
Average Value
LOANS ORIGINATED
17
$197,621
259
$149,841
349
$135,716
65
$74,270
82
$153,527
23
$54,662
APPLICATIONS APPROVED, NOT ACCEPTED
1
$269,970
35
$108,559
48
$163,190
11
$45,698
9
$106,696
6
$50,092
APPLICATIONS DENIED
5
$131,582
51
$79,506
221
$154,617
40
$68,341
21
$173,312
36
$51,001
APPLICATIONS WITHDRAWN
1
$177,810
34
$142,394
184
$150,591
19
$124,294
8
$176,108
3
$70,680
FILES CLOSED FOR INCOMPLETENESS
2
$131,435
2
$124,500
33
$153,772
1
$33,390
1
$256,540
0
$0
Aggregated Statistics For Year 2005 (Based on 6 partial tracts)
A) FHA, FSA/RHS & VA Home Purchase Loans
B) Conventional Home Purchase Loans
C) Refinancings
D) Home Improvement Loans
F) Non-occupant Loans on < 5 Family Dwellings (A B C & D)
G) Loans On Manufactured Home Dwelling (A B C & D)
Number
Average Value
Number
Average Value
Number
Average Value
Number
Average Value
Number
Average Value
Number
Average Value
LOANS ORIGINATED
20
$162,257
266
$124,449
350
$126,541
42
$58,134
62
$114,171
15
$54,882
APPLICATIONS APPROVED, NOT ACCEPTED
1
$109,940
33
$100,392
60
$124,162
7
$28,674
9
$82,514
10
$68,031
APPLICATIONS DENIED
3
$201,473
65
$77,308
201
$122,570
45
$48,649
16
$104,859
44
$60,068
APPLICATIONS WITHDRAWN
3
$154,523
41
$115,050
208
$131,191
12
$153,174
14
$137,814
3
$115,843
FILES CLOSED FOR INCOMPLETENESS
1
$81,210
10
$111,312
24
$116,741
2
$174,690
4
$82,860
1
$55,560
Aggregated Statistics For Year 2004 (Based on 6 partial tracts)
A) FHA, FSA/RHS & VA Home Purchase Loans
B) Conventional Home Purchase Loans
C) Refinancings
D) Home Improvement Loans
E) Loans on Dwellings For 5+ Families
F) Non-occupant Loans on < 5 Family Dwellings (A B C & D)
G) Loans On Manufactured Home Dwelling (A B C & D)
2002 - 2018 National Fire Incident Reporting System (NFIRS) incidents
Based on the data from the years 2002 - 2018 the average number of fire incidents per year is 26. The highest number of fire incidents - 45 took place in 2008, and the least - 6 in 2013. The data has a declining trend.
When looking into fire subcategories, the most reports belonged to: Structure Fires (51.6%), and Outside Fires (35.1%).
Fire incident types reported to NFIRS in Zip Code 21875
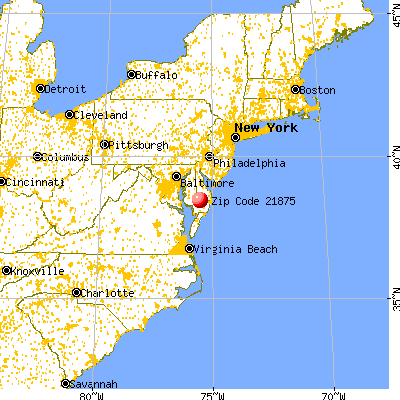


 Nearest zip codes: 19940, 21802, 21849, 19956, 21801, 21804.


 Based on the data from the years 2002 - 2018 the average number of fire incidents per year is 26. The highest number of fire incidents - 45 took place in 2008, and the least - 6 in 2013. The data has a declining trend.
 When looking into fire subcategories, the most reports belonged to: Structure Fires (51.6%), and Outside Fires (35.1%).