Estimated zip code population in 2022: 5,633 Zip code population in 2010: 4,420 Zip code population in 2000: 3,322
Houses and condos: 2,359 Renter-occupied apartments: 362
% of renters here:
17%
State:
26%
March 2022 cost of living index in zip code 19946: 91.5 (less than average, U.S. average is 100)
Land area: 22.1 sq. mi. Water area: 0.2 sq. mi.
Population density: 254 people per square mile
(very low).
OSM Map
General Map
Google Map
MSN Map
OSM Map
General Map
Google Map
MSN Map
OSM Map
General Map
Google Map
MSN Map
OSM Map
General Map
Google Map
MSN Map
Please wait while loading the map...
Real estate property taxes paid for housing units in 2022:
This zip code:
0.4% ($1,163)
Delaware:
0.5% ($1,635)
Median real estate property taxes paid for housing units with mortgages in 2022: $1,080 (0.4%) Median real estate property taxes paid for housing units with no mortgage in 2022: $1,256 (0.4%)
Estimated median house/condo value in 2022: $291,017
19946:
$291,017
Delaware:
$337,200
According to our research of Delaware and other state lists, there were 15 registered sex offenders living in 19946 zip code as of July 03, 2024. The ratio of all residents to sex offenders in zip code 19946 is 326 to 1. The ratio of registered sex offenders to all residents in this zip code is near the state average.
Median resident age:
This zip code:
48.8 years
Delaware median age:
41.5 years
Average household size:
This zip code:
2.6 people
Delaware:
2.5 people
Averages for the 2020 tax year for zip code 19946, filed in 2021:
Average Adjusted Gross Income (AGI) in 2020: $52,366 (Individual Income Tax Returns)
Here:
$52,366
State:
$74,239
Salary/wage: $44,515 (reported on 84.9% of returns)
Here:
$44,515
State:
$59,982
(% of AGI for various income ranges: 1126.3% for AGIs below $25k, 3585.6% for AGIs $25k-50k, 6428.8% for AGIs $50k-75k, 9395.6% for AGIs $75k-100k, 14095.9% for AGIs $100k-200k)
Taxable interest for individuals: $546 (reported on 20.2% of returns)
This zip code:
$546
Delaware:
$1,604
(% of AGI for various income ranges: 4.8% for AGIs below $25k, 7.4% for AGIs $25k-50k, 14.2% for AGIs $50k-75k, 28.7% for AGIs $75k-100k, 51.2% for AGIs $100k-200k)
Ordinary dividends: $2,248 (reported on 12.2% of returns)
Here:
$2,248
State:
$8,303
(% of AGI for various income ranges: 8.8% for AGIs below $25k, 21.4% for AGIs $25k-50k, 16.9% for AGIs $50k-75k, 89.4% for AGIs $75k-100k, 149.4% for AGIs $100k-200k)
Net capital gain/loss in AGI: +$3,873 (reported on 10.9% of returns)
Here:
+$3,873
State:
+$19,461
(% of AGI for various income ranges: 8.9% for AGIs $25k-50k, 44.2% for AGIs $50k-75k, 105.0% for AGIs $75k-100k, 400.6% for AGIs $100k-200k)
Profit/loss from business: +$10,289 (reported on 11.8% of returns)
Here:
+$10,289
State:
+$13,079
(% of AGI for various income ranges: 73.3% for AGIs below $25k, 65.4% for AGIs $25k-50k, 182.7% for AGIs $50k-75k, 134.4% for AGIs $75k-100k, 810.6% for AGIs $100k-200k)
Taxable individual retirement arrangement distribution: $14,629 (reported on 7.1% of returns)
19946:
$14,629
Delaware:
$22,095
(% of AGI for various income ranges: 30.5% for AGIs below $25k, 74.0% for AGIs $25k-50k, 77.7% for AGIs $50k-75k, 146.2% for AGIs $75k-100k, 850.6% for AGIs $100k-200k)
Total itemized deductions: $25,917 (reported on 5.0% of returns)
Here:
$25,917
State:
$30,452
(% of AGI for various income ranges: 113.7% for AGIs $25k-50k, 220.0% for AGIs $50k-75k, 298.8% for AGIs $75k-100k, 830.6% for AGIs $100k-200k)
Charity contributions: $5,200 (reported on 3.8% of returns)
Here:
$5,200
State:
$8,999
(% of AGI for various income ranges: 14.2% for AGIs below $25k, 55.0% for AGIs $50k-75k, 141.2% for AGIs $100k-200k)
Taxes paid: $5,975 (reported on 5.0% of returns)
19946:
$5,975
State:
$7,483
(% of AGI for various income ranges: 11.8% for AGIs $25k-50k, 43.1% for AGIs $50k-75k, 89.4% for AGIs $75k-100k, 232.4% for AGIs $100k-200k)
Earned income credit: $2,238 (reported on 19.7% of returns)
Here:
$2,238
State:
$2,247
(% of AGI for various income ranges: 95.5% for AGIs below $25k, 84.0% for AGIs $25k-50k)
Percentage of individuals using paid preparers for their 2020 taxes: 92.4%
Here:
92%
State:
92%
(% for various income ranges: 92.0% for AGIs below $25k, 93.2% for AGIs $25k-50k, 91.7% for AGIs $50k-75k, 91.3% for AGIs $75k-100k, 92.6% for AGIs $100k-200k, 100.0% for AGIs over 200k)
Averages for the 2012 tax year for zip code 19946, filed in 2013:
Average Adjusted Gross Income (AGI) in 2012: $46,012 (Individual Income Tax Returns)
Here:
$46,012
State:
$61,157
Salary/wage: $39,034 (reported on 85.1% of returns)
Here:
$39,034
State:
$50,642
(% of AGI for various income ranges: 74.9% for AGIs below $25k, 74.5% for AGIs $25k-50k, 77.0% for AGIs $50k-75k, 73.0% for AGIs $75k-100k, 66.5% for AGIs $100k-200k)
Taxable interest for individuals: $731 (reported on 26.3% of returns)
This zip code:
$731
Delaware:
$1,571
(% of AGI for various income ranges: 0.9% for AGIs below $25k, 0.4% for AGIs $25k-50k, 0.3% for AGIs $50k-75k, 0.5% for AGIs $75k-100k, 0.3% for AGIs $100k-200k)
Ordinary dividends: $2,239 (reported on 14.4% of returns)
Here:
$2,239
State:
$6,610
(% of AGI for various income ranges: 0.8% for AGIs below $25k, 0.5% for AGIs $25k-50k, 0.1% for AGIs $50k-75k, 1.3% for AGIs $75k-100k, 0.8% for AGIs $100k-200k)
Net capital gain/loss in AGI: +$3,750 (reported on 8.2% of returns)
Here:
+$3,750
State:
+$11,439
(% of AGI for various income ranges: 0.6% for AGIs $75k-100k, 1.9% for AGIs $100k-200k)
Profit/loss from business: +$8,509 (reported on 11.3% of returns)
Here:
+$8,509
State:
+$12,773
(% of AGI for various income ranges: 4.1% for AGIs below $25k, 2.3% for AGIs $25k-50k, 0.9% for AGIs $50k-75k, 2.7% for AGIs $75k-100k, 1.6% for AGIs $100k-200k)
Taxable individual retirement arrangement distribution: $13,573 (reported on 7.7% of returns)
19946:
$13,573
Delaware:
$16,790
(% of AGI for various income ranges: 1.4% for AGIs below $25k, 3.4% for AGIs $25k-50k, 2.1% for AGIs $75k-100k, 3.3% for AGIs $100k-200k)
Total itemized deductions: $19,698 (23% of AGI, reported on 25.8% of returns)
Here:
$19,698
State:
$23,216
Here:
22.8% of AGI
State:
19.8% of AGI
(% of AGI for various income ranges: 4.9% for AGIs below $25k, 9.2% for AGIs $25k-50k, 10.8% for AGIs $50k-75k, 12.9% for AGIs $75k-100k, 13.6% for AGIs $100k-200k)
Charity contributions: $3,087 (reported on 19.6% of returns)
Here:
$3,087
State:
$3,791
(% of AGI for various income ranges: 0.8% for AGIs below $25k, 1.0% for AGIs $25k-50k, 1.2% for AGIs $50k-75k, 1.9% for AGIs $75k-100k, 1.4% for AGIs $100k-200k)
Taxes paid: $4,684 (reported on 25.8% of returns)
19946:
$4,684
State:
$8,129
(% of AGI for various income ranges: 0.5% for AGIs below $25k, 1.5% for AGIs $25k-50k, 2.2% for AGIs $50k-75k, 3.2% for AGIs $75k-100k, 4.1% for AGIs $100k-200k)
Earned income credit: $2,318 (reported on 22.7% of returns)
Here:
$2,318
State:
$2,231
(% of AGI for various income ranges: 7.6% for AGIs below $25k, 1.2% for AGIs $25k-50k)
Percentage of individuals using paid preparers for their 2012 taxes: 44.8%
Here:
45%
State:
47%
(% for various income ranges: 37.5% for AGIs below $25k, 45.1% for AGIs $25k-50k, 50.0% for AGIs $50k-75k, 52.9% for AGIs $75k-100k, 60.0% for AGIs $100k-200k)
Averages for the 2004 tax year for zip code 19946, filed in 2005:
Average Adjusted Gross Income (AGI) in 2004: $38,382 (Individual Income Tax Returns)
Here:
$38,382
State:
$54,038
Salary/wage: $32,421 (reported on 87.1% of returns)
Here:
$32,421
State:
$44,625
(% of AGI for various income ranges: 98.5% for AGIs below $10k, 80.1% for AGIs $10k-25k, 82.3% for AGIs $25k-50k, 79.8% for AGIs $50k-75k, 79.7% for AGIs $75k-100k, 49.6% for AGIs over 100k)
Taxable interest for individuals: $914 (reported on 34.0% of returns)
This zip code:
$914
Delaware:
$1,734
(% of AGI for various income ranges: 2.9% for AGIs below $10k, 1.6% for AGIs $10k-25k, 0.7% for AGIs $25k-50k, 0.7% for AGIs $50k-75k, 0.5% for AGIs $75k-100k, 0.6% for AGIs over 100k)
Taxable dividends: $1,580 (reported on 15.6% of returns)
Here:
$1,580
State:
$5,362
(% of AGI for various income ranges: 1.1% for AGIs below $10k, 0.3% for AGIs $10k-25k, 0.3% for AGIs $25k-50k, 0.7% for AGIs $50k-75k, 0.5% for AGIs $75k-100k, 1.2% for AGIs over 100k)
Net capital gain/loss: +$9,278 (reported on 11.1% of returns)
Here:
+$9,278
State:
+$17,328
(% of AGI for various income ranges: -1.7% for AGIs below $10k, 0.3% for AGIs $10k-25k, -0.0% for AGIs $25k-50k, 0.1% for AGIs $50k-75k, 0.2% for AGIs $75k-100k, 10.8% for AGIs over 100k)
Profit/loss from business: +$7,851 (reported on 10.0% of returns)
Here:
+$7,851
State:
+$12,191
(% of AGI for various income ranges: -4.0% for AGIs below $10k, 1.6% for AGIs $10k-25k, 2.1% for AGIs $25k-50k, 3.8% for AGIs $50k-75k, 0.2% for AGIs $75k-100k, 2.5% for AGIs over 100k)
IRA payment deduction: $2,706 (reported on 1.0% of returns)
19946:
$2,706
Delaware:
$3,027
Total itemized deductions: $14,894 (19% of AGI, reported on 21.5% of returns)
Here:
$14,894
State:
$19,441
Here:
18.9% of AGI
State:
19.3% of AGI
(% of AGI for various income ranges: 5.2% for AGIs $10k-25k, 7.2% for AGIs $25k-50k, 11.7% for AGIs $50k-75k, 9.6% for AGIs $75k-100k, 8.7% for AGIs over 100k)
Charity contributions deductions: $2,538 (3% of AGI, reported on 18.0% of returns)
Here:
$2,538
State:
$3,727
Here:
3.0% of AGI
State:
3.5% of AGI
(% of AGI for various income ranges: 0.4% for AGIs $10k-25k, 1.4% for AGIs $25k-50k, 1.7% for AGIs $50k-75k, 1.1% for AGIs $75k-100k, 1.2% for AGIs over 100k)
Total tax: $4,745 (reported on 71.3% of returns)
19946:
$4,745
State:
$8,958
(% of AGI for various income ranges: 1.5% for AGIs below $10k, 3.5% for AGIs $10k-25k, 7.1% for AGIs $25k-50k, 9.2% for AGIs $50k-75k, 10.4% for AGIs $75k-100k, 13.0% for AGIs over 100k)
Earned income credit: $1,734 (reported on 20.2% of returns)
Here:
$1,734
State:
$1,733
Percentage of individuals using paid preparers for their 2004 taxes: 56.0%
Here:
56%
State:
55%
(% for various income ranges: 44.8% for AGIs below $10k, 59.8% for AGIs $10k-25k, 52.9% for AGIs $25k-50k, 62.8% for AGIs $50k-75k, 61.8% for AGIs $75k-100k, 72.1% for AGIs over 100k)
Likely homosexual households (counted as self-reported same-sex unmarried-partner households)
Lesbian couples: 0.3% of all households
Gay men: 0.0% of all households
Household received Food Stamps/SNAP in the past 12 months: 408 Household did not receive Food Stamps/SNAP in the past 12 months: 1,730
Women who had a birth in the past 12 months: 6 (6 now married, 0 unmarried) Women who did not have a birth in the past 12 months: 1,288 (521 now married, 767 unmarried)
Housing units in zip code 19946 with a mortgage: 999 (113 second mortgage, 47 both second mortgage and home equity loan) Houses without a mortgage: 67
Median monthly owner costs for units with a mortgage: $1,590 Median monthly owner costs for units without a mortgage: $521
Residents with income below the poverty level in 2022:
This zip code:
11.8%
Whole state:
9.4%
Residents with income below 50% of the poverty level in 2022:
This zip code:
2.6%
Whole state:
4.6%
Median number of rooms in houses and condos:
Here:
6.2
State:
6.9
Median number of rooms in apartments:
Here:
5.4
State:
4.4
Notable locations in this zip code not listed on our city pages
Notable locations in zip code 19946: Bowers Fire Company Incorporated (A), Frederica Police Department (B), Bowers Beach Maritime Museum (C), Frederica City Hall (D), Bowers Beach Town Hall (E), Frederica Volunteer Fire Company (F). Display/hide their locations on the map
Churches in zip code 19946 include: Barratts Chapel (A), Mount Olive Church (B), Saxton United Methodist Church (C), Saint James American Methodist Episcopal Church (D), Hubert American Methodist Episcopal Church (E), The Way of Truth Church (F), Trinity United Methodist Church (G). Display/hide their locations on the map
Streams, rivers, and creeks: Double Run (A), Hudson Branch (B), Ash Gut (C), Spring Creek (D), Pratt Branch (E), Murderkill River (F). Display/hide their locations on the map
Parks in zip code 19946 include: Burton - Derrickson Tract of Murderkill River Nature Preserve (1), Milford Neck Wildlife Area (2). Display/hide their locations on the map
Size of family households: 804 2-persons, 370 3-persons, 301 4-persons, 72 5-persons, 107 6-persons, 44 7-or-more-persons
Size of nonfamily households: 341 1-person, 86 2-persons, 3 3-persons
451 married couples with children.
634 single-parent households (46 men, 588 women).
99.3% of residents of 19946 zip code speak English at home.
0.8% of residents speak Spanish at home (86% very well, 14% well).
0.1% of residents speak other Indo-European language at home (17% very well, 50% well, 33% not well).
Foreign born population: 134 (2.4%) (91.3% of them are naturalized citizens)
This zip code:
2.4%
Whole state:
9.9%
20%Sweden
20%United Kingdom, excluding England and Scotland
17%Denmark
16%Malaysia
9%Nicaragua
2%Italy
2%Portugal
25%American
10%English
7%Irish
7%German
4%Italian
3%European
1%French Canadian
Year of entry for the foreign-born population
392010 or later
372000 to 2009
411990 to 1999
67Before 1990
Facilities with environmental interests located in this zip code:
ILC DOVER INCORPORATED (ONE MOONWALKER ROAD in FREDERICA, DE)
AIR SYNTHETIC MINOR (AIRS/AFS) (Integrated Compliance Information System) - ICIS-03-1991-0171, FORMAL ENFORCEMENT ACTION COMPLIANCE ACTIVITY (Tracking inspections of insecticide, fungicide, and rodenticide, and toxic substances) CRITERIA AND HAZARDOUS AIR POLLUTANT INVENTORY (Inventory of air pollution sources) Small Quantity Generators, between 100 kg and 1000 kg of hazardous waste/month (Resource Conservation and Recovery Act (tracking hazardous waste)) - notification TRI REPORTER (Tracking of toxic chemicals releasing facilities) Business SIC classification: ORTHOPEDIC, PROSTHETIC, AND SURGICAL APPLIANCES AND SUPPLIES; MANUFACTURING INDUSTRIES Organizations: OPERNAME (CONTACT/OPERATOR)
, ILC INDUSTRIES INC (CONTACT/OWNER)
Alternative names: I L C - DOVER INC
KENT COUNTY LEVY COURT-WWTR TR (COUNTY ROAD 120 in FREDERICA, DE)
CRITERIA AND HAZARDOUS AIR POLLUTANT INVENTORY (Inventory of air pollution sources) National Pollutant Discharge Elimination System MAJOR (Tracking pollutant discharge elimination systems) - permit - ICIS-, ENFORCEMENT/COMPLIANCE ACTIVITY National Pollutant Discharge Elimination System NON-MAJOR (Tracking pollutant discharge elimination systems) - permit National Pollutant Discharge Elimination System NON-MAJOR (Tracking pollutant discharge elimination systems) - permit Business SIC classification: SEWERAGE SYSTEMS; REFUSE SYSTEMS Alternative names: KENT COUNTY SEWAGE TREATMENT PLANT, LEVY COURT OF KENT COUNTY
LAKE FOREST EAST ELEMENTARY SCHOOL (124 WEST FRONT STREET in FREDERICA, DE)
(Geographic Names Information System) (National Center for Education Statistics) - STATE ID-658 Organizations: LAKE FOREST SCHOOL DISTRICT (SCHOOL DISTRICT)
LITTON SYSYEMS INC-CLIFTON PRECISION DIV (RTE 113 in FREDERICA, DE)
Conditionally Exempt Small Quantity Generators, less than 100 kg/month of hazardous waste (Resource Conservation and Recovery Act (tracking hazardous waste)) - notification Organizations: OPERNAME (CONTACT/OPERATOR)
, LITTON SYSTEMS INC (CONTACT/OWNER)
Housing units lacking complete plumbing facilities: 4.3% Housing units lacking complete kitchen facilities: 1.2%
30.1%Fuel oil, kerosene, etc.
27.1%Bottled, tank, or LP gas
25.7%Electricity
11.2%Utility gas
3.4%Other fuel
1.8%Wood
0.6%No fuel used
Population in 1990: 2,725. Population change in the 1990s: +597 (+21.9%).
Place of birth for U.S.-born residents:
This state: 2,928
Northeast: 1,429
Midwest: 150
South: 831
West: 70
60% of the 19946 zip code residents lived in the same house 5 years ago. Out of people who lived in different houses, 55% lived in this county. Out of people who lived in different counties, 50% lived in Delaware.
96% of the 19946 zip code residents lived in the same house 1 year ago. Out of people who lived in different houses, 32% moved from this county. Out of people who lived in different houses, 22% moved from different county within same state. Out of people who lived in different houses, 36% moved from different state. Out of people who lived in different houses, 1% moved from abroad.
Private vs. public school enrollment:
Students in private schools in grades 1 to 8 (elementary and middle school): 50
Here:
7.3%
Delaware:
11.5%
Students in private schools in grades 9 to 12 (high school): 31
Here:
9.0%
Delaware:
12.1%
Students in private undergraduate colleges: 1
Here:
1.1%
Delaware:
19.2%
Occupation by median earnings in the past 12 months ($)
249,984Farming, fishing, and forestry occupations
95,593Health technologists and technicians
95,208Legal occupations
79,397Management occupations
73,263Computer and mathematical occupations
66,195Health diagnosing and treating practitioners and other technical occupations
Companies with federal contracts located in this zip code (FREDERICA, DE):
ILC DOVER INC (ONE MOONWALKER ROAD) : $93,858,090 in 171 contractsfrom 1999 to 2006
Contracts for Safety and Rescue Equipment, Aeronautics and Space Technology -- Basic Research (R&D), Other Professional Services, Marine Lifesaving and Diving Equipment, and moreby Army, NASA, Defense Logistics Agency, Navy, and others Signed by year:2000: $3,254,463; 2001: $18,307,815; 2002: $10,700,319; 2003: $3,980,039; 2004: $7,745,100; 2005: $30,431,084; 2006: $11,834,785.
Biggest contracts:
$10,244,639 with Army for Safety and Rescue Equipment. Signed on 2001-09-25. Completion date: 2006-12-31.
$6,469,243, same as above.Signed on 1999-12-21. Completion date: 2001-04-30.
$6,004,200, same as above.Signed on 2006-02-22. Completion date: 2007-12-31.
$5,435,524, same as above.Signed on 2005-07-05. Completion date: 2006-12-31.
ILC MANUFACTURED PRODUCTS DIVI (TWO MOONWALKER ROAD) : $30,128,401 in 40 contractsfrom 2002 to 2006
Contracts for Safety and Rescue Equipment, Hose, Pipe, Tube, Lubrication, and Railing Fittings, Hose and Flexible Tubing, Marine Hardware and Hull Items, and moreby Army, Navy, Defense Logistics Agency, Air Force, and others Signed by year:2000: $0; 2001: $0; 2002: $26,080; 2003: $8,612,136; 2004: $20,524,792; 2005: $461,067; 2006: $504,326.
Biggest contracts:
$6,127,360 with Army for Safety and Rescue Equipment. Signed on 2004-06-28. Completion date: 2006-12-31.
$4,233,104, same as above.Signed on 2003-08-04. Completion date: 2006-12-31.
$3,456,000 with Army for Hose, Pipe, Tube, Lubrication, and Railing Fittings. Signed on 2004-07-07. Completion date: 2004-12-08.
$3,162,000 with Army for Safety and Rescue Equipment. Signed on 2003-11-25. Completion date: 2006-12-31.
ROBERTS CONST CO (112 E FRONT STREET; small business) : $3,725,808 in 31 contractsfrom 1999 to 2004
Contracts for Maintenance, Repair or Alteration of Real Property -- Maintenance Buildings, Maintenance, Repair or Alteration of Real Property -- Other Administrative Facilities and Service Buildings, Maintenance, Repair or Alteration of Real Property -- Family Housing Facilities, Tents and Tarpaulins, and moreby Air Force Signed by year:2000: $524,052; 2001: $2,653,734; 2002: $223,101; 2003: $221,532; 2004: $25,860; 2005: $0; 2006: $0.
Biggest contracts:
$2,591,604 with Air Force for Maintenance, Repair or Alteration of Real Property -- Maintenance Buildings. Signed on 2001-11-08. Completion date: 2002-11-28.
$405,641 with Air Force for Maintenance, Repair or Alteration of Real Property -- Other Administrative Facilities and Service Buildings. Signed on 2000-07-07. Completion date: 2000-08-07.
$83,134 with Air Force for Maintenance, Repair or Alteration of Real Property -- Maintenance Buildings. Signed on 2000-09-29. Completion date: 2000-11-04.
$76,929 with Air Force for Maintenance, Repair or Alteration of Real Property -- Family Housing Facilities. Signed on 1999-11-02. Completion date: 2000-04-27.
ILC INDUSTRIES INC (P.O. BOX 266) : $1,125,604 in 5 contractsfrom 2001 to 2004
Contracts for Safety and Rescue Equipment, Headsets, Handsets, Microphones and Speakers by Air Force, Defense Logistics Agency Signed by year:2000: $0; 2001: $974,509; 2002: $0; 2003: $0; 2004: $151,095; 2005: $0; 2006: $0.
Biggest contracts:
$974,509 with Air Force for Safety and Rescue Equipment. Signed on 2001-09-30. Completion date: 2002-05-31.
$100,681 with Defense Logistics Agency for Headsets, Handsets, Microphones and Speakers. Signed on 2004-01-06. Completion date: 2004-10-01.
$50,414, same as above.Signed on 2004-12-20. Completion date: 2005-02-18.
$0, same as above.Signed on 2004-07-14. Completion date: 2005-07-14.
DEBORAH J SELLARS (3260 BARRATTS CHAPEL RD; small business) : $169,500 in 5 contractsfrom 2001 to 2005
Contracts for Other Social Services, Other Natural Resources and Conservation Services by Air Force Signed by year:2000: $0; 2001: $30,000; 2002: $34,500; 2003: $35,000; 2004: $35,000; 2005: $35,000; 2006: $0.
Biggest contracts:
$35,000 with Air Force for Other Social Services. Signed on 2005-10-01. Completion date: 2006-09-30.
$35,000 with Air Force for Other Natural Resources and Conservation Services. Signed on 2004-10-01. Completion date: 2005-09-30.
$35,000, same as above.Signed on 2003-04-01. Completion date: 2003-04-04.
$34,500, same as above.Signed on 2002-04-01. Completion date: 2003-04-04.
Top industries in this zip code by the number of employees in 2005:
Construction: Drywall and Insulation Contractors (10-19 employees: 1 establishment)
Accommodation and Food Services: Limited-Service Restaurants (10-19: 1)
Construction: Commercial and Institutional Building Construction (10-19: 1)
Real Estate and Rental and Leasing: Construction, Mining, and Forestry Machinery and Equipment Rental and Leasing (10-19: 1)
Construction: Electrical Contractors (5-9: 1)
Construction: Poured Concrete Foundation and Structure Contractors (5-9: 1)
Fatal accident statistics in 2014:
Fatal accident count: 2
Vehicles involved in fatal accidents: 3
Fatal accidents caused by drunken drivers: 1
Fatalities: 3
Persons involved in fatal accidents: 5
Pedestrians involved in fatal accidents: 2
Fatal accident statistics in 2013:
Fatal accident count: 1
Vehicles involved in fatal accidents: 2
Fatal accidents caused by drunken drivers: 0
Fatalities: 1
Persons involved in fatal accidents: 2
Pedestrians involved in fatal accidents: 0
Home Mortgage Disclosure Act Aggregated Statistics For Year 2009 (Based on 6 partial tracts)
A) FHA, FSA/RHS & VA Home Purchase Loans
B) Conventional Home Purchase Loans
C) Refinancings
D) Home Improvement Loans
F) Non-occupant Loans on < 5 Family Dwellings (A B C & D)
G) Loans On Manufactured Home Dwelling (A B C & D)
Number
Average Value
Number
Average Value
Number
Average Value
Number
Average Value
Number
Average Value
Number
Average Value
LOANS ORIGINATED
30
$208,804
30
$162,362
183
$191,929
10
$74,755
15
$188,275
10
$80,201
APPLICATIONS APPROVED, NOT ACCEPTED
4
$220,890
2
$98,800
18
$201,745
2
$120,725
1
$236,990
3
$79,427
APPLICATIONS DENIED
9
$201,719
9
$106,111
77
$194,189
13
$78,578
7
$171,174
15
$72,531
APPLICATIONS WITHDRAWN
4
$172,415
1
$246,970
51
$197,867
3
$140,863
4
$245,758
2
$157,115
FILES CLOSED FOR INCOMPLETENESS
0
$0
0
$0
16
$175,362
1
$35,740
1
$129,180
5
$117,636
Aggregated Statistics For Year 2008 (Based on 6 partial tracts)
A) FHA, FSA/RHS & VA Home Purchase Loans
B) Conventional Home Purchase Loans
C) Refinancings
D) Home Improvement Loans
F) Non-occupant Loans on < 5 Family Dwellings (A B C & D)
G) Loans On Manufactured Home Dwelling (A B C & D)
Number
Average Value
Number
Average Value
Number
Average Value
Number
Average Value
Number
Average Value
Number
Average Value
LOANS ORIGINATED
28
$201,918
39
$191,816
109
$178,467
22
$59,366
10
$151,253
19
$103,376
APPLICATIONS APPROVED, NOT ACCEPTED
1
$138,270
9
$156,987
23
$124,963
6
$51,947
2
$83,095
6
$80,133
APPLICATIONS DENIED
6
$154,243
14
$99,456
100
$189,641
35
$48,767
5
$108,796
23
$78,924
APPLICATIONS WITHDRAWN
1
$308,250
5
$139,050
42
$202,562
5
$190,412
3
$182,187
1
$133,520
FILES CLOSED FOR INCOMPLETENESS
0
$0
0
$0
9
$252,249
1
$12,370
1
$271,100
0
$0
Aggregated Statistics For Year 2007 (Based on 6 partial tracts)
A) FHA, FSA/RHS & VA Home Purchase Loans
B) Conventional Home Purchase Loans
C) Refinancings
D) Home Improvement Loans
F) Non-occupant Loans on < 5 Family Dwellings (A B C & D)
G) Loans On Manufactured Home Dwelling (A B C & D)
Number
Average Value
Number
Average Value
Number
Average Value
Number
Average Value
Number
Average Value
Number
Average Value
LOANS ORIGINATED
20
$221,524
101
$169,686
131
$170,678
55
$62,314
21
$162,976
32
$88,991
APPLICATIONS APPROVED, NOT ACCEPTED
0
$0
16
$120,966
36
$150,545
9
$63,672
4
$144,075
10
$92,317
APPLICATIONS DENIED
2
$227,645
33
$112,990
134
$186,136
47
$74,346
11
$96,799
29
$82,308
APPLICATIONS WITHDRAWN
1
$327,580
18
$194,685
65
$179,971
11
$105,021
4
$259,460
6
$106,688
FILES CLOSED FOR INCOMPLETENESS
0
$0
2
$229,560
27
$197,033
1
$76,980
2
$128,700
1
$71,200
Aggregated Statistics For Year 2006 (Based on 6 partial tracts)
A) FHA, FSA/RHS & VA Home Purchase Loans
B) Conventional Home Purchase Loans
C) Refinancings
D) Home Improvement Loans
F) Non-occupant Loans on < 5 Family Dwellings (A B C & D)
G) Loans On Manufactured Home Dwelling (A B C & D)
Number
Average Value
Number
Average Value
Number
Average Value
Number
Average Value
Number
Average Value
Number
Average Value
LOANS ORIGINATED
35
$223,467
151
$164,419
151
$151,841
58
$56,939
26
$182,278
32
$78,394
APPLICATIONS APPROVED, NOT ACCEPTED
1
$33,570
18
$173,043
30
$140,541
7
$81,129
2
$227,090
5
$73,704
APPLICATIONS DENIED
3
$179,160
46
$120,998
126
$158,121
53
$58,862
14
$104,449
30
$64,173
APPLICATIONS WITHDRAWN
0
$0
17
$163,201
85
$163,019
12
$99,962
3
$165,023
5
$103,922
FILES CLOSED FOR INCOMPLETENESS
2
$148,520
2
$210,315
24
$179,403
1
$73,310
0
$0
0
$0
Aggregated Statistics For Year 2005 (Based on 6 partial tracts)
A) FHA, FSA/RHS & VA Home Purchase Loans
B) Conventional Home Purchase Loans
C) Refinancings
D) Home Improvement Loans
F) Non-occupant Loans on < 5 Family Dwellings (A B C & D)
G) Loans On Manufactured Home Dwelling (A B C & D)
Number
Average Value
Number
Average Value
Number
Average Value
Number
Average Value
Number
Average Value
Number
Average Value
LOANS ORIGINATED
28
$185,672
177
$153,657
174
$141,625
46
$68,402
35
$142,323
27
$68,716
APPLICATIONS APPROVED, NOT ACCEPTED
1
$224,700
28
$145,235
27
$121,127
8
$69,196
5
$119,784
9
$61,354
APPLICATIONS DENIED
2
$122,890
51
$90,869
127
$129,071
41
$47,694
8
$85,071
47
$55,398
APPLICATIONS WITHDRAWN
1
$76,800
15
$161,107
78
$140,788
17
$113,020
3
$172,353
2
$100,875
FILES CLOSED FOR INCOMPLETENESS
0
$0
8
$135,596
46
$149,715
2
$35,250
1
$47,810
1
$30,280
Aggregated Statistics For Year 2004 (Based on 6 partial tracts)
A) FHA, FSA/RHS & VA Home Purchase Loans
B) Conventional Home Purchase Loans
C) Refinancings
D) Home Improvement Loans
E) Loans on Dwellings For 5+ Families
F) Non-occupant Loans on < 5 Family Dwellings (A B C & D)
G) Loans On Manufactured Home Dwelling (A B C & D)
Number
Average Value
Number
Average Value
Number
Average Value
Number
Average Value
Number
Average Value
Number
Average Value
Number
Average Value
LOANS ORIGINATED
28
$165,125
132
$142,466
169
$124,057
36
$44,973
1
$189,240
24
$133,005
17
$68,921
APPLICATIONS APPROVED, NOT ACCEPTED
2
$156,160
18
$127,291
35
$110,701
8
$33,481
0
$0
4
$55,000
4
$65,220
APPLICATIONS DENIED
3
$164,393
25
$83,618
128
$116,287
38
$33,292
0
$0
7
$60,781
27
$58,264
APPLICATIONS WITHDRAWN
2
$130,815
8
$148,389
59
$124,065
10
$36,896
0
$0
2
$150,290
2
$141,470
FILES CLOSED FOR INCOMPLETENESS
0
$0
6
$116,707
38
$150,610
2
$35,970
0
$0
1
$75,490
0
$0
Aggregated Statistics For Year 2003 (Based on 6 partial tracts)
A) FHA, FSA/RHS & VA Home Purchase Loans
B) Conventional Home Purchase Loans
C) Refinancings
D) Home Improvement Loans
F) Non-occupant Loans on < 5 Family Dwellings (A B C & D)
Number
Average Value
Number
Average Value
Number
Average Value
Number
Average Value
Number
Average Value
LOANS ORIGINATED
36
$166,177
79
$127,450
254
$123,847
24
$31,498
16
$108,524
APPLICATIONS APPROVED, NOT ACCEPTED
2
$197,960
10
$120,859
44
$119,620
2
$13,060
3
$77,047
APPLICATIONS DENIED
2
$124,805
20
$68,642
119
$114,861
19
$31,443
5
$73,536
APPLICATIONS WITHDRAWN
2
$196,930
7
$85,747
54
$115,796
4
$51,525
5
$75,932
FILES CLOSED FOR INCOMPLETENESS
0
$0
4
$169,042
11
$120,341
3
$85,180
1
$156,650
Aggregated Statistics For Year 2002 (Based on 4 partial tracts)
A) FHA, FSA/RHS & VA Home Purchase Loans
B) Conventional Home Purchase Loans
C) Refinancings
D) Home Improvement Loans
F) Non-occupant Loans on < 5 Family Dwellings (A B C & D)
Number
Average Value
Number
Average Value
Number
Average Value
Number
Average Value
Number
Average Value
LOANS ORIGINATED
8
$131,132
30
$111,901
48
$113,011
13
$23,414
6
$139,222
APPLICATIONS APPROVED, NOT ACCEPTED
0
$0
3
$120,817
16
$136,944
0
$0
1
$72,730
APPLICATIONS DENIED
1
$94,090
9
$50,592
41
$95,150
3
$28,217
2
$36,365
APPLICATIONS WITHDRAWN
1
$53,400
1
$389,080
14
$103,721
0
$0
0
$0
FILES CLOSED FOR INCOMPLETENESS
0
$0
2
$58,665
2
$98,475
0
$0
0
$0
Aggregated Statistics For Year 2001 (Based on 4 partial tracts)
A) FHA, FSA/RHS & VA Home Purchase Loans
B) Conventional Home Purchase Loans
C) Refinancings
D) Home Improvement Loans
F) Non-occupant Loans on < 5 Family Dwellings (A B C & D)
Number
Average Value
Number
Average Value
Number
Average Value
Number
Average Value
Number
Average Value
LOANS ORIGINATED
9
$125,059
13
$91,117
43
$76,460
7
$21,857
7
$69,714
APPLICATIONS APPROVED, NOT ACCEPTED
0
$0
2
$110,620
7
$56,653
3
$23,737
1
$81,380
APPLICATIONS DENIED
0
$0
9
$45,368
31
$60,312
6
$17,913
1
$44,180
APPLICATIONS WITHDRAWN
1
$33,120
1
$62,560
19
$73,345
2
$27,915
1
$75,270
FILES CLOSED FOR INCOMPLETENESS
0
$0
0
$0
1
$14,550
0
$0
0
$0
Aggregated Statistics For Year 2000 (Based on 4 partial tracts)
A) FHA, FSA/RHS & VA Home Purchase Loans
B) Conventional Home Purchase Loans
C) Refinancings
D) Home Improvement Loans
F) Non-occupant Loans on < 5 Family Dwellings (A B C & D)
Number
Average Value
Number
Average Value
Number
Average Value
Number
Average Value
Number
Average Value
LOANS ORIGINATED
5
$114,584
16
$74,482
20
$71,440
4
$18,820
6
$50,253
APPLICATIONS APPROVED, NOT ACCEPTED
1
$86,460
3
$88,120
11
$71,820
2
$54,805
1
$20,340
APPLICATIONS DENIED
1
$56,960
14
$47,367
18
$73,021
4
$13,755
1
$46,710
APPLICATIONS WITHDRAWN
1
$133,380
2
$55,460
6
$66,342
0
$0
1
$38,140
FILES CLOSED FOR INCOMPLETENESS
0
$0
0
$0
5
$53,964
1
$8,650
0
$0
Aggregated Statistics For Year 1999 (Based on 3 partial tracts)
A) FHA, FSA/RHS & VA Home Purchase Loans
B) Conventional Home Purchase Loans
C) Refinancings
D) Home Improvement Loans
F) Non-occupant Loans on < 5 Family Dwellings (A B C & D)
2002 - 2018 National Fire Incident Reporting System (NFIRS) incidents
According to the data from the years 2002 - 2018 the average number of fires per year is 20. The highest number of fire incidents - 37 took place in 2004, and the least - 9 in 2016. The data has a decreasing trend.
When looking into fire subcategories, the most incidents belonged to: Structure Fires (48.4%), and Outside Fires (26.8%).
Fire incident types reported to NFIRS in Zip Code 19946

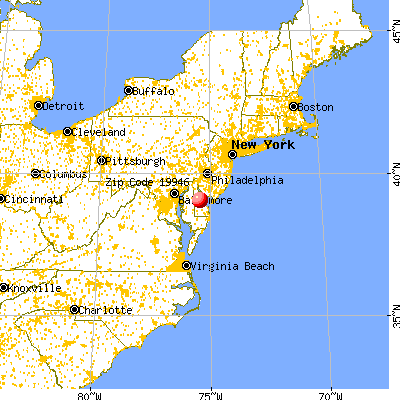


 Nearest zip codes: 19962, 19902, 19979, 19963, 19901, 19954.


 According to the data from the years 2002 - 2018 the average number of fires per year is 20. The highest number of fire incidents - 37 took place in 2004, and the least - 9 in 2016. The data has a decreasing trend.
 When looking into fire subcategories, the most incidents belonged to: Structure Fires (48.4%), and Outside Fires (26.8%).