Estimated zip code population in 2022: 5,152 Zip code population in 2010: 4,700 Zip code population in 2000: 4,724
Houses and condos: 2,134 Renter-occupied apartments: 425
% of renters here:
20%
State:
31%
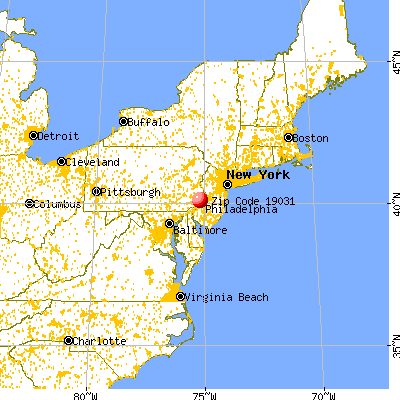
March 2022 cost of living index in zip code 19031: 104.3 (near average, U.S. average is 100)
Land area: 2.9 sq. mi. Water area: 0.0 sq. mi.
Population density: 1,793 people per square mile
(low).
OSM Map
General Map
Google Map
MSN Map
OSM Map
General Map
Google Map
MSN Map
OSM Map
General Map
Google Map
MSN Map
OSM Map
General Map
Google Map
MSN Map
Please wait while loading the map...
Real estate property taxes paid for housing units in 2022:
This zip code:
1.2% ($6,476)
Pennsylvania:
1.3% ($3,094)
Median real estate property taxes paid for housing units with mortgages in 2022: $6,461 (1.2%) Median real estate property taxes paid for housing units with no mortgage in 2022: $6,505 (1.2%)
Business Search- 14 Million verified businesses
Males: 2,316
(45.0%)
Females: 2,836
(55.0%)
For population 25 years and over in 19031:
High school or higher: 98.8%
Bachelor's degree or higher: 65.8%
Graduate or professional degree: 33.1%
Unemployed: 3.0%
Mean travel time to work (commute): 26.9 minutes
For population 15 years and over in 19031:
Never married: 34.0%
Now married: 47.5%
Separated: 1.2%
Widowed: 6.0%
Divorced: 11.3%
Zip code 19031 compared to state average:
Median household income above state average.
Median house value above state average.
Hispanic race population percentage significantly below state average.
Median age above state average.
Renting percentage below state average.
Number of rooms per house above state average.
Percentage of population with a bachelor's degree or higher above state average.
Estimated median house/condo value in 2022: $525,405
19031:
$525,405
Pennsylvania:
$245,500
According to our research of Pennsylvania and other state lists, there were 6 registered sex offenders living in 19031 zip code as of July 18, 2024. The ratio of all residents to sex offenders in zip code 19031 is 820 to 1. The ratio of registered sex offenders to all residents in this zip code is lower than the state average.
Median resident age:
This zip code:
48.8 years
Pennsylvania median age:
40.9 years
Average household size:
This zip code:
2.3 people
Pennsylvania:
2.4 people
Averages for the 2020 tax year for zip code 19031, filed in 2021:
Average Adjusted Gross Income (AGI) in 2020: $165,967 (Individual Income Tax Returns)
Here:
$165,967
State:
$75,707
Salary/wage: $128,499 (reported on 76.6% of returns)
Here:
$128,499
State:
$62,806
(% of AGI for various income ranges: 1028.3% for AGIs below $25k, 3153.8% for AGIs $25k-50k, 6102.6% for AGIs $50k-75k, 9223.6% for AGIs $75k-100k, 19800.6% for AGIs $100k-200k, 139395.5% for AGIs over 200k)
Taxable interest for individuals: $3,526 (reported on 51.6% of returns)
This zip code:
$3,526
Pennsylvania:
$1,633
(% of AGI for various income ranges: 34.3% for AGIs below $25k, 38.3% for AGIs $25k-50k, 57.9% for AGIs $50k-75k, 150.7% for AGIs $75k-100k, 223.7% for AGIs $100k-200k, 3110.9% for AGIs over 200k)
Ordinary dividends: $14,005 (reported on 46.5% of returns)
Here:
$14,005
State:
$7,382
(% of AGI for various income ranges: 125.3% for AGIs below $25k, 194.6% for AGIs $25k-50k, 300.5% for AGIs $50k-75k, 622.9% for AGIs $75k-100k, 727.8% for AGIs $100k-200k, 10955.5% for AGIs over 200k)
Net capital gain/loss in AGI: +$47,462 (reported on 41.0% of returns)
Here:
+$47,462
State:
+$23,522
(% of AGI for various income ranges: 45.7% for AGIs below $25k, 114.2% for AGIs $25k-50k, 105.3% for AGIs $50k-75k, 319.3% for AGIs $75k-100k, 969.7% for AGIs $100k-200k, 41521.8% for AGIs over 200k)
Profit/loss from business: +$42,130 (reported on 19.5% of returns)
Here:
+$42,130
State:
+$16,274
(% of AGI for various income ranges: 133.7% for AGIs below $25k, 205.4% for AGIs $25k-50k, 570.5% for AGIs $50k-75k, 597.9% for AGIs $75k-100k, 1110.0% for AGIs $100k-200k, 13361.8% for AGIs over 200k)
Taxable individual retirement arrangement distribution: $22,992 (reported on 14.5% of returns)
19031:
$22,992
Pennsylvania:
$18,583
(% of AGI for various income ranges: 122.0% for AGIs below $25k, 262.1% for AGIs $25k-50k, 267.4% for AGIs $50k-75k, 775.0% for AGIs $75k-100k, 768.4% for AGIs $100k-200k, 3145.5% for AGIs over 200k)
Self-employed (Keogh) retirement plans: $25,725 (reported on 3.1% of returns)
19031:
$25,725
Pennsylvania:
$25,407
(% of AGI for various income ranges: 181.4% for AGIs $75k-100k, 1640.0% for AGIs over 200k)
Total itemized deductions: $38,798 (reported on 20.7% of returns)
Here:
$38,798
State:
$34,850
(% of AGI for various income ranges: 201.0% for AGIs below $25k, 282.1% for AGIs $25k-50k, 655.3% for AGIs $50k-75k, 1025.0% for AGIs $75k-100k, 1119.7% for AGIs $100k-200k, 11836.4% for AGIs over 200k)
Charity contributions: $14,776 (reported on 17.6% of returns)
Here:
$14,776
State:
$12,392
(% of AGI for various income ranges: 30.0% for AGIs below $25k, 93.2% for AGIs $50k-75k, 157.9% for AGIs $75k-100k, 246.6% for AGIs $100k-200k, 4883.6% for AGIs over 200k)
Taxes paid: $8,883 (reported on 20.7% of returns)
19031:
$8,883
State:
$8,200
(% of AGI for various income ranges: 45.7% for AGIs below $25k, 62.5% for AGIs $25k-50k, 177.9% for AGIs $50k-75k, 282.9% for AGIs $75k-100k, 367.5% for AGIs $100k-200k, 2282.7% for AGIs over 200k)
Earned income credit: $1,517 (reported on 4.7% of returns)
Here:
$1,517
State:
$2,100
(% of AGI for various income ranges: 38.0% for AGIs below $25k, 28.3% for AGIs $25k-50k)
Percentage of individuals using paid preparers for their 2020 taxes: 90.2%
Here:
90%
State:
92%
(% for various income ranges: 85.0% for AGIs below $25k, 90.9% for AGIs $25k-50k, 93.1% for AGIs $50k-75k, 91.7% for AGIs $75k-100k, 91.5% for AGIs $100k-200k, 92.2% for AGIs over 200k)
Averages for the 2012 tax year for zip code 19031, filed in 2013:
Average Adjusted Gross Income (AGI) in 2012: $107,163 (Individual Income Tax Returns)
Here:
$107,163
State:
$61,346
Salary/wage: $85,982 (reported on 79.3% of returns)
Here:
$85,982
State:
$51,902
(% of AGI for various income ranges: 61.6% for AGIs below $25k, 69.5% for AGIs $25k-50k, 72.4% for AGIs $50k-75k, 72.0% for AGIs $75k-100k, 77.2% for AGIs $100k-200k, 52.1% for AGIs over 200k)
Taxable interest for individuals: $1,861 (reported on 53.7% of returns)
This zip code:
$1,861
Pennsylvania:
$1,588
(% of AGI for various income ranges: 3.2% for AGIs below $25k, 1.5% for AGIs $25k-50k, 0.7% for AGIs $50k-75k, 0.7% for AGIs $75k-100k, 0.8% for AGIs $100k-200k, 0.9% for AGIs over 200k)
Ordinary dividends: $9,604 (reported on 42.7% of returns)
Here:
$9,604
State:
$5,827
(% of AGI for various income ranges: 6.8% for AGIs below $25k, 3.4% for AGIs $25k-50k, 2.3% for AGIs $50k-75k, 3.2% for AGIs $75k-100k, 3.0% for AGIs $100k-200k, 4.5% for AGIs over 200k)
Net capital gain/loss in AGI: +$17,650 (reported on 34.4% of returns)
Here:
+$17,650
State:
+$14,495
(% of AGI for various income ranges: 0.5% for AGIs $25k-50k, 1.6% for AGIs $50k-75k, 1.3% for AGIs $75k-100k, 2.2% for AGIs $100k-200k, 10.2% for AGIs over 200k)
Profit/loss from business: +$25,658 (reported on 18.9% of returns)
Here:
+$25,658
State:
+$16,268
(% of AGI for various income ranges: 9.6% for AGIs below $25k, 9.2% for AGIs $25k-50k, 4.1% for AGIs $50k-75k, 4.7% for AGIs $75k-100k, 4.4% for AGIs $100k-200k, 3.8% for AGIs over 200k)
Taxable individual retirement arrangement distribution: $20,994 (reported on 15.4% of returns)
19031:
$20,994
Pennsylvania:
$14,550
(% of AGI for various income ranges: 5.7% for AGIs below $25k, 4.3% for AGIs $25k-50k, 4.7% for AGIs $50k-75k, 3.4% for AGIs $75k-100k, 2.9% for AGIs $100k-200k, 2.4% for AGIs over 200k)
Self-employment retirement plans: $34,300 (reported on 2.2% of returns)
19031:
$34,300
Pennsylvania:
$20,922
Total itemized deductions: $29,827 (17% of AGI, reported on 52.9% of returns)
Here:
$29,827
State:
$23,538
Here:
17.2% of AGI
State:
18.4% of AGI
(% of AGI for various income ranges: 19.9% for AGIs below $25k, 15.6% for AGIs $25k-50k, 16.4% for AGIs $50k-75k, 19.0% for AGIs $75k-100k, 17.6% for AGIs $100k-200k, 11.5% for AGIs over 200k)
Charity contributions: $4,039 (reported on 46.7% of returns)
Here:
$4,039
State:
$4,025
(% of AGI for various income ranges: 1.6% for AGIs below $25k, 1.5% for AGIs $25k-50k, 1.5% for AGIs $50k-75k, 2.3% for AGIs $75k-100k, 1.8% for AGIs $100k-200k, 1.7% for AGIs over 200k)
Taxes paid: $14,022 (reported on 52.4% of returns)
19031:
$14,022
State:
$9,982
(% of AGI for various income ranges: 6.0% for AGIs below $25k, 5.7% for AGIs $25k-50k, 6.6% for AGIs $50k-75k, 7.9% for AGIs $75k-100k, 8.3% for AGIs $100k-200k, 6.0% for AGIs over 200k)
Earned income credit: $1,392 (reported on 5.7% of returns)
Here:
$1,392
State:
$2,106
(% of AGI for various income ranges: 1.9% for AGIs below $25k, 0.4% for AGIs $25k-50k)
Percentage of individuals using paid preparers for their 2012 taxes: 57.7%
Here:
58%
State:
53%
(% for various income ranges: 50.0% for AGIs below $25k, 55.3% for AGIs $25k-50k, 60.0% for AGIs $50k-75k, 60.0% for AGIs $75k-100k, 60.4% for AGIs $100k-200k, 75.0% for AGIs over 200k)
Averages for the 2004 tax year for zip code 19031, filed in 2005:
Average Adjusted Gross Income (AGI) in 2004: $82,083 (Individual Income Tax Returns)
Here:
$82,083
State:
$48,049
Salary/wage: $71,783 (reported on 78.1% of returns)
Here:
$71,783
State:
$42,646
(% of AGI for various income ranges: 139.1% for AGIs below $10k, 51.7% for AGIs $10k-25k, 67.6% for AGIs $25k-50k, 74.0% for AGIs $50k-75k, 78.9% for AGIs $75k-100k, 65.7% for AGIs over 100k)
Taxable interest for individuals: $2,330 (reported on 65.9% of returns)
This zip code:
$2,330
Pennsylvania:
$1,657
(% of AGI for various income ranges: 14.6% for AGIs below $10k, 5.7% for AGIs $10k-25k, 3.1% for AGIs $25k-50k, 1.7% for AGIs $50k-75k, 1.7% for AGIs $75k-100k, 1.5% for AGIs over 100k)
Taxable dividends: $5,087 (reported on 52.4% of returns)
Here:
$5,087
State:
$3,566
(% of AGI for various income ranges: 22.2% for AGIs below $10k, 6.4% for AGIs $10k-25k, 4.1% for AGIs $25k-50k, 2.6% for AGIs $50k-75k, 2.6% for AGIs $75k-100k, 3.1% for AGIs over 100k)
Net capital gain/loss: +$12,447 (reported on 40.2% of returns)
Here:
+$12,447
State:
+$9,716
(% of AGI for various income ranges: -10.1% for AGIs below $10k, 1.2% for AGIs $10k-25k, 0.9% for AGIs $25k-50k, 2.0% for AGIs $50k-75k, 1.7% for AGIs $75k-100k, 8.6% for AGIs over 100k)
Profit/loss from business: +$20,372 (reported on 16.5% of returns)
Here:
+$20,372
State:
+$14,267
(% of AGI for various income ranges: -1.6% for AGIs below $10k, 8.2% for AGIs $10k-25k, 7.5% for AGIs $25k-50k, 7.8% for AGIs $50k-75k, 3.7% for AGIs $75k-100k, 3.0% for AGIs over 100k)
IRA payment deduction: $3,324 (reported on 4.5% of returns)
19031:
$3,324
Pennsylvania:
$2,903
(% of AGI for various income ranges: 0.7% for AGIs $25k-50k, 0.5% for AGIs $50k-75k, 0.1% for AGIs $75k-100k, 0.1% for AGIs over 100k)
Self-employed pension: $14,983 (reported on 2.6% of returns)
Here:
$14,983
Pennsylvania:
$14,674
Total itemized deductions: $23,661 (18% of AGI, reported on 53.5% of returns)
Here:
$23,661
State:
$18,804
Here:
18.0% of AGI
State:
19.5% of AGI
(% of AGI for various income ranges: 23.7% for AGIs below $10k, 20.2% for AGIs $10k-25k, 16.9% for AGIs $25k-50k, 19.2% for AGIs $50k-75k, 19.5% for AGIs $75k-100k, 13.6% for AGIs over 100k)
Charity contributions deductions: $4,065 (3% of AGI, reported on 50.1% of returns)
Here:
$4,065
State:
$3,337
Here:
3.0% of AGI
State:
3.3% of AGI
(% of AGI for various income ranges: 1.6% for AGIs below $10k, 2.1% for AGIs $10k-25k, 2.5% for AGIs $25k-50k, 2.5% for AGIs $50k-75k, 2.7% for AGIs $75k-100k, 2.5% for AGIs over 100k)
Total tax: $16,706 (reported on 82.3% of returns)
19031:
$16,706
State:
$8,008
(% of AGI for various income ranges: 4.1% for AGIs below $10k, 4.8% for AGIs $10k-25k, 8.6% for AGIs $25k-50k, 10.5% for AGIs $50k-75k, 10.5% for AGIs $75k-100k, 20.6% for AGIs over 100k)
Earned income credit: $1,253 (reported on 4.0% of returns)
Here:
$1,253
State:
$1,643
Percentage of individuals using paid preparers for their 2004 taxes: 56.8%
Here:
57%
State:
56%
(% for various income ranges: 52.5% for AGIs below $10k, 53.3% for AGIs $10k-25k, 55.1% for AGIs $25k-50k, 56.8% for AGIs $50k-75k, 61.0% for AGIs $75k-100k, 62.2% for AGIs over 100k)
Likely homosexual households (counted as self-reported same-sex unmarried-partner households)
Lesbian couples: 0.2% of all households
Gay men: 0.0% of all households
Household received Food Stamps/SNAP in the past 12 months: 121 Household did not receive Food Stamps/SNAP in the past 12 months: 2,000
Women who had a birth in the past 12 months: 14 (15 now married, 0 unmarried) Women who did not have a birth in the past 12 months: 917 (327 now married, 590 unmarried)
Housing units in zip code 19031 with a mortgage: 1,017 (62 second mortgage, 49 both second mortgage and home equity loan) Houses without a mortgage: 48
Median monthly owner costs for units with a mortgage: $2,562 Median monthly owner costs for units without a mortgage: $1,064
Residents with income below the poverty level in 2022:
This zip code:
3.2%
Whole state:
11.8%
Residents with income below 50% of the poverty level in 2022:
This zip code:
1.4%
Whole state:
6.1%
Median number of rooms in houses and condos:
Here:
8.0
State:
6.8
Median number of rooms in apartments:
Here:
3.1
State:
4.3
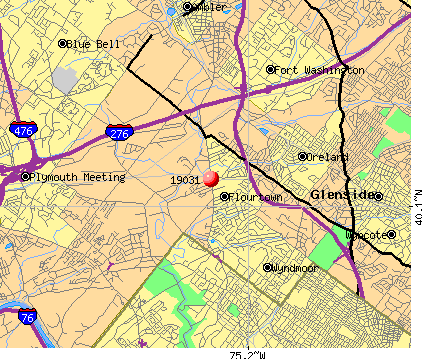
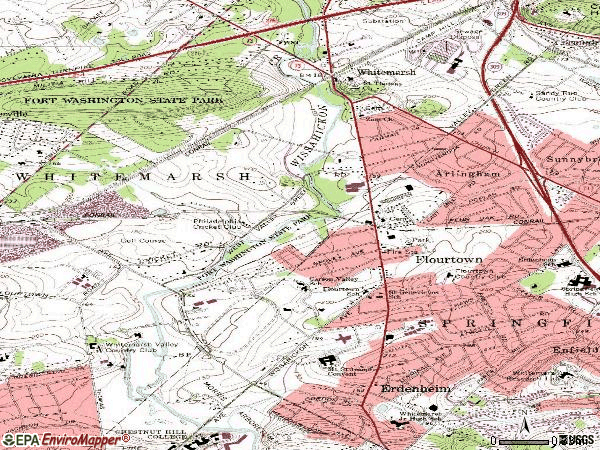
Notable locations in this zip code not listed on our city pages
Notable locations in zip code 19031: Eagle Lodge Golf Course (A), Flourtown Country Club (B), Philadelphia Cricket Club (C), Flourtown Fire Company (D). Display/hide their locations on the map
557 married couples with children.
202 single-parent households (67 men, 135 women).
92.2% of residents of 19031 zip code speak English at home.
1.2% of residents speak Spanish at home (100% very well).
1.6% of residents speak other Indo-European language at home (79% very well, 12% well, 9% not well).
4.7% of residents speak Asian or Pacific Island language at home (71% very well, 25% not well, 4% not at all).
0.4% of residents speak other language at home (100% very well).
Foreign born population: 344 (6.7%) (83.5% of them are naturalized citizens)
This zip code:
6.7%
Whole state:
7.5%
53%Japan
7%China, excluding Hong Kong and Taiwan
5%Romania
5%Guyana
4%Greece
4%France
3%Iraq
26%Irish
10%Italian
8%German
4%Polish
3%American
3%English
2%Russian
Year of entry for the foreign-born population
632010 or later
492000 to 2009
651990 to 1999
206Before 1990
Facilities with environmental interests located in this zip code:
AMOCO SS 1269 (1680 BETHLEHEM PIKE in FLOURTOWN, PA)
STATE MASTER (Pennsylvania database) - PCS-PAG050011, National Pollutant Discharge Elimination System Permit National Pollutant Discharge Elimination System NON-MAJOR (Tracking pollutant discharge elimination systems) - permit Business SIC classification: GROCERY STORES Organizations: BP PRODUCTS NORTH AMERICA INC. (CONTACT/OWNER)
Alternative names: B P AMOCO SERVICES STATION 126, BP AMOCO CORP STATION 1269, BP AMOCO SERVICE STATION 1269
ATLANTIC SVC STA (1311 BETHLEHEM PIKE TANKS in FLOURTOWN, PA)
AAMCO TRANS - CONNELL, FRANCIS X (1527 BETHLEHEM PK in FLOURTOWN, PA)
Small Quantity Generators, between 100 kg and 1000 kg of hazardous waste/month (Resource Conservation and Recovery Act (tracking hazardous waste)) - notification Organizations: OPERNAME (CONTACT/OPERATOR)
COMPLIANCE ACTIVITY (Tracking inspections of insecticide, fungicide, and rodenticide, and toxic substances) Alternative names: TRIDENT MARINE MANUF.
AMOCO 1269 TANKS (305 PENN OAK RD in FLOURTOWN, PA)
Small Quantity Generators, between 100 kg and 1000 kg of hazardous waste/month (Resource Conservation and Recovery Act (tracking hazardous waste)) - notification Organizations: AMOCO OIL COMPANY (CONTACT/OWNER)
Housing units lacking complete plumbing facilities: 0.3% Housing units lacking complete kitchen facilities: 2.3%
67.4%Utility gas
16.3%Electricity
9.5%Fuel oil, kerosene, etc.
4.3%Bottled, tank, or LP gas
1.4%Wood
1.3%No fuel used
Population in 1990: 4,284. Population change in the 1990s: +440 (+10.3%).
Place of birth for U.S.-born residents:
This state: 3,863
Northeast: 602
Midwest: 106
South: 147
West: 9
64% of the 19031 zip code residents lived in the same house 5 years ago. Out of people who lived in different houses, 53% lived in this county. Out of people who lived in different counties, 50% lived in Pennsylvania.
91% of the 19031 zip code residents lived in the same house 1 year ago. Out of people who lived in different houses, 51% moved from this county. Out of people who lived in different houses, 29% moved from different county within same state. Out of people who lived in different houses, 14% moved from different state. Out of people who lived in different houses, 6% moved from abroad.
Private vs. public school enrollment:
Students in private schools in grades 1 to 8 (elementary and middle school): 23
Here:
7.3%
Pennsylvania:
15.7%
Students in private schools in grades 9 to 12 (high school): 103
Here:
27.4%
Pennsylvania:
13.4%
Students in private undergraduate colleges: 138
Here:
63.3%
Pennsylvania:
39.8%
Occupation by median earnings in the past 12 months ($)
217,377Construction and extraction occupations
173,877Life, physical, and social science occupations
171,323Management occupations
145,577Law enforcement workers including supervisors
109,771Computer and mathematical occupations
106,909Architecture and engineering occupations
Companies with federal contracts located in this zip code:
MOTSON GRAPHICS, INC (1717 BETHLEHEM PIKE in FLOURTOWN, PA) : $104,605 in 3 contractsin 2004
$80,000 with Navy for Miscellaneous Items. Taking place in NJ. Signed on 2004-03-17. Completion date: 2004-04-30.
$20,916 with Defense Logistics Agency for Lathes. Taking place in NJ. Signed on 2004-11-12. Completion date: 2005-01-25.
$3,689 with Defense Logistics Agency for Engine Instruments. Taking place in NJ. Signed on 2004-11-24. Completion date: 2005-04-02.
Top industries in this zip code by the number of employees in 2005:
Health Care and Social Assistance: Nursing Care Facilities (250-499 employees: 1 establishment, 100-249 employees: 1 establishment, 10-19 employees: 1 establishment, 5-9 employees: 1 establishment)
Health Care and Social Assistance: Other Residential Care Facilities (250-499: 1)
Health Care and Social Assistance: Offices of Physicians (except Mental Health Specialists) (50-99: 1, 20-49: 3, 10-19: 4, 5-9: 1, 1-4: 7)
2004 - 2018 National Fire Incident Reporting System (NFIRS) incidents
According to the data from the years 2004 - 2018 the average number of fires per year is 19. The highest number of fires - 48 took place in 2016, and the least - 0 in 2009. The data has a rising trend.
When looking into fire subcategories, the most reports belonged to: Structure Fires (61.0%), and Outside Fires (23.0%).
Fire incident types reported to NFIRS in Zip Code 19031


 Nearest zip codes: 19034, 19075, 19118, 19444, 19038, 19150.


 According to the data from the years 2004 - 2018 the average number of fires per year is 19. The highest number of fires - 48 took place in 2016, and the least - 0 in 2009. The data has a rising trend.
 When looking into fire subcategories, the most reports belonged to: Structure Fires (61.0%), and Outside Fires (23.0%).